

Key Insights
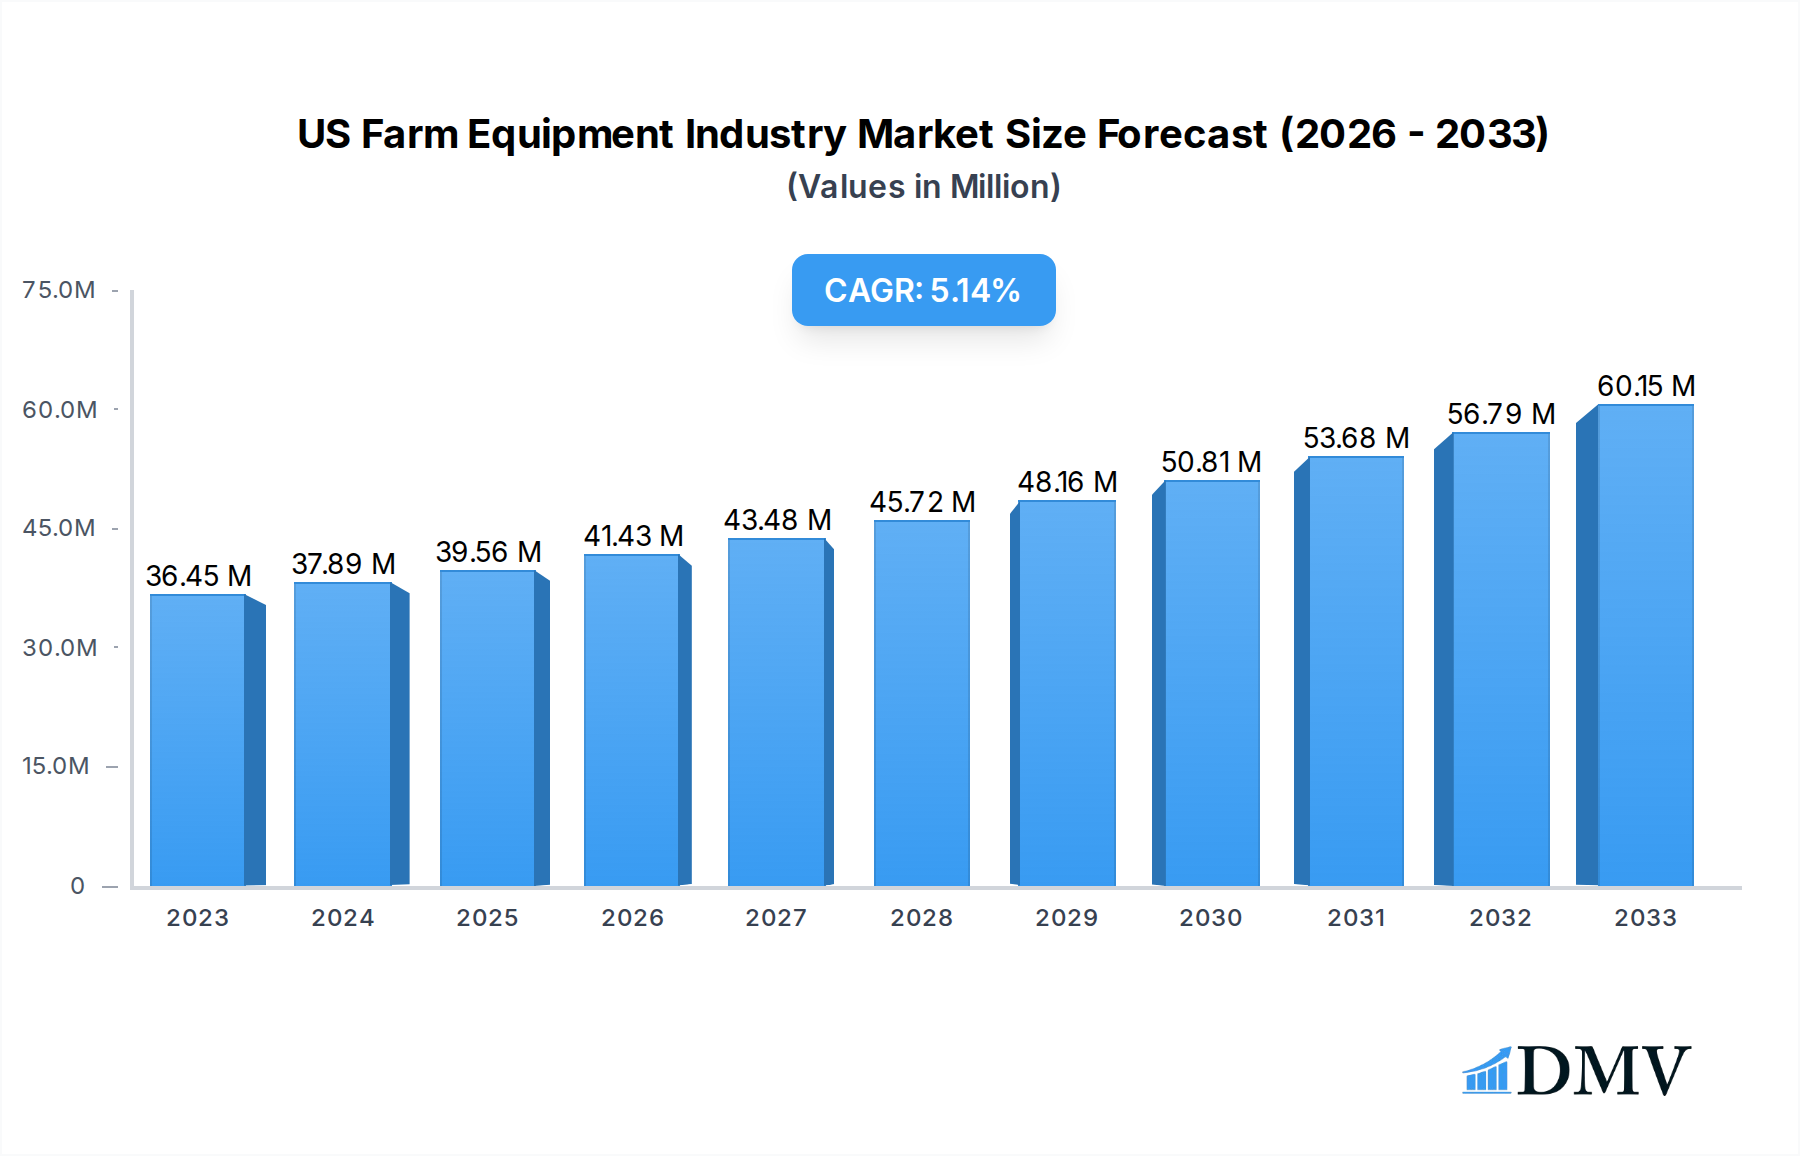
The US Farm Equipment Industry is poised for significant expansion, with a projected market size of $39.56 billion by 2025. This robust growth is underpinned by a Compound Annual Growth Rate (CAGR) of 6.30% forecasted through 2033, indicating sustained momentum. The industry's strength is driven by several critical factors. The increasing global demand for food, fueled by a rising population, necessitates greater agricultural output and, consequently, advanced farm machinery. Furthermore, ongoing technological advancements, such as the integration of precision agriculture, automation, and smart farming solutions, are enhancing operational efficiency and productivity, making modern farm equipment a compelling investment for farmers seeking to optimize their yields and reduce costs. Government initiatives and subsidies aimed at modernizing agricultural practices also play a crucial role in stimulating demand for new and sophisticated farm equipment.

US Farm Equipment Industry Market Size (In Million)
While the outlook is overwhelmingly positive, certain challenges temper the industry's trajectory. High initial investment costs for advanced farm machinery can be a barrier for smaller farms, limiting their adoption of the latest technologies. Moreover, fluctuating commodity prices and unpredictable weather patterns can impact farmer profitability, influencing their capital expenditure decisions on equipment. Labor shortages in the agricultural sector also present a complex dynamic; while this may drive demand for automated equipment, it also poses operational challenges for farms. The industry is actively navigating these restraints through innovation in financing options, the development of more accessible technology tiers, and a continued focus on enhancing the efficiency and cost-effectiveness of farm equipment solutions. The competitive landscape features major global players like Deere and Company, KUBOTA Corporation, and CNH Industrial, all vying for market share through product innovation and strategic partnerships.
US Farm Equipment Industry Company Market Share
US Farm Equipment Industry Market Composition & Trends
The US farm equipment market is characterized by a robust yet dynamic landscape, driven by a blend of established players and emerging technologies. Market concentration is significant, with giants like Deere & Company, CNH Industrial, and AGCO Corporation holding substantial shares. Innovation remains a primary catalyst, fueled by advancements in precision agriculture, automation, and connectivity. The regulatory environment, while generally supportive of agricultural productivity, can present challenges concerning emissions and safety standards. Substitute products, such as older equipment or rental services, exist but often fall short of the efficiency and capabilities offered by modern machinery. End-user profiles are diverse, ranging from large-scale commercial farms to smaller family operations, each with distinct equipment needs and purchasing power. Mergers and acquisitions (M&A) are a critical feature, shaping market consolidation and technology adoption. Recent M&A activities, valued in the hundreds of millions of dollars, signal a strategic push towards enhancing R&D and expanding product portfolios. For instance, AGCO's acquisition of JCA Industries underscores the drive for augmented engineering and software development in advanced machinery. Market share distribution is influenced by factors such as product innovation, dealer networks, and brand reputation.
- Market Concentration: Dominated by a few major corporations.
- Innovation Catalysts: Precision agriculture, automation, IoT integration.
- Regulatory Landscape: Environmental standards, safety regulations, and government subsidies.
- Substitute Products: Used equipment markets, equipment rental services.
- End-User Profiles: Large commercial farms, medium-sized farms, small family farms.
- M&A Activities: Strategic acquisitions to gain technological edge and market share.
US Farm Equipment Industry Industry Evolution
The evolution of the US farm equipment industry has been a story of relentless innovation and adaptation, transforming agricultural practices from labor-intensive to highly mechanized and intelligent operations. Over the historical period of 2019-2024, the market witnessed steady growth, propelled by the increasing need for enhanced productivity and efficiency to meet rising global food demand. This growth trajectory was significantly influenced by technological advancements, particularly in the realms of GPS-guided machinery, variable rate technology, and data analytics for crop management. The base year of 2025 marks a pivotal point, with the estimated market poised for further expansion. The forecast period of 2025–2033 promises accelerated adoption of advanced solutions, driven by a confluence of factors including labor shortages, environmental concerns, and the economic imperative to optimize resource utilization. Consumer demand has shifted demonstrably towards smarter, more sustainable, and connected farming solutions. Farmers are increasingly seeking equipment that not only performs core tasks but also provides actionable insights through integrated sensors and software. This shift is evident in the growing market for autonomous tractors, robotic harvesters, and drone-based monitoring systems. The adoption metrics for these technologies are on an upward trend, indicating a strong market appetite for cutting-edge farm equipment. The industry has moved beyond simple mechanization to embrace intelligent automation and data-driven decision-making, fundamentally reshaping the agricultural landscape. Market growth rates are projected to be robust, with an estimated average annual growth rate (AAGR) of approximately 5.5% from 2025 to 2033, fueled by continuous investment in research and development and a strong demand from the agricultural sector.
Leading Regions, Countries, or Segments in US Farm Equipment Industry
The dominance within the US farm equipment industry is multifaceted, with specific regions, countries, and segments showcasing remarkable performance and growth drivers. In terms of Production Analysis, the Midwest region of the United States, often referred to as the "Corn Belt," stands out as a leading hub due to its vast agricultural land, significant crop production, and established infrastructure for manufacturing and distribution of farm machinery. This concentration of agricultural activity naturally fuels a higher demand for a wide array of farm equipment.
For Consumption Analysis, the same agricultural heartland regions that lead in production also exhibit the highest consumption of farm equipment. States like Iowa, Illinois, and Nebraska, with their extensive row crop farming, require sophisticated machinery for planting, harvesting, and tillage, driving substantial market uptake.
The Import Market Analysis (Value & Volume) often sees significant contributions from countries specializing in tractor manufacturing and specific componentry. While the US is a major producer, imports play a crucial role in fulfilling diverse market needs and offering competitive pricing. Countries like India and China are key players in the import market for lower horsepower tractors and certain agricultural implements, contributing substantially to the import value and volume.
Conversely, the Export Market Analysis (Value & Volume) highlights the global competitiveness of US-manufactured farm equipment, particularly high-end, technologically advanced machinery. Canada and countries in Latin America represent major export destinations, drawn to the quality, innovation, and reliability of American-made tractors, combines, and specialized equipment. The value of these exports is often high due to the advanced nature of the machinery.
In Price Trend Analysis, the US market experiences fluctuations influenced by global commodity prices, raw material costs (steel, hydraulics), and the pace of technological innovation. While base equipment prices can be relatively stable, the integration of advanced technologies like GPS, sensors, and autonomous capabilities significantly increases the price point, reflecting higher R&D investment and enhanced functionality.
Key Drivers for Dominance:
- Investment Trends: Sustained investment in R&D by leading companies and government support for agricultural technology adoption.
- Regulatory Support: Favorable agricultural policies and incentives that encourage investment in modern farming equipment.
- Technological Advancements: Leadership in developing and implementing precision agriculture, automation, and connectivity solutions.
- Infrastructure: Well-developed supply chains, manufacturing capabilities, and extensive dealer networks.
- Farming Practices: Large-scale farming operations demanding high-capacity and specialized equipment.
- Global Demand: A strong export market for advanced agricultural machinery manufactured in the US.
US Farm Equipment Industry Product Innovations
The US farm equipment industry is experiencing a surge of product innovations aimed at enhancing efficiency, sustainability, and operator comfort. Leading companies are introducing advanced autonomous and semi-autonomous solutions, such as driverless tillage and harvest assistance systems from CNH Industrial, and pioneering robotic sprayers like those developed through the Deere & Company and GUSS Automation joint venture. These innovations leverage AI, machine learning, and advanced sensor technology to optimize resource application, reduce labor dependency, and improve field performance. AGCO's acquisition of JCA Industries further signifies a commitment to accelerating the development of highly automated and autonomous machines, reflecting a market trend towards intelligent agricultural solutions. The performance metrics of these new products focus on increased yield, reduced input costs, minimized environmental impact, and enhanced operational safety. Unique selling propositions include precision application of fertilizers and pesticides, automated planting and harvesting processes, and real-time data analytics for improved decision-making, ultimately driving higher farm profitability.
Propelling Factors for US Farm Equipment Industry Growth
Several key factors are propelling the growth of the US farm equipment industry.
- Technological Advancements: The relentless integration of precision agriculture, IoT, AI, and automation is driving demand for smarter, more efficient machinery. Initiatives like autonomous tractors and data-driven farm management systems are key growth catalysts.
- Increasing Food Demand: A growing global population necessitates higher agricultural output, directly translating to a greater need for advanced farm equipment to boost productivity.
- Labor Shortages: The scarcity of skilled agricultural labor is pushing farmers towards automated and mechanized solutions, making advanced equipment an attractive investment.
- Government Initiatives & Subsidies: Supportive agricultural policies and financial incentives from government bodies encourage farmers to invest in modernizing their equipment and adopting new technologies.
- Focus on Sustainability: Growing environmental concerns are driving the demand for equipment that optimizes resource usage (water, fertilizer, fuel) and minimizes ecological impact.
Obstacles in the US Farm Equipment Industry Market
Despite robust growth, the US farm equipment industry faces several obstacles.
- Supply Chain Disruptions: Global supply chain volatility, including shortages of critical components like semiconductors and raw materials, can lead to production delays and increased costs.
- High Initial Investment Costs: Advanced farm equipment, particularly autonomous and precision technology, carries a significant upfront cost, which can be a barrier for smaller or medium-sized farms.
- Regulatory Hurdles: Evolving environmental regulations and safety standards can necessitate costly upgrades or redesigns of existing equipment.
- Skilled Labor for Maintenance: While automation addresses labor shortages in operations, a shortage of skilled technicians for maintaining complex, high-tech equipment can pose challenges.
- Economic Uncertainty: Fluctuations in agricultural commodity prices and broader economic downturns can impact farmers' purchasing power and willingness to invest in new machinery.
Future Opportunities in US Farm Equipment Industry
The US farm equipment industry is ripe with future opportunities.
- Expansion of Autonomous & Robotic Solutions: The continued development and adoption of fully autonomous tractors, robotic harvesting, and AI-powered farm management systems represent a significant growth frontier.
- Data Analytics & AI Integration: Opportunities abound in creating sophisticated platforms that analyze vast amounts of farm data to provide actionable insights for yield optimization, predictive maintenance, and resource management.
- Sustainable Agriculture Technologies: Developing and marketing equipment that enhances water efficiency, reduces chemical usage, and promotes soil health aligns with growing global demand for sustainable farming practices.
- Electrification of Farm Equipment: The transition towards electric-powered tractors and machinery offers a cleaner, quieter, and potentially more cost-effective alternative, presenting a substantial market opportunity.
- Smart Farming Ecosystems: Building integrated smart farming ecosystems that connect various farm machinery, sensors, and software platforms will create new revenue streams and enhance customer loyalty.
Major Players in the US Farm Equipment Industry Ecosystem
- Kverneland Group
- JOST Werke AG (Alo)
- Kuhn Group Inc
- Deere and Company
- KUBOTA Corporation
- CNH Industrial
- Farmtrac Tractor Europe
- AGCO Corporation
- Deutz-Fahr
- Mahindra Agriculture North America
- Claas KGaA mbH
Key Developments in US Farm Equipment Industry Industry
- December 2022: CNH Industrial enhanced its Ag Tech portfolio by introducing new Automation and Autonomy Solutions in Phoenix, Arizona, USA. These include driverless tillage and driver-assist harvest solutions from Raven, and Baler Automation from Case IH and New Holland, aimed at boosting productivity and addressing farmer challenges.
- May 2022: AGCO Corporation acquired JCA Industries, significantly increasing its engineering and software development capabilities, and accelerating the development of highly automated and autonomous machinery.
- April 2022: Deere & Company and GUSS Automation established a joint venture (LLC) in Kingsburg, California. This collaboration leverages GUSS Automation's pioneering role in semi-autonomous sprayers for orchards and vineyards.
Strategic US Farm Equipment Industry Market Forecast
The strategic forecast for the US farm equipment industry is highly optimistic, driven by an unyielding commitment to technological innovation and the growing imperative for agricultural efficiency. The continuous development and integration of precision agriculture, automation, and artificial intelligence will be pivotal growth catalysts, enabling farmers to achieve higher yields with reduced input costs. The anticipated widespread adoption of autonomous tractors, robotic harvesting systems, and advanced data analytics platforms will redefine farming operations. Furthermore, the increasing global demand for food, coupled with the persistent challenge of labor shortages in agriculture, will further propel the adoption of these advanced machinery solutions. The industry's focus on sustainable farming practices and the emerging trend towards electrification of farm equipment also present significant growth avenues, aligning with environmental consciousness and long-term operational cost savings. These converging factors paint a picture of sustained growth and substantial market potential for the US farm equipment sector.
US Farm Equipment Industry Segmentation
- 1. Production Analysis
- 2. Consumption Analysis
- 3. Import Market Analysis (Value & Volume)
- 4. Export Market Analysis (Value & Volume)
- 5. Price Trend Analysis
US Farm Equipment Industry Segmentation By Geography
-
1. North America
- 1.1. United States
- 1.2. Canada
- 1.3. Mexico
-
2. South America
- 2.1. Brazil
- 2.2. Argentina
- 2.3. Rest of South America
-
3. Europe
- 3.1. United Kingdom
- 3.2. Germany
- 3.3. France
- 3.4. Italy
- 3.5. Spain
- 3.6. Russia
- 3.7. Benelux
- 3.8. Nordics
- 3.9. Rest of Europe
-
4. Middle East & Africa
- 4.1. Turkey
- 4.2. Israel
- 4.3. GCC
- 4.4. North Africa
- 4.5. South Africa
- 4.6. Rest of Middle East & Africa
-
5. Asia Pacific
- 5.1. China
- 5.2. India
- 5.3. Japan
- 5.4. South Korea
- 5.5. ASEAN
- 5.6. Oceania
- 5.7. Rest of Asia Pacific
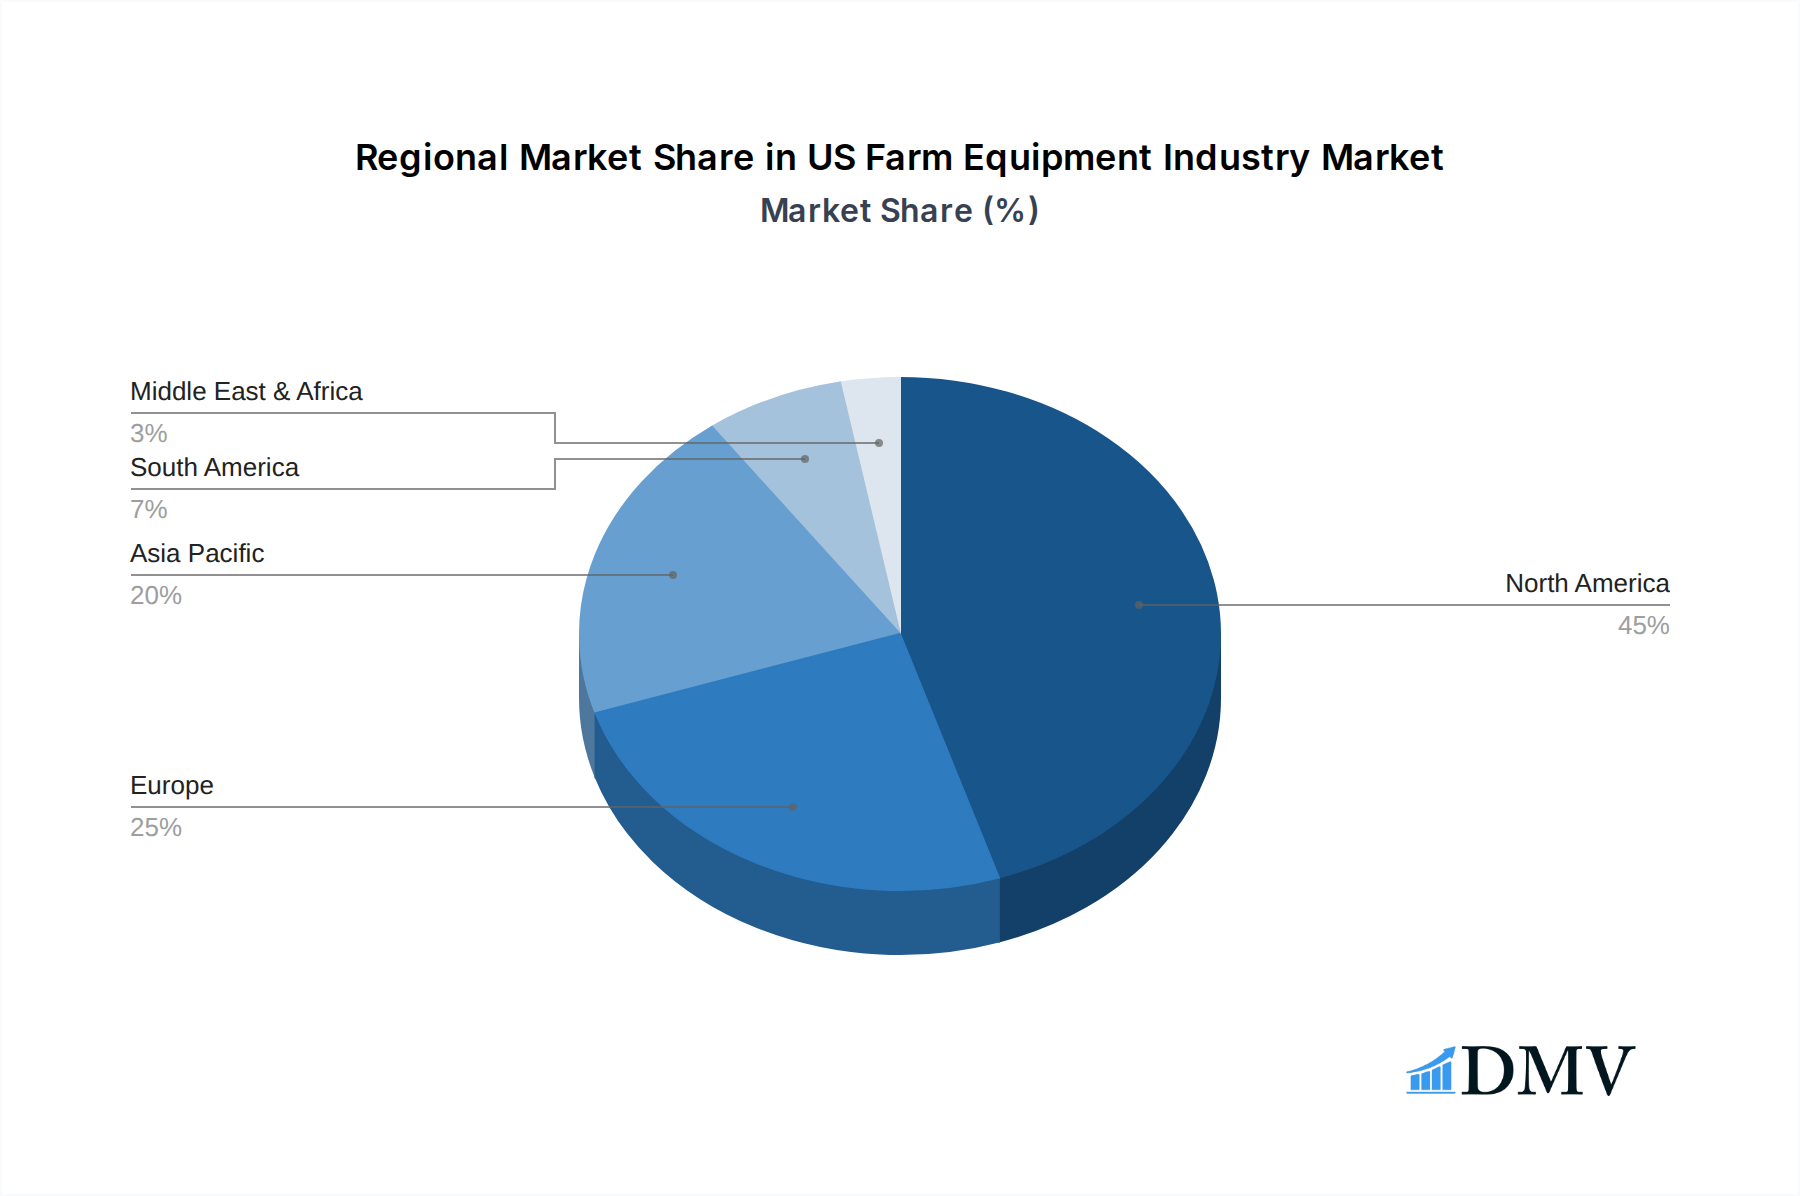
US Farm Equipment Industry Regional Market Share
Geographic Coverage of US Farm Equipment Industry
US Farm Equipment Industry REPORT HIGHLIGHTS
| Aspects | Details |
|---|---|
| Study Period | 2020-2034 |
| Base Year | 2025 |
| Estimated Year | 2026 |
| Forecast Period | 2026-2034 |
| Historical Period | 2020-2025 |
| Growth Rate | CAGR of 6.30% from 2020-2034 |
| Segmentation |
|
Table of Contents
- 1. Introduction
- 1.1. Research Scope
- 1.2. Market Segmentation
- 1.3. Research Objective
- 1.4. Definitions and Assumptions
- 2. Executive Summary
- 2.1. Market Snapshot
- 3. Market Dynamics
- 3.1. Market Drivers
- 3.2. Market Restrains
- 3.3. Market Trends
- 3.4. Market Opportunities
- 4. Market Factor Analysis
- 4.1. Porters Five Forces
- 4.1.1. Bargaining Power of Suppliers
- 4.1.2. Bargaining Power of Buyers
- 4.1.3. Threat of New Entrants
- 4.1.4. Threat of Substitutes
- 4.1.5. Competitive Rivalry
- 4.2. PESTEL analysis
- 4.3. BCG Analysis
- 4.3.1. Stars (High Growth, High Market Share)
- 4.3.2. Cash Cows (Low Growth, High Market Share)
- 4.3.3. Question Mark (High Growth, Low Market Share)
- 4.3.4. Dogs (Low Growth, Low Market Share)
- 4.4. Ansoff Matrix Analysis
- 4.5. Supply Chain Analysis
- 4.6. Regulatory Landscape
- 4.7. Current Market Potential and Opportunity Assessment (TAM–SAM–SOM Framework)
- 4.8. DMV Analyst Note
- 4.1. Porters Five Forces
- 5. Market Analysis, Insights and Forecast 2021-2033
- 5.1. Market Analysis, Insights and Forecast - by Production Analysis
- 5.2. Market Analysis, Insights and Forecast - by Consumption Analysis
- 5.3. Market Analysis, Insights and Forecast - by Import Market Analysis (Value & Volume)
- 5.4. Market Analysis, Insights and Forecast - by Export Market Analysis (Value & Volume)
- 5.5. Market Analysis, Insights and Forecast - by Price Trend Analysis
- 5.6. Market Analysis, Insights and Forecast - by Region
- 5.6.1. North America
- 5.6.2. South America
- 5.6.3. Europe
- 5.6.4. Middle East & Africa
- 5.6.5. Asia Pacific
- 6. Global US Farm Equipment Industry Analysis, Insights and Forecast, 2021-2033
- 6.1. Market Analysis, Insights and Forecast - by Production Analysis
- 6.2. Market Analysis, Insights and Forecast - by Consumption Analysis
- 6.3. Market Analysis, Insights and Forecast - by Import Market Analysis (Value & Volume)
- 6.4. Market Analysis, Insights and Forecast - by Export Market Analysis (Value & Volume)
- 6.5. Market Analysis, Insights and Forecast - by Price Trend Analysis
- 7. North America US Farm Equipment Industry Analysis, Insights and Forecast, 2020-2032
- 7.1. Market Analysis, Insights and Forecast - by Production Analysis
- 7.2. Market Analysis, Insights and Forecast - by Consumption Analysis
- 7.3. Market Analysis, Insights and Forecast - by Import Market Analysis (Value & Volume)
- 7.4. Market Analysis, Insights and Forecast - by Export Market Analysis (Value & Volume)
- 7.5. Market Analysis, Insights and Forecast - by Price Trend Analysis
- 8. South America US Farm Equipment Industry Analysis, Insights and Forecast, 2020-2032
- 8.1. Market Analysis, Insights and Forecast - by Production Analysis
- 8.2. Market Analysis, Insights and Forecast - by Consumption Analysis
- 8.3. Market Analysis, Insights and Forecast - by Import Market Analysis (Value & Volume)
- 8.4. Market Analysis, Insights and Forecast - by Export Market Analysis (Value & Volume)
- 8.5. Market Analysis, Insights and Forecast - by Price Trend Analysis
- 9. Europe US Farm Equipment Industry Analysis, Insights and Forecast, 2020-2032
- 9.1. Market Analysis, Insights and Forecast - by Production Analysis
- 9.2. Market Analysis, Insights and Forecast - by Consumption Analysis
- 9.3. Market Analysis, Insights and Forecast - by Import Market Analysis (Value & Volume)
- 9.4. Market Analysis, Insights and Forecast - by Export Market Analysis (Value & Volume)
- 9.5. Market Analysis, Insights and Forecast - by Price Trend Analysis
- 10. Middle East & Africa US Farm Equipment Industry Analysis, Insights and Forecast, 2020-2032
- 10.1. Market Analysis, Insights and Forecast - by Production Analysis
- 10.2. Market Analysis, Insights and Forecast - by Consumption Analysis
- 10.3. Market Analysis, Insights and Forecast - by Import Market Analysis (Value & Volume)
- 10.4. Market Analysis, Insights and Forecast - by Export Market Analysis (Value & Volume)
- 10.5. Market Analysis, Insights and Forecast - by Price Trend Analysis
- 11. Asia Pacific US Farm Equipment Industry Analysis, Insights and Forecast, 2020-2032
- 11.1. Market Analysis, Insights and Forecast - by Production Analysis
- 11.2. Market Analysis, Insights and Forecast - by Consumption Analysis
- 11.3. Market Analysis, Insights and Forecast - by Import Market Analysis (Value & Volume)
- 11.4. Market Analysis, Insights and Forecast - by Export Market Analysis (Value & Volume)
- 11.5. Market Analysis, Insights and Forecast - by Price Trend Analysis
- 12. Competitive Analysis
- 12.1. Company Profiles
- 12.1.1 Kverneland Grou
- 12.1.1.1. Company Overview
- 12.1.1.2. Products
- 12.1.1.3. Company Financials
- 12.1.1.4. SWOT Analysis
- 12.1.2 JOST Werke AG (Alo)
- 12.1.2.1. Company Overview
- 12.1.2.2. Products
- 12.1.2.3. Company Financials
- 12.1.2.4. SWOT Analysis
- 12.1.3 Kuhn Group Inc
- 12.1.3.1. Company Overview
- 12.1.3.2. Products
- 12.1.3.3. Company Financials
- 12.1.3.4. SWOT Analysis
- 12.1.4 Deere and Company
- 12.1.4.1. Company Overview
- 12.1.4.2. Products
- 12.1.4.3. Company Financials
- 12.1.4.4. SWOT Analysis
- 12.1.5 KUBOTA Corporation
- 12.1.5.1. Company Overview
- 12.1.5.2. Products
- 12.1.5.3. Company Financials
- 12.1.5.4. SWOT Analysis
- 12.1.6 CNH Industrial
- 12.1.6.1. Company Overview
- 12.1.6.2. Products
- 12.1.6.3. Company Financials
- 12.1.6.4. SWOT Analysis
- 12.1.7 Farmtrac Tractor Europe
- 12.1.7.1. Company Overview
- 12.1.7.2. Products
- 12.1.7.3. Company Financials
- 12.1.7.4. SWOT Analysis
- 12.1.8 AGCO Corporation
- 12.1.8.1. Company Overview
- 12.1.8.2. Products
- 12.1.8.3. Company Financials
- 12.1.8.4. SWOT Analysis
- 12.1.9 Deutz-Fahr
- 12.1.9.1. Company Overview
- 12.1.9.2. Products
- 12.1.9.3. Company Financials
- 12.1.9.4. SWOT Analysis
- 12.1.10 Mahindra Agriculture North America
- 12.1.10.1. Company Overview
- 12.1.10.2. Products
- 12.1.10.3. Company Financials
- 12.1.10.4. SWOT Analysis
- 12.1.11 Claas KGaA mbH
- 12.1.11.1. Company Overview
- 12.1.11.2. Products
- 12.1.11.3. Company Financials
- 12.1.11.4. SWOT Analysis
- 12.1.1 Kverneland Grou
- 12.2. Market Entropy
- 12.2.1 Company's Key Areas Served
- 12.2.2 Recent Developments
- 12.3. Company Market Share Analysis 2025
- 12.3.1 Top 5 Companies Market Share Analysis
- 12.3.2 Top 3 Companies Market Share Analysis
- 12.4. List of Potential Customers
- 13. Research Methodology
List of Figures
- Figure 1: Global US Farm Equipment Industry Revenue Breakdown (Million, %) by Region 2025 & 2033
- Figure 2: North America US Farm Equipment Industry Revenue (Million), by Production Analysis 2025 & 2033
- Figure 3: North America US Farm Equipment Industry Revenue Share (%), by Production Analysis 2025 & 2033
- Figure 4: North America US Farm Equipment Industry Revenue (Million), by Consumption Analysis 2025 & 2033
- Figure 5: North America US Farm Equipment Industry Revenue Share (%), by Consumption Analysis 2025 & 2033
- Figure 6: North America US Farm Equipment Industry Revenue (Million), by Import Market Analysis (Value & Volume) 2025 & 2033
- Figure 7: North America US Farm Equipment Industry Revenue Share (%), by Import Market Analysis (Value & Volume) 2025 & 2033
- Figure 8: North America US Farm Equipment Industry Revenue (Million), by Export Market Analysis (Value & Volume) 2025 & 2033
- Figure 9: North America US Farm Equipment Industry Revenue Share (%), by Export Market Analysis (Value & Volume) 2025 & 2033
- Figure 10: North America US Farm Equipment Industry Revenue (Million), by Price Trend Analysis 2025 & 2033
- Figure 11: North America US Farm Equipment Industry Revenue Share (%), by Price Trend Analysis 2025 & 2033
- Figure 12: North America US Farm Equipment Industry Revenue (Million), by Country 2025 & 2033
- Figure 13: North America US Farm Equipment Industry Revenue Share (%), by Country 2025 & 2033
- Figure 14: South America US Farm Equipment Industry Revenue (Million), by Production Analysis 2025 & 2033
- Figure 15: South America US Farm Equipment Industry Revenue Share (%), by Production Analysis 2025 & 2033
- Figure 16: South America US Farm Equipment Industry Revenue (Million), by Consumption Analysis 2025 & 2033
- Figure 17: South America US Farm Equipment Industry Revenue Share (%), by Consumption Analysis 2025 & 2033
- Figure 18: South America US Farm Equipment Industry Revenue (Million), by Import Market Analysis (Value & Volume) 2025 & 2033
- Figure 19: South America US Farm Equipment Industry Revenue Share (%), by Import Market Analysis (Value & Volume) 2025 & 2033
- Figure 20: South America US Farm Equipment Industry Revenue (Million), by Export Market Analysis (Value & Volume) 2025 & 2033
- Figure 21: South America US Farm Equipment Industry Revenue Share (%), by Export Market Analysis (Value & Volume) 2025 & 2033
- Figure 22: South America US Farm Equipment Industry Revenue (Million), by Price Trend Analysis 2025 & 2033
- Figure 23: South America US Farm Equipment Industry Revenue Share (%), by Price Trend Analysis 2025 & 2033
- Figure 24: South America US Farm Equipment Industry Revenue (Million), by Country 2025 & 2033
- Figure 25: South America US Farm Equipment Industry Revenue Share (%), by Country 2025 & 2033
- Figure 26: Europe US Farm Equipment Industry Revenue (Million), by Production Analysis 2025 & 2033
- Figure 27: Europe US Farm Equipment Industry Revenue Share (%), by Production Analysis 2025 & 2033
- Figure 28: Europe US Farm Equipment Industry Revenue (Million), by Consumption Analysis 2025 & 2033
- Figure 29: Europe US Farm Equipment Industry Revenue Share (%), by Consumption Analysis 2025 & 2033
- Figure 30: Europe US Farm Equipment Industry Revenue (Million), by Import Market Analysis (Value & Volume) 2025 & 2033
- Figure 31: Europe US Farm Equipment Industry Revenue Share (%), by Import Market Analysis (Value & Volume) 2025 & 2033
- Figure 32: Europe US Farm Equipment Industry Revenue (Million), by Export Market Analysis (Value & Volume) 2025 & 2033
- Figure 33: Europe US Farm Equipment Industry Revenue Share (%), by Export Market Analysis (Value & Volume) 2025 & 2033
- Figure 34: Europe US Farm Equipment Industry Revenue (Million), by Price Trend Analysis 2025 & 2033
- Figure 35: Europe US Farm Equipment Industry Revenue Share (%), by Price Trend Analysis 2025 & 2033
- Figure 36: Europe US Farm Equipment Industry Revenue (Million), by Country 2025 & 2033
- Figure 37: Europe US Farm Equipment Industry Revenue Share (%), by Country 2025 & 2033
- Figure 38: Middle East & Africa US Farm Equipment Industry Revenue (Million), by Production Analysis 2025 & 2033
- Figure 39: Middle East & Africa US Farm Equipment Industry Revenue Share (%), by Production Analysis 2025 & 2033
- Figure 40: Middle East & Africa US Farm Equipment Industry Revenue (Million), by Consumption Analysis 2025 & 2033
- Figure 41: Middle East & Africa US Farm Equipment Industry Revenue Share (%), by Consumption Analysis 2025 & 2033
- Figure 42: Middle East & Africa US Farm Equipment Industry Revenue (Million), by Import Market Analysis (Value & Volume) 2025 & 2033
- Figure 43: Middle East & Africa US Farm Equipment Industry Revenue Share (%), by Import Market Analysis (Value & Volume) 2025 & 2033
- Figure 44: Middle East & Africa US Farm Equipment Industry Revenue (Million), by Export Market Analysis (Value & Volume) 2025 & 2033
- Figure 45: Middle East & Africa US Farm Equipment Industry Revenue Share (%), by Export Market Analysis (Value & Volume) 2025 & 2033
- Figure 46: Middle East & Africa US Farm Equipment Industry Revenue (Million), by Price Trend Analysis 2025 & 2033
- Figure 47: Middle East & Africa US Farm Equipment Industry Revenue Share (%), by Price Trend Analysis 2025 & 2033
- Figure 48: Middle East & Africa US Farm Equipment Industry Revenue (Million), by Country 2025 & 2033
- Figure 49: Middle East & Africa US Farm Equipment Industry Revenue Share (%), by Country 2025 & 2033
- Figure 50: Asia Pacific US Farm Equipment Industry Revenue (Million), by Production Analysis 2025 & 2033
- Figure 51: Asia Pacific US Farm Equipment Industry Revenue Share (%), by Production Analysis 2025 & 2033
- Figure 52: Asia Pacific US Farm Equipment Industry Revenue (Million), by Consumption Analysis 2025 & 2033
- Figure 53: Asia Pacific US Farm Equipment Industry Revenue Share (%), by Consumption Analysis 2025 & 2033
- Figure 54: Asia Pacific US Farm Equipment Industry Revenue (Million), by Import Market Analysis (Value & Volume) 2025 & 2033
- Figure 55: Asia Pacific US Farm Equipment Industry Revenue Share (%), by Import Market Analysis (Value & Volume) 2025 & 2033
- Figure 56: Asia Pacific US Farm Equipment Industry Revenue (Million), by Export Market Analysis (Value & Volume) 2025 & 2033
- Figure 57: Asia Pacific US Farm Equipment Industry Revenue Share (%), by Export Market Analysis (Value & Volume) 2025 & 2033
- Figure 58: Asia Pacific US Farm Equipment Industry Revenue (Million), by Price Trend Analysis 2025 & 2033
- Figure 59: Asia Pacific US Farm Equipment Industry Revenue Share (%), by Price Trend Analysis 2025 & 2033
- Figure 60: Asia Pacific US Farm Equipment Industry Revenue (Million), by Country 2025 & 2033
- Figure 61: Asia Pacific US Farm Equipment Industry Revenue Share (%), by Country 2025 & 2033
List of Tables
- Table 1: Global US Farm Equipment Industry Revenue Million Forecast, by Production Analysis 2020 & 2033
- Table 2: Global US Farm Equipment Industry Revenue Million Forecast, by Consumption Analysis 2020 & 2033
- Table 3: Global US Farm Equipment Industry Revenue Million Forecast, by Import Market Analysis (Value & Volume) 2020 & 2033
- Table 4: Global US Farm Equipment Industry Revenue Million Forecast, by Export Market Analysis (Value & Volume) 2020 & 2033
- Table 5: Global US Farm Equipment Industry Revenue Million Forecast, by Price Trend Analysis 2020 & 2033
- Table 6: Global US Farm Equipment Industry Revenue Million Forecast, by Region 2020 & 2033
- Table 7: Global US Farm Equipment Industry Revenue Million Forecast, by Production Analysis 2020 & 2033
- Table 8: Global US Farm Equipment Industry Revenue Million Forecast, by Consumption Analysis 2020 & 2033
- Table 9: Global US Farm Equipment Industry Revenue Million Forecast, by Import Market Analysis (Value & Volume) 2020 & 2033
- Table 10: Global US Farm Equipment Industry Revenue Million Forecast, by Export Market Analysis (Value & Volume) 2020 & 2033
- Table 11: Global US Farm Equipment Industry Revenue Million Forecast, by Price Trend Analysis 2020 & 2033
- Table 12: Global US Farm Equipment Industry Revenue Million Forecast, by Country 2020 & 2033
- Table 13: United States US Farm Equipment Industry Revenue (Million) Forecast, by Application 2020 & 2033
- Table 14: Canada US Farm Equipment Industry Revenue (Million) Forecast, by Application 2020 & 2033
- Table 15: Mexico US Farm Equipment Industry Revenue (Million) Forecast, by Application 2020 & 2033
- Table 16: Global US Farm Equipment Industry Revenue Million Forecast, by Production Analysis 2020 & 2033
- Table 17: Global US Farm Equipment Industry Revenue Million Forecast, by Consumption Analysis 2020 & 2033
- Table 18: Global US Farm Equipment Industry Revenue Million Forecast, by Import Market Analysis (Value & Volume) 2020 & 2033
- Table 19: Global US Farm Equipment Industry Revenue Million Forecast, by Export Market Analysis (Value & Volume) 2020 & 2033
- Table 20: Global US Farm Equipment Industry Revenue Million Forecast, by Price Trend Analysis 2020 & 2033
- Table 21: Global US Farm Equipment Industry Revenue Million Forecast, by Country 2020 & 2033
- Table 22: Brazil US Farm Equipment Industry Revenue (Million) Forecast, by Application 2020 & 2033
- Table 23: Argentina US Farm Equipment Industry Revenue (Million) Forecast, by Application 2020 & 2033
- Table 24: Rest of South America US Farm Equipment Industry Revenue (Million) Forecast, by Application 2020 & 2033
- Table 25: Global US Farm Equipment Industry Revenue Million Forecast, by Production Analysis 2020 & 2033
- Table 26: Global US Farm Equipment Industry Revenue Million Forecast, by Consumption Analysis 2020 & 2033
- Table 27: Global US Farm Equipment Industry Revenue Million Forecast, by Import Market Analysis (Value & Volume) 2020 & 2033
- Table 28: Global US Farm Equipment Industry Revenue Million Forecast, by Export Market Analysis (Value & Volume) 2020 & 2033
- Table 29: Global US Farm Equipment Industry Revenue Million Forecast, by Price Trend Analysis 2020 & 2033
- Table 30: Global US Farm Equipment Industry Revenue Million Forecast, by Country 2020 & 2033
- Table 31: United Kingdom US Farm Equipment Industry Revenue (Million) Forecast, by Application 2020 & 2033
- Table 32: Germany US Farm Equipment Industry Revenue (Million) Forecast, by Application 2020 & 2033
- Table 33: France US Farm Equipment Industry Revenue (Million) Forecast, by Application 2020 & 2033
- Table 34: Italy US Farm Equipment Industry Revenue (Million) Forecast, by Application 2020 & 2033
- Table 35: Spain US Farm Equipment Industry Revenue (Million) Forecast, by Application 2020 & 2033
- Table 36: Russia US Farm Equipment Industry Revenue (Million) Forecast, by Application 2020 & 2033
- Table 37: Benelux US Farm Equipment Industry Revenue (Million) Forecast, by Application 2020 & 2033
- Table 38: Nordics US Farm Equipment Industry Revenue (Million) Forecast, by Application 2020 & 2033
- Table 39: Rest of Europe US Farm Equipment Industry Revenue (Million) Forecast, by Application 2020 & 2033
- Table 40: Global US Farm Equipment Industry Revenue Million Forecast, by Production Analysis 2020 & 2033
- Table 41: Global US Farm Equipment Industry Revenue Million Forecast, by Consumption Analysis 2020 & 2033
- Table 42: Global US Farm Equipment Industry Revenue Million Forecast, by Import Market Analysis (Value & Volume) 2020 & 2033
- Table 43: Global US Farm Equipment Industry Revenue Million Forecast, by Export Market Analysis (Value & Volume) 2020 & 2033
- Table 44: Global US Farm Equipment Industry Revenue Million Forecast, by Price Trend Analysis 2020 & 2033
- Table 45: Global US Farm Equipment Industry Revenue Million Forecast, by Country 2020 & 2033
- Table 46: Turkey US Farm Equipment Industry Revenue (Million) Forecast, by Application 2020 & 2033
- Table 47: Israel US Farm Equipment Industry Revenue (Million) Forecast, by Application 2020 & 2033
- Table 48: GCC US Farm Equipment Industry Revenue (Million) Forecast, by Application 2020 & 2033
- Table 49: North Africa US Farm Equipment Industry Revenue (Million) Forecast, by Application 2020 & 2033
- Table 50: South Africa US Farm Equipment Industry Revenue (Million) Forecast, by Application 2020 & 2033
- Table 51: Rest of Middle East & Africa US Farm Equipment Industry Revenue (Million) Forecast, by Application 2020 & 2033
- Table 52: Global US Farm Equipment Industry Revenue Million Forecast, by Production Analysis 2020 & 2033
- Table 53: Global US Farm Equipment Industry Revenue Million Forecast, by Consumption Analysis 2020 & 2033
- Table 54: Global US Farm Equipment Industry Revenue Million Forecast, by Import Market Analysis (Value & Volume) 2020 & 2033
- Table 55: Global US Farm Equipment Industry Revenue Million Forecast, by Export Market Analysis (Value & Volume) 2020 & 2033
- Table 56: Global US Farm Equipment Industry Revenue Million Forecast, by Price Trend Analysis 2020 & 2033
- Table 57: Global US Farm Equipment Industry Revenue Million Forecast, by Country 2020 & 2033
- Table 58: China US Farm Equipment Industry Revenue (Million) Forecast, by Application 2020 & 2033
- Table 59: India US Farm Equipment Industry Revenue (Million) Forecast, by Application 2020 & 2033
- Table 60: Japan US Farm Equipment Industry Revenue (Million) Forecast, by Application 2020 & 2033
- Table 61: South Korea US Farm Equipment Industry Revenue (Million) Forecast, by Application 2020 & 2033
- Table 62: ASEAN US Farm Equipment Industry Revenue (Million) Forecast, by Application 2020 & 2033
- Table 63: Oceania US Farm Equipment Industry Revenue (Million) Forecast, by Application 2020 & 2033
- Table 64: Rest of Asia Pacific US Farm Equipment Industry Revenue (Million) Forecast, by Application 2020 & 2033
Frequently Asked Questions
1. What is the projected Compound Annual Growth Rate (CAGR) of the US Farm Equipment Industry?
The projected CAGR is approximately 6.30%.
2. Which companies are prominent players in the US Farm Equipment Industry?
Key companies in the market include Kverneland Grou, JOST Werke AG (Alo), Kuhn Group Inc, Deere and Company, KUBOTA Corporation, CNH Industrial, Farmtrac Tractor Europe, AGCO Corporation, Deutz-Fahr, Mahindra Agriculture North America, Claas KGaA mbH.
3. What are the main segments of the US Farm Equipment Industry?
The market segments include Production Analysis, Consumption Analysis, Import Market Analysis (Value & Volume), Export Market Analysis (Value & Volume), Price Trend Analysis.
4. Can you provide details about the market size?
The market size is estimated to be USD 39.56 Million as of 2022.
5. What are some drivers contributing to market growth?
Low Availability of Skilled Labor; Technological Advancements.
6. What are the notable trends driving market growth?
Increasing Average Farm Size.
7. Are there any restraints impacting market growth?
Increasing Farm Expenditure; Security Concerns in Modern Farming Machinery.
8. Can you provide examples of recent developments in the market?
December 2022: CNH Industrial added new Automation and Autonomy Solutions to the Ag Tech portfolio in Phoenix, Arizona, and the USA. These New Driverless Tillage and Driver Assist Harvest solutions from Raven, and Baler Automation from Case IH and New Holland, can deliver automation and autonomous equipment enhancements and help solve farmers' most significant challenges to increasing productivity.
9. What pricing options are available for accessing the report?
Pricing options include single-user, multi-user, and enterprise licenses priced at USD 3800, USD 4500, and USD 5800 respectively.
10. Is the market size provided in terms of value or volume?
The market size is provided in terms of value, measured in Million.
11. Are there any specific market keywords associated with the report?
Yes, the market keyword associated with the report is "US Farm Equipment Industry," which aids in identifying and referencing the specific market segment covered.
12. How do I determine which pricing option suits my needs best?
The pricing options vary based on user requirements and access needs. Individual users may opt for single-user licenses, while businesses requiring broader access may choose multi-user or enterprise licenses for cost-effective access to the report.
13. Are there any additional resources or data provided in the US Farm Equipment Industry report?
While the report offers comprehensive insights, it's advisable to review the specific contents or supplementary materials provided to ascertain if additional resources or data are available.
14. How can I stay updated on further developments or reports in the US Farm Equipment Industry?
To stay informed about further developments, trends, and reports in the US Farm Equipment Industry, consider subscribing to industry newsletters, following relevant companies and organizations, or regularly checking reputable industry news sources and publications.
Methodology
Step 1 - Identification of Relevant Samples Size from Population Database


Step 2 - Approaches for Defining Global Market Size (Value, Volume* & Price*)

Note*: In applicable scenarios
Step 3 - Data Sources
Primary Research
- Web Analytics
- Survey Reports
- Research Institute
- Latest Research Reports
- Opinion Leaders
Secondary Research
- Annual Reports
- White Paper
- Latest Press Release
- Industry Association
- Paid Database
- Investor Presentations

Step 4 - Data Triangulation
Involves using different sources of information in order to increase the validity of a study
These sources are likely to be stakeholders in a program - participants, other researchers, program staff, other community members, and so on.
Then we put all data in single framework & apply various statistical tools to find out the dynamic on the market.
During the analysis stage, feedback from the stakeholder groups would be compared to determine areas of agreement as well as areas of divergence