

Key Insights
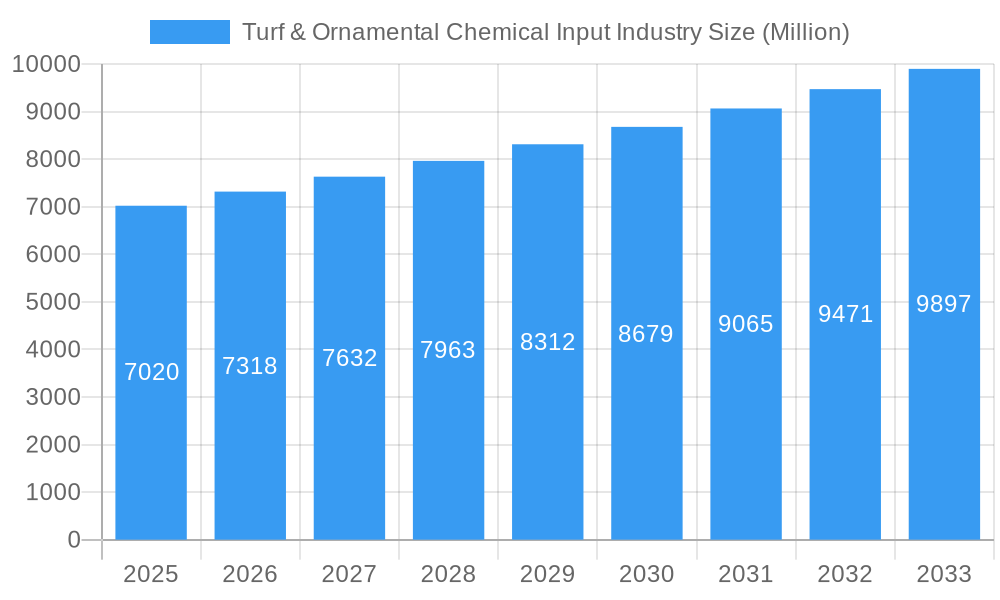
The global turf and ornamental chemical input market, valued at $7.02 billion in 2025, is projected to experience robust growth, driven by increasing urbanization, landscaping demands, and the rising popularity of aesthetically pleasing green spaces in both residential and commercial settings. A Compound Annual Growth Rate (CAGR) of 4.34% from 2025 to 2033 indicates a significant market expansion. Key drivers include the growing demand for high-quality turf and ornamental plants, necessitating the use of fertilizers, pesticides, and plant growth regulators to ensure optimal health and appearance. Furthermore, advancements in chemical formulations leading to more effective and environmentally friendly products are contributing to market growth. While regulatory pressures regarding the use of certain chemicals might pose a restraint, the industry is actively adapting by developing sustainable and bio-based alternatives. The market is segmented by various types of ornamental grasses (feather reed grass, fountain grass, etc.), synthetic chemical inputs (pesticides, fertilizers, etc.), and turf grasses (Bermuda grass, Zoysia grass, etc.), each segment contributing differently to the overall market value. The regional distribution of the market is diverse, with North America and Europe holding significant shares, while Asia-Pacific is anticipated to experience considerable growth fueled by rapid economic development and increasing disposable incomes. Major players such as FMC Corporation, Bayer Crop Sciences, and Syngenta are actively engaged in research and development, expanding their product portfolios to cater to evolving market demands.
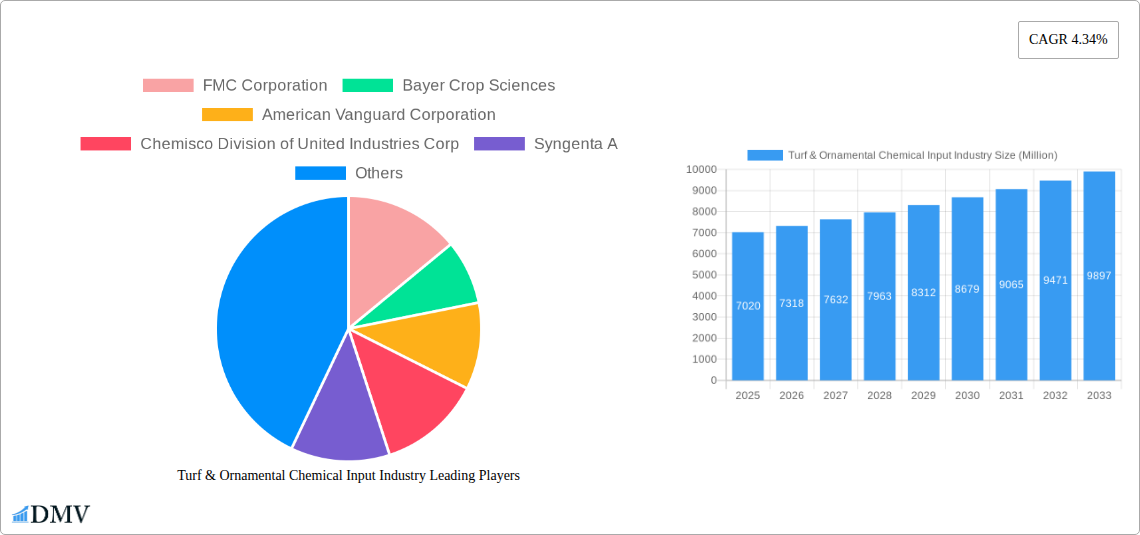
Turf & Ornamental Chemical Input Industry Market Size (In Billion)
The competitive landscape is marked by both established multinational corporations and regional players. The market's success hinges on innovation, sustainability, and regulatory compliance. Companies are focusing on developing eco-friendly products and enhancing their supply chains to meet the growing demand for sustainable landscaping solutions. The market's future growth trajectory is optimistic, given the continued demand for aesthetically pleasing outdoor spaces and ongoing technological advancements in agricultural chemicals. However, maintaining a balance between efficient crop management and environmental protection will be crucial for long-term market sustainability. The continued focus on R&D for environmentally friendly solutions will be key to mitigating potential restraints and unlocking further market potential.
Turf & Ornamental Chemical Input Industry Company Market Share
This comprehensive report provides a detailed analysis of the Turf & Ornamental Chemical Input Industry, offering invaluable insights for stakeholders seeking to navigate this dynamic market. With a study period spanning 2019-2033, a base year of 2025, and a forecast period of 2025-2033, this report presents a complete picture of past performance, current trends, and future projections. The global market is estimated at XX Million in 2025 and is projected to reach XX Million by 2033.
Turf & Ornamental Chemical Input Industry Market Composition & Trends
This section delves into the competitive landscape of the Turf & Ornamental Chemical Input market, examining market concentration, innovation drivers, regulatory changes, and the influence of substitute products. We analyze end-user profiles across various segments – from residential lawns to large-scale commercial landscaping – and explore the impact of mergers and acquisitions (M&A) activities. The report incorporates a detailed analysis of market share distribution among key players, including FMC Corporation, Bayer Crop Sciences, Syngenta, and others. We also assess the financial implications of significant M&A deals, with values exceeding XX Million in some cases.
- Market Concentration: Analysis of market share held by top 5 players, revealing a [Describe as concentrated/fragmented etc.] market.
- Innovation Catalysts: Examination of R&D investments, technological advancements (e.g., biopesticides), and their influence on market dynamics.
- Regulatory Landscape: Assessment of evolving regulations concerning pesticide use, their impact on market growth, and compliance strategies for companies.
- Substitute Products: Evaluation of the impact of organic and natural alternatives on the synthetic chemical input market.
- M&A Activity: Detailed analysis of significant M&A deals, including deal values and their strategic implications for market consolidation.
Turf & Ornamental Chemical Input Industry Industry Evolution
This section provides a comprehensive overview of the Turf & Ornamental Chemical Input Industry's evolution. We trace the market's growth trajectory from 2019 to 2024, highlighting key milestones, technological advancements, and shifting consumer preferences towards sustainable and eco-friendly solutions. Specific data points, such as compound annual growth rates (CAGRs) and adoption rates of new technologies, are included. The analysis also considers the influence of factors like increasing urbanization, rising disposable incomes, and changing landscaping aesthetics. The industry has seen significant shifts in consumer demand towards environmentally friendly products, alongside innovation in synthetic chemical input technology.
Leading Regions, Countries, or Segments in Turf & Ornamental Chemical Input Industry
This section identifies the dominant regions, countries, and segments within the Turf & Ornamental Chemical Input Industry. We provide a detailed breakdown by type of turf grass (Bermuda Grass, Zoysia Grass, Blue Kentucky Grass, Rye Grass, Tall Fescue, Others), type of ornamental grass (Feather Reed Grass, Fountain Grass, Purple Millet, Ravenna Grass, Fibre Optic Grass, Others), and type of synthetic chemical inputs (pesticides, fertilizers, plant growth regulators, others).
- Key Drivers: Analysis of factors contributing to the dominance of specific regions, countries, and segments, including investment trends, government support, and favorable climate conditions.
- Dominance Factors: In-depth examination of factors responsible for market leadership within the key segments, including technological advancements, consumer preferences, and regulatory environments. For example, the strong demand for [Mention dominant segment and rationale].
Turf & Ornamental Chemical Input Industry Product Innovations
This section highlights recent product innovations in the Turf & Ornamental Chemical Input Industry, including the introduction of new pesticides, fertilizers, and plant growth regulators. The analysis covers applications, performance metrics, and unique selling propositions (USPs) of these products. The focus is on advancements that improve efficacy, reduce environmental impact, and enhance user-friendliness. Examples include the development of targeted pesticides with reduced environmental impact and the introduction of slow-release fertilizers for improved nutrient management.
Propelling Factors for Turf & Ornamental Chemical Input Industry Growth
Several factors are driving growth in the Turf & Ornamental Chemical Input Industry. Technological advancements, such as the development of more targeted and efficient chemicals, are reducing environmental impact and enhancing product performance. Economic growth, particularly in developing economies, is increasing demand for landscaping services. Favorable regulatory environments in some regions are also promoting market expansion. Specifically, the increasing adoption of smart agriculture technologies and government initiatives promoting sustainable landscaping practices are major catalysts.
Obstacles in the Turf & Ornamental Chemical Input Industry Market
Despite promising growth prospects, the Turf & Ornamental Chemical Input Industry faces several challenges. Stringent environmental regulations, increasing scrutiny of chemical usage, and potential supply chain disruptions due to geopolitical factors pose significant obstacles. Intense competition, with established players and new entrants vying for market share, also exerts pressure on profitability. For example, the impact of trade wars on import/export of key raw materials has negatively affected profitability.
Future Opportunities in Turf & Ornamental Chemical Input Industry
The Turf & Ornamental Chemical Input Industry presents significant opportunities for growth. Emerging markets in developing countries, coupled with the rising adoption of sustainable and eco-friendly products, offer immense potential. Technological advancements, such as the development of precision agriculture technologies, are enabling more targeted and efficient chemical application. This also presents opportunities for new product development.
Major Players in the Turf & Ornamental Chemical Input Industry Ecosystem
- FMC Corporation
- Bayer Crop Sciences
- American Vanguard Corporation
- Chemisco Division of United Industries Corp
- Syngenta A
- Precision Laboratories
- DowDuPont (Note: Dow and DuPont have since separated; please specify which entity is relevant)
- Monsanto Company (Note: Monsanto is now owned by Bayer; consider revising to reflect this)
- Gowan International
- Chemtura Agro Solutions
- Adama Agricultural Solutions
- Koch Agronomic Services LLC
- Nufarm Ltd
- BASF SE
Key Developments in Turf & Ornamental Chemical Input Industry Industry
- March 2022: BASF introduced Pillar SC Intrinsic brand fungicide, providing broad-spectrum control of 26 turf diseases. This launch significantly enhanced BASF's market position in the turf care segment.
- January 2022: Syngenta acquired "Nematrident" and "Unispore" bioinsecticides, strengthening its portfolio of sustainable pest control solutions. This acquisition reflects the growing demand for eco-friendly pest management options.
Strategic Turf & Ornamental Chemical Input Industry Market Forecast
The Turf & Ornamental Chemical Input Industry is poised for continued growth, driven by factors such as increasing urbanization, rising disposable incomes, and technological advancements. The market is expected to witness significant expansion in the forecast period (2025-2033), fueled by the rising demand for sustainable and eco-friendly products. Opportunities lie in the development of innovative, targeted solutions that address specific pest and disease challenges while minimizing environmental impact.
Turf & Ornamental Chemical Input Industry Segmentation
-
1. Type of Turf Grass
- 1.1. Bermuda Grass
- 1.2. Zoysia Grass
- 1.3. Blue Kentucky Grass
- 1.4. Rye Grass
- 1.5. Tall Fescue
- 1.6. Others
-
2. Type of Ornamental Grass
- 2.1. Feather Reed Grass
- 2.2. Fountain Grass
- 2.3. Purple Millet
- 2.4. Ravenna Grass
- 2.5. Fibre Optic Grass
- 2.6. Others
-
3. Synthetic Chemical Inputs
- 3.1. Pesticides
- 3.2. Fertilizers
- 3.3. Plant Growth Regulators
- 3.4. Others
-
4. Type of Turf Grass
- 4.1. Bermuda Grass
- 4.2. Zoysia Grass
- 4.3. Blue Kentucky Grass
- 4.4. Rye Grass
- 4.5. Tall Fescue
- 4.6. Others
-
5. Type of Ornamental Grass
- 5.1. Feather Reed Grass
- 5.2. Fountain Grass
- 5.3. Purple Millet
- 5.4. Ravenna Grass
- 5.5. Fibre Optic Grass
- 5.6. Others
-
6. Synthetic Chemical Inputs
- 6.1. Pesticides
- 6.2. Fertilizers
- 6.3. Plant Growth Regulators
- 6.4. Others
Turf & Ornamental Chemical Input Industry Segmentation By Geography
-
1. North America
- 1.1. United States
- 1.2. Canada
- 1.3. Mexico
- 1.4. Rest of North America
-
2. Europe
- 2.1. Spain
- 2.2. United Kingdom
- 2.3. France
- 2.4. Germany
- 2.5. Denmark
- 2.6. Italy
- 2.7. Rest of Europe
-
3. Asia Pacific
- 3.1. China
- 3.2. India
- 3.3. Japan
- 3.4. Thailand
- 3.5. Australia
- 3.6. Rest of Asia Pacific
-
4. South America
- 4.1. Brazil
- 4.2. Argentina
- 4.3. Rest of South America
-
5. Africa
- 5.1. South Africa
- 5.2. Rest of Africa
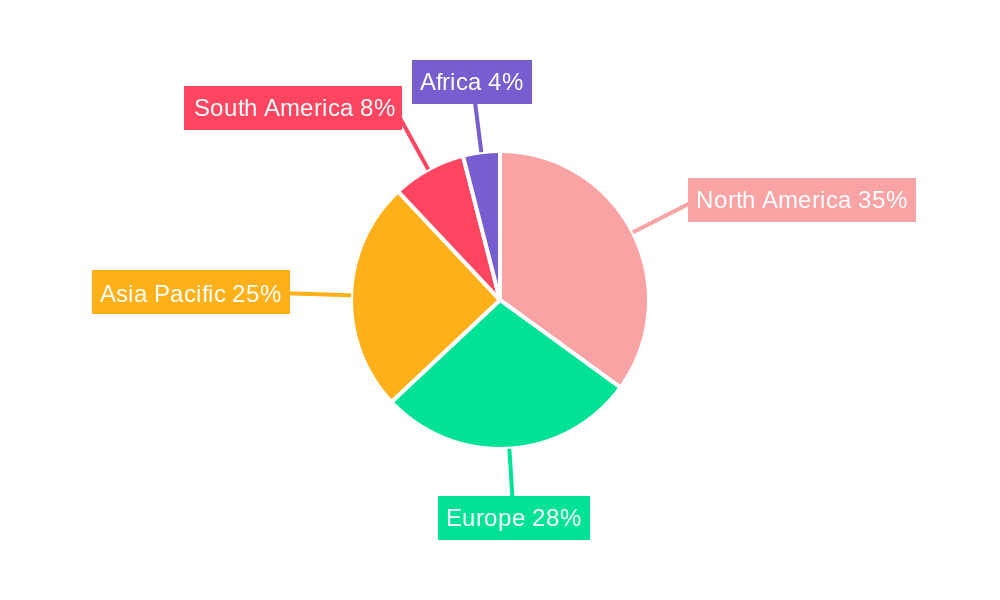
Turf & Ornamental Chemical Input Industry Regional Market Share
Geographic Coverage of Turf & Ornamental Chemical Input Industry
Turf & Ornamental Chemical Input Industry REPORT HIGHLIGHTS
| Aspects | Details |
|---|---|
| Study Period | 2020-2034 |
| Base Year | 2025 |
| Estimated Year | 2026 |
| Forecast Period | 2026-2034 |
| Historical Period | 2020-2025 |
| Growth Rate | CAGR of 4.34% from 2020-2034 |
| Segmentation |
|
Table of Contents
- 1. Introduction
- 1.1. Research Scope
- 1.2. Market Segmentation
- 1.3. Research Objective
- 1.4. Definitions and Assumptions
- 2. Executive Summary
- 2.1. Market Snapshot
- 3. Market Dynamics
- 3.1. Market Drivers
- 3.2. Market Restrains
- 3.3. Market Trends
- 3.4. Market Opportunities
- 4. Market Factor Analysis
- 4.1. Porters Five Forces
- 4.1.1. Bargaining Power of Suppliers
- 4.1.2. Bargaining Power of Buyers
- 4.1.3. Threat of New Entrants
- 4.1.4. Threat of Substitutes
- 4.1.5. Competitive Rivalry
- 4.2. PESTEL analysis
- 4.3. BCG Analysis
- 4.3.1. Stars (High Growth, High Market Share)
- 4.3.2. Cash Cows (Low Growth, High Market Share)
- 4.3.3. Question Mark (High Growth, Low Market Share)
- 4.3.4. Dogs (Low Growth, Low Market Share)
- 4.4. Ansoff Matrix Analysis
- 4.5. Supply Chain Analysis
- 4.6. Regulatory Landscape
- 4.7. Current Market Potential and Opportunity Assessment (TAM–SAM–SOM Framework)
- 4.8. DMV Analyst Note
- 4.1. Porters Five Forces
- 5. Market Analysis, Insights and Forecast 2021-2033
- 5.1. Market Analysis, Insights and Forecast - by Type of Turf Grass
- 5.1.1. Bermuda Grass
- 5.1.2. Zoysia Grass
- 5.1.3. Blue Kentucky Grass
- 5.1.4. Rye Grass
- 5.1.5. Tall Fescue
- 5.1.6. Others
- 5.2. Market Analysis, Insights and Forecast - by Type of Ornamental Grass
- 5.2.1. Feather Reed Grass
- 5.2.2. Fountain Grass
- 5.2.3. Purple Millet
- 5.2.4. Ravenna Grass
- 5.2.5. Fibre Optic Grass
- 5.2.6. Others
- 5.3. Market Analysis, Insights and Forecast - by Synthetic Chemical Inputs
- 5.3.1. Pesticides
- 5.3.2. Fertilizers
- 5.3.3. Plant Growth Regulators
- 5.3.4. Others
- 5.4. Market Analysis, Insights and Forecast - by Type of Turf Grass
- 5.4.1. Bermuda Grass
- 5.4.2. Zoysia Grass
- 5.4.3. Blue Kentucky Grass
- 5.4.4. Rye Grass
- 5.4.5. Tall Fescue
- 5.4.6. Others
- 5.5. Market Analysis, Insights and Forecast - by Type of Ornamental Grass
- 5.5.1. Feather Reed Grass
- 5.5.2. Fountain Grass
- 5.5.3. Purple Millet
- 5.5.4. Ravenna Grass
- 5.5.5. Fibre Optic Grass
- 5.5.6. Others
- 5.6. Market Analysis, Insights and Forecast - by Synthetic Chemical Inputs
- 5.6.1. Pesticides
- 5.6.2. Fertilizers
- 5.6.3. Plant Growth Regulators
- 5.6.4. Others
- 5.7. Market Analysis, Insights and Forecast - by Region
- 5.7.1. North America
- 5.7.2. Europe
- 5.7.3. Asia Pacific
- 5.7.4. South America
- 5.7.5. Africa
- 5.1. Market Analysis, Insights and Forecast - by Type of Turf Grass
- 6. Global Turf & Ornamental Chemical Input Industry Analysis, Insights and Forecast, 2021-2033
- 6.1. Market Analysis, Insights and Forecast - by Type of Turf Grass
- 6.1.1. Bermuda Grass
- 6.1.2. Zoysia Grass
- 6.1.3. Blue Kentucky Grass
- 6.1.4. Rye Grass
- 6.1.5. Tall Fescue
- 6.1.6. Others
- 6.2. Market Analysis, Insights and Forecast - by Type of Ornamental Grass
- 6.2.1. Feather Reed Grass
- 6.2.2. Fountain Grass
- 6.2.3. Purple Millet
- 6.2.4. Ravenna Grass
- 6.2.5. Fibre Optic Grass
- 6.2.6. Others
- 6.3. Market Analysis, Insights and Forecast - by Synthetic Chemical Inputs
- 6.3.1. Pesticides
- 6.3.2. Fertilizers
- 6.3.3. Plant Growth Regulators
- 6.3.4. Others
- 6.4. Market Analysis, Insights and Forecast - by Type of Turf Grass
- 6.4.1. Bermuda Grass
- 6.4.2. Zoysia Grass
- 6.4.3. Blue Kentucky Grass
- 6.4.4. Rye Grass
- 6.4.5. Tall Fescue
- 6.4.6. Others
- 6.5. Market Analysis, Insights and Forecast - by Type of Ornamental Grass
- 6.5.1. Feather Reed Grass
- 6.5.2. Fountain Grass
- 6.5.3. Purple Millet
- 6.5.4. Ravenna Grass
- 6.5.5. Fibre Optic Grass
- 6.5.6. Others
- 6.6. Market Analysis, Insights and Forecast - by Synthetic Chemical Inputs
- 6.6.1. Pesticides
- 6.6.2. Fertilizers
- 6.6.3. Plant Growth Regulators
- 6.6.4. Others
- 6.1. Market Analysis, Insights and Forecast - by Type of Turf Grass
- 7. North America Turf & Ornamental Chemical Input Industry Analysis, Insights and Forecast, 2020-2032
- 7.1. Market Analysis, Insights and Forecast - by Type of Turf Grass
- 7.1.1. Bermuda Grass
- 7.1.2. Zoysia Grass
- 7.1.3. Blue Kentucky Grass
- 7.1.4. Rye Grass
- 7.1.5. Tall Fescue
- 7.1.6. Others
- 7.2. Market Analysis, Insights and Forecast - by Type of Ornamental Grass
- 7.2.1. Feather Reed Grass
- 7.2.2. Fountain Grass
- 7.2.3. Purple Millet
- 7.2.4. Ravenna Grass
- 7.2.5. Fibre Optic Grass
- 7.2.6. Others
- 7.3. Market Analysis, Insights and Forecast - by Synthetic Chemical Inputs
- 7.3.1. Pesticides
- 7.3.2. Fertilizers
- 7.3.3. Plant Growth Regulators
- 7.3.4. Others
- 7.4. Market Analysis, Insights and Forecast - by Type of Turf Grass
- 7.4.1. Bermuda Grass
- 7.4.2. Zoysia Grass
- 7.4.3. Blue Kentucky Grass
- 7.4.4. Rye Grass
- 7.4.5. Tall Fescue
- 7.4.6. Others
- 7.5. Market Analysis, Insights and Forecast - by Type of Ornamental Grass
- 7.5.1. Feather Reed Grass
- 7.5.2. Fountain Grass
- 7.5.3. Purple Millet
- 7.5.4. Ravenna Grass
- 7.5.5. Fibre Optic Grass
- 7.5.6. Others
- 7.6. Market Analysis, Insights and Forecast - by Synthetic Chemical Inputs
- 7.6.1. Pesticides
- 7.6.2. Fertilizers
- 7.6.3. Plant Growth Regulators
- 7.6.4. Others
- 7.1. Market Analysis, Insights and Forecast - by Type of Turf Grass
- 8. Europe Turf & Ornamental Chemical Input Industry Analysis, Insights and Forecast, 2020-2032
- 8.1. Market Analysis, Insights and Forecast - by Type of Turf Grass
- 8.1.1. Bermuda Grass
- 8.1.2. Zoysia Grass
- 8.1.3. Blue Kentucky Grass
- 8.1.4. Rye Grass
- 8.1.5. Tall Fescue
- 8.1.6. Others
- 8.2. Market Analysis, Insights and Forecast - by Type of Ornamental Grass
- 8.2.1. Feather Reed Grass
- 8.2.2. Fountain Grass
- 8.2.3. Purple Millet
- 8.2.4. Ravenna Grass
- 8.2.5. Fibre Optic Grass
- 8.2.6. Others
- 8.3. Market Analysis, Insights and Forecast - by Synthetic Chemical Inputs
- 8.3.1. Pesticides
- 8.3.2. Fertilizers
- 8.3.3. Plant Growth Regulators
- 8.3.4. Others
- 8.4. Market Analysis, Insights and Forecast - by Type of Turf Grass
- 8.4.1. Bermuda Grass
- 8.4.2. Zoysia Grass
- 8.4.3. Blue Kentucky Grass
- 8.4.4. Rye Grass
- 8.4.5. Tall Fescue
- 8.4.6. Others
- 8.5. Market Analysis, Insights and Forecast - by Type of Ornamental Grass
- 8.5.1. Feather Reed Grass
- 8.5.2. Fountain Grass
- 8.5.3. Purple Millet
- 8.5.4. Ravenna Grass
- 8.5.5. Fibre Optic Grass
- 8.5.6. Others
- 8.6. Market Analysis, Insights and Forecast - by Synthetic Chemical Inputs
- 8.6.1. Pesticides
- 8.6.2. Fertilizers
- 8.6.3. Plant Growth Regulators
- 8.6.4. Others
- 8.1. Market Analysis, Insights and Forecast - by Type of Turf Grass
- 9. Asia Pacific Turf & Ornamental Chemical Input Industry Analysis, Insights and Forecast, 2020-2032
- 9.1. Market Analysis, Insights and Forecast - by Type of Turf Grass
- 9.1.1. Bermuda Grass
- 9.1.2. Zoysia Grass
- 9.1.3. Blue Kentucky Grass
- 9.1.4. Rye Grass
- 9.1.5. Tall Fescue
- 9.1.6. Others
- 9.2. Market Analysis, Insights and Forecast - by Type of Ornamental Grass
- 9.2.1. Feather Reed Grass
- 9.2.2. Fountain Grass
- 9.2.3. Purple Millet
- 9.2.4. Ravenna Grass
- 9.2.5. Fibre Optic Grass
- 9.2.6. Others
- 9.3. Market Analysis, Insights and Forecast - by Synthetic Chemical Inputs
- 9.3.1. Pesticides
- 9.3.2. Fertilizers
- 9.3.3. Plant Growth Regulators
- 9.3.4. Others
- 9.4. Market Analysis, Insights and Forecast - by Type of Turf Grass
- 9.4.1. Bermuda Grass
- 9.4.2. Zoysia Grass
- 9.4.3. Blue Kentucky Grass
- 9.4.4. Rye Grass
- 9.4.5. Tall Fescue
- 9.4.6. Others
- 9.5. Market Analysis, Insights and Forecast - by Type of Ornamental Grass
- 9.5.1. Feather Reed Grass
- 9.5.2. Fountain Grass
- 9.5.3. Purple Millet
- 9.5.4. Ravenna Grass
- 9.5.5. Fibre Optic Grass
- 9.5.6. Others
- 9.6. Market Analysis, Insights and Forecast - by Synthetic Chemical Inputs
- 9.6.1. Pesticides
- 9.6.2. Fertilizers
- 9.6.3. Plant Growth Regulators
- 9.6.4. Others
- 9.1. Market Analysis, Insights and Forecast - by Type of Turf Grass
- 10. South America Turf & Ornamental Chemical Input Industry Analysis, Insights and Forecast, 2020-2032
- 10.1. Market Analysis, Insights and Forecast - by Type of Turf Grass
- 10.1.1. Bermuda Grass
- 10.1.2. Zoysia Grass
- 10.1.3. Blue Kentucky Grass
- 10.1.4. Rye Grass
- 10.1.5. Tall Fescue
- 10.1.6. Others
- 10.2. Market Analysis, Insights and Forecast - by Type of Ornamental Grass
- 10.2.1. Feather Reed Grass
- 10.2.2. Fountain Grass
- 10.2.3. Purple Millet
- 10.2.4. Ravenna Grass
- 10.2.5. Fibre Optic Grass
- 10.2.6. Others
- 10.3. Market Analysis, Insights and Forecast - by Synthetic Chemical Inputs
- 10.3.1. Pesticides
- 10.3.2. Fertilizers
- 10.3.3. Plant Growth Regulators
- 10.3.4. Others
- 10.4. Market Analysis, Insights and Forecast - by Type of Turf Grass
- 10.4.1. Bermuda Grass
- 10.4.2. Zoysia Grass
- 10.4.3. Blue Kentucky Grass
- 10.4.4. Rye Grass
- 10.4.5. Tall Fescue
- 10.4.6. Others
- 10.5. Market Analysis, Insights and Forecast - by Type of Ornamental Grass
- 10.5.1. Feather Reed Grass
- 10.5.2. Fountain Grass
- 10.5.3. Purple Millet
- 10.5.4. Ravenna Grass
- 10.5.5. Fibre Optic Grass
- 10.5.6. Others
- 10.6. Market Analysis, Insights and Forecast - by Synthetic Chemical Inputs
- 10.6.1. Pesticides
- 10.6.2. Fertilizers
- 10.6.3. Plant Growth Regulators
- 10.6.4. Others
- 10.1. Market Analysis, Insights and Forecast - by Type of Turf Grass
- 11. Africa Turf & Ornamental Chemical Input Industry Analysis, Insights and Forecast, 2020-2032
- 11.1. Market Analysis, Insights and Forecast - by Type of Turf Grass
- 11.1.1. Bermuda Grass
- 11.1.2. Zoysia Grass
- 11.1.3. Blue Kentucky Grass
- 11.1.4. Rye Grass
- 11.1.5. Tall Fescue
- 11.1.6. Others
- 11.2. Market Analysis, Insights and Forecast - by Type of Ornamental Grass
- 11.2.1. Feather Reed Grass
- 11.2.2. Fountain Grass
- 11.2.3. Purple Millet
- 11.2.4. Ravenna Grass
- 11.2.5. Fibre Optic Grass
- 11.2.6. Others
- 11.3. Market Analysis, Insights and Forecast - by Synthetic Chemical Inputs
- 11.3.1. Pesticides
- 11.3.2. Fertilizers
- 11.3.3. Plant Growth Regulators
- 11.3.4. Others
- 11.4. Market Analysis, Insights and Forecast - by Type of Turf Grass
- 11.4.1. Bermuda Grass
- 11.4.2. Zoysia Grass
- 11.4.3. Blue Kentucky Grass
- 11.4.4. Rye Grass
- 11.4.5. Tall Fescue
- 11.4.6. Others
- 11.5. Market Analysis, Insights and Forecast - by Type of Ornamental Grass
- 11.5.1. Feather Reed Grass
- 11.5.2. Fountain Grass
- 11.5.3. Purple Millet
- 11.5.4. Ravenna Grass
- 11.5.5. Fibre Optic Grass
- 11.5.6. Others
- 11.6. Market Analysis, Insights and Forecast - by Synthetic Chemical Inputs
- 11.6.1. Pesticides
- 11.6.2. Fertilizers
- 11.6.3. Plant Growth Regulators
- 11.6.4. Others
- 11.1. Market Analysis, Insights and Forecast - by Type of Turf Grass
- 12. Competitive Analysis
- 12.1. Company Profiles
- 12.1.1 FMC Corporation
- 12.1.1.1. Company Overview
- 12.1.1.2. Products
- 12.1.1.3. Company Financials
- 12.1.1.4. SWOT Analysis
- 12.1.2 Bayer Crop Sciences
- 12.1.2.1. Company Overview
- 12.1.2.2. Products
- 12.1.2.3. Company Financials
- 12.1.2.4. SWOT Analysis
- 12.1.3 American Vanguard Corporation
- 12.1.3.1. Company Overview
- 12.1.3.2. Products
- 12.1.3.3. Company Financials
- 12.1.3.4. SWOT Analysis
- 12.1.4 Chemisco Division of United Industries Corp
- 12.1.4.1. Company Overview
- 12.1.4.2. Products
- 12.1.4.3. Company Financials
- 12.1.4.4. SWOT Analysis
- 12.1.5 Syngenta A
- 12.1.5.1. Company Overview
- 12.1.5.2. Products
- 12.1.5.3. Company Financials
- 12.1.5.4. SWOT Analysis
- 12.1.6 Precision Laboratories
- 12.1.6.1. Company Overview
- 12.1.6.2. Products
- 12.1.6.3. Company Financials
- 12.1.6.4. SWOT Analysis
- 12.1.7 DowDuPont
- 12.1.7.1. Company Overview
- 12.1.7.2. Products
- 12.1.7.3. Company Financials
- 12.1.7.4. SWOT Analysis
- 12.1.8 Monsanto Company
- 12.1.8.1. Company Overview
- 12.1.8.2. Products
- 12.1.8.3. Company Financials
- 12.1.8.4. SWOT Analysis
- 12.1.9 Gowan International
- 12.1.9.1. Company Overview
- 12.1.9.2. Products
- 12.1.9.3. Company Financials
- 12.1.9.4. SWOT Analysis
- 12.1.10 Chemtura Agro Solutions
- 12.1.10.1. Company Overview
- 12.1.10.2. Products
- 12.1.10.3. Company Financials
- 12.1.10.4. SWOT Analysis
- 12.1.11 Adama Agricultural Solutions
- 12.1.11.1. Company Overview
- 12.1.11.2. Products
- 12.1.11.3. Company Financials
- 12.1.11.4. SWOT Analysis
- 12.1.12 Koch Agronomic Services LLC
- 12.1.12.1. Company Overview
- 12.1.12.2. Products
- 12.1.12.3. Company Financials
- 12.1.12.4. SWOT Analysis
- 12.1.13 Nufarm Ltd
- 12.1.13.1. Company Overview
- 12.1.13.2. Products
- 12.1.13.3. Company Financials
- 12.1.13.4. SWOT Analysis
- 12.1.14 BASF SE
- 12.1.14.1. Company Overview
- 12.1.14.2. Products
- 12.1.14.3. Company Financials
- 12.1.14.4. SWOT Analysis
- 12.1.1 FMC Corporation
- 12.2. Market Entropy
- 12.2.1 Company's Key Areas Served
- 12.2.2 Recent Developments
- 12.3. Company Market Share Analysis 2025
- 12.3.1 Top 5 Companies Market Share Analysis
- 12.3.2 Top 3 Companies Market Share Analysis
- 12.4. List of Potential Customers
- 13. Research Methodology
List of Figures
- Figure 1: Global Turf & Ornamental Chemical Input Industry Revenue Breakdown (Million, %) by Region 2025 & 2033
- Figure 2: Global Turf & Ornamental Chemical Input Industry Volume Breakdown (Kiloton, %) by Region 2025 & 2033
- Figure 3: North America Turf & Ornamental Chemical Input Industry Revenue (Million), by Type of Turf Grass 2025 & 2033
- Figure 4: North America Turf & Ornamental Chemical Input Industry Volume (Kiloton), by Type of Turf Grass 2025 & 2033
- Figure 5: North America Turf & Ornamental Chemical Input Industry Revenue Share (%), by Type of Turf Grass 2025 & 2033
- Figure 6: North America Turf & Ornamental Chemical Input Industry Volume Share (%), by Type of Turf Grass 2025 & 2033
- Figure 7: North America Turf & Ornamental Chemical Input Industry Revenue (Million), by Type of Ornamental Grass 2025 & 2033
- Figure 8: North America Turf & Ornamental Chemical Input Industry Volume (Kiloton), by Type of Ornamental Grass 2025 & 2033
- Figure 9: North America Turf & Ornamental Chemical Input Industry Revenue Share (%), by Type of Ornamental Grass 2025 & 2033
- Figure 10: North America Turf & Ornamental Chemical Input Industry Volume Share (%), by Type of Ornamental Grass 2025 & 2033
- Figure 11: North America Turf & Ornamental Chemical Input Industry Revenue (Million), by Synthetic Chemical Inputs 2025 & 2033
- Figure 12: North America Turf & Ornamental Chemical Input Industry Volume (Kiloton), by Synthetic Chemical Inputs 2025 & 2033
- Figure 13: North America Turf & Ornamental Chemical Input Industry Revenue Share (%), by Synthetic Chemical Inputs 2025 & 2033
- Figure 14: North America Turf & Ornamental Chemical Input Industry Volume Share (%), by Synthetic Chemical Inputs 2025 & 2033
- Figure 15: North America Turf & Ornamental Chemical Input Industry Revenue (Million), by Type of Turf Grass 2025 & 2033
- Figure 16: North America Turf & Ornamental Chemical Input Industry Volume (Kiloton), by Type of Turf Grass 2025 & 2033
- Figure 17: North America Turf & Ornamental Chemical Input Industry Revenue Share (%), by Type of Turf Grass 2025 & 2033
- Figure 18: North America Turf & Ornamental Chemical Input Industry Volume Share (%), by Type of Turf Grass 2025 & 2033
- Figure 19: North America Turf & Ornamental Chemical Input Industry Revenue (Million), by Type of Ornamental Grass 2025 & 2033
- Figure 20: North America Turf & Ornamental Chemical Input Industry Volume (Kiloton), by Type of Ornamental Grass 2025 & 2033
- Figure 21: North America Turf & Ornamental Chemical Input Industry Revenue Share (%), by Type of Ornamental Grass 2025 & 2033
- Figure 22: North America Turf & Ornamental Chemical Input Industry Volume Share (%), by Type of Ornamental Grass 2025 & 2033
- Figure 23: North America Turf & Ornamental Chemical Input Industry Revenue (Million), by Synthetic Chemical Inputs 2025 & 2033
- Figure 24: North America Turf & Ornamental Chemical Input Industry Volume (Kiloton), by Synthetic Chemical Inputs 2025 & 2033
- Figure 25: North America Turf & Ornamental Chemical Input Industry Revenue Share (%), by Synthetic Chemical Inputs 2025 & 2033
- Figure 26: North America Turf & Ornamental Chemical Input Industry Volume Share (%), by Synthetic Chemical Inputs 2025 & 2033
- Figure 27: North America Turf & Ornamental Chemical Input Industry Revenue (Million), by Country 2025 & 2033
- Figure 28: North America Turf & Ornamental Chemical Input Industry Volume (Kiloton), by Country 2025 & 2033
- Figure 29: North America Turf & Ornamental Chemical Input Industry Revenue Share (%), by Country 2025 & 2033
- Figure 30: North America Turf & Ornamental Chemical Input Industry Volume Share (%), by Country 2025 & 2033
- Figure 31: Europe Turf & Ornamental Chemical Input Industry Revenue (Million), by Type of Turf Grass 2025 & 2033
- Figure 32: Europe Turf & Ornamental Chemical Input Industry Volume (Kiloton), by Type of Turf Grass 2025 & 2033
- Figure 33: Europe Turf & Ornamental Chemical Input Industry Revenue Share (%), by Type of Turf Grass 2025 & 2033
- Figure 34: Europe Turf & Ornamental Chemical Input Industry Volume Share (%), by Type of Turf Grass 2025 & 2033
- Figure 35: Europe Turf & Ornamental Chemical Input Industry Revenue (Million), by Type of Ornamental Grass 2025 & 2033
- Figure 36: Europe Turf & Ornamental Chemical Input Industry Volume (Kiloton), by Type of Ornamental Grass 2025 & 2033
- Figure 37: Europe Turf & Ornamental Chemical Input Industry Revenue Share (%), by Type of Ornamental Grass 2025 & 2033
- Figure 38: Europe Turf & Ornamental Chemical Input Industry Volume Share (%), by Type of Ornamental Grass 2025 & 2033
- Figure 39: Europe Turf & Ornamental Chemical Input Industry Revenue (Million), by Synthetic Chemical Inputs 2025 & 2033
- Figure 40: Europe Turf & Ornamental Chemical Input Industry Volume (Kiloton), by Synthetic Chemical Inputs 2025 & 2033
- Figure 41: Europe Turf & Ornamental Chemical Input Industry Revenue Share (%), by Synthetic Chemical Inputs 2025 & 2033
- Figure 42: Europe Turf & Ornamental Chemical Input Industry Volume Share (%), by Synthetic Chemical Inputs 2025 & 2033
- Figure 43: Europe Turf & Ornamental Chemical Input Industry Revenue (Million), by Type of Turf Grass 2025 & 2033
- Figure 44: Europe Turf & Ornamental Chemical Input Industry Volume (Kiloton), by Type of Turf Grass 2025 & 2033
- Figure 45: Europe Turf & Ornamental Chemical Input Industry Revenue Share (%), by Type of Turf Grass 2025 & 2033
- Figure 46: Europe Turf & Ornamental Chemical Input Industry Volume Share (%), by Type of Turf Grass 2025 & 2033
- Figure 47: Europe Turf & Ornamental Chemical Input Industry Revenue (Million), by Type of Ornamental Grass 2025 & 2033
- Figure 48: Europe Turf & Ornamental Chemical Input Industry Volume (Kiloton), by Type of Ornamental Grass 2025 & 2033
- Figure 49: Europe Turf & Ornamental Chemical Input Industry Revenue Share (%), by Type of Ornamental Grass 2025 & 2033
- Figure 50: Europe Turf & Ornamental Chemical Input Industry Volume Share (%), by Type of Ornamental Grass 2025 & 2033
- Figure 51: Europe Turf & Ornamental Chemical Input Industry Revenue (Million), by Synthetic Chemical Inputs 2025 & 2033
- Figure 52: Europe Turf & Ornamental Chemical Input Industry Volume (Kiloton), by Synthetic Chemical Inputs 2025 & 2033
- Figure 53: Europe Turf & Ornamental Chemical Input Industry Revenue Share (%), by Synthetic Chemical Inputs 2025 & 2033
- Figure 54: Europe Turf & Ornamental Chemical Input Industry Volume Share (%), by Synthetic Chemical Inputs 2025 & 2033
- Figure 55: Europe Turf & Ornamental Chemical Input Industry Revenue (Million), by Country 2025 & 2033
- Figure 56: Europe Turf & Ornamental Chemical Input Industry Volume (Kiloton), by Country 2025 & 2033
- Figure 57: Europe Turf & Ornamental Chemical Input Industry Revenue Share (%), by Country 2025 & 2033
- Figure 58: Europe Turf & Ornamental Chemical Input Industry Volume Share (%), by Country 2025 & 2033
- Figure 59: Asia Pacific Turf & Ornamental Chemical Input Industry Revenue (Million), by Type of Turf Grass 2025 & 2033
- Figure 60: Asia Pacific Turf & Ornamental Chemical Input Industry Volume (Kiloton), by Type of Turf Grass 2025 & 2033
- Figure 61: Asia Pacific Turf & Ornamental Chemical Input Industry Revenue Share (%), by Type of Turf Grass 2025 & 2033
- Figure 62: Asia Pacific Turf & Ornamental Chemical Input Industry Volume Share (%), by Type of Turf Grass 2025 & 2033
- Figure 63: Asia Pacific Turf & Ornamental Chemical Input Industry Revenue (Million), by Type of Ornamental Grass 2025 & 2033
- Figure 64: Asia Pacific Turf & Ornamental Chemical Input Industry Volume (Kiloton), by Type of Ornamental Grass 2025 & 2033
- Figure 65: Asia Pacific Turf & Ornamental Chemical Input Industry Revenue Share (%), by Type of Ornamental Grass 2025 & 2033
- Figure 66: Asia Pacific Turf & Ornamental Chemical Input Industry Volume Share (%), by Type of Ornamental Grass 2025 & 2033
- Figure 67: Asia Pacific Turf & Ornamental Chemical Input Industry Revenue (Million), by Synthetic Chemical Inputs 2025 & 2033
- Figure 68: Asia Pacific Turf & Ornamental Chemical Input Industry Volume (Kiloton), by Synthetic Chemical Inputs 2025 & 2033
- Figure 69: Asia Pacific Turf & Ornamental Chemical Input Industry Revenue Share (%), by Synthetic Chemical Inputs 2025 & 2033
- Figure 70: Asia Pacific Turf & Ornamental Chemical Input Industry Volume Share (%), by Synthetic Chemical Inputs 2025 & 2033
- Figure 71: Asia Pacific Turf & Ornamental Chemical Input Industry Revenue (Million), by Type of Turf Grass 2025 & 2033
- Figure 72: Asia Pacific Turf & Ornamental Chemical Input Industry Volume (Kiloton), by Type of Turf Grass 2025 & 2033
- Figure 73: Asia Pacific Turf & Ornamental Chemical Input Industry Revenue Share (%), by Type of Turf Grass 2025 & 2033
- Figure 74: Asia Pacific Turf & Ornamental Chemical Input Industry Volume Share (%), by Type of Turf Grass 2025 & 2033
- Figure 75: Asia Pacific Turf & Ornamental Chemical Input Industry Revenue (Million), by Type of Ornamental Grass 2025 & 2033
- Figure 76: Asia Pacific Turf & Ornamental Chemical Input Industry Volume (Kiloton), by Type of Ornamental Grass 2025 & 2033
- Figure 77: Asia Pacific Turf & Ornamental Chemical Input Industry Revenue Share (%), by Type of Ornamental Grass 2025 & 2033
- Figure 78: Asia Pacific Turf & Ornamental Chemical Input Industry Volume Share (%), by Type of Ornamental Grass 2025 & 2033
- Figure 79: Asia Pacific Turf & Ornamental Chemical Input Industry Revenue (Million), by Synthetic Chemical Inputs 2025 & 2033
- Figure 80: Asia Pacific Turf & Ornamental Chemical Input Industry Volume (Kiloton), by Synthetic Chemical Inputs 2025 & 2033
- Figure 81: Asia Pacific Turf & Ornamental Chemical Input Industry Revenue Share (%), by Synthetic Chemical Inputs 2025 & 2033
- Figure 82: Asia Pacific Turf & Ornamental Chemical Input Industry Volume Share (%), by Synthetic Chemical Inputs 2025 & 2033
- Figure 83: Asia Pacific Turf & Ornamental Chemical Input Industry Revenue (Million), by Country 2025 & 2033
- Figure 84: Asia Pacific Turf & Ornamental Chemical Input Industry Volume (Kiloton), by Country 2025 & 2033
- Figure 85: Asia Pacific Turf & Ornamental Chemical Input Industry Revenue Share (%), by Country 2025 & 2033
- Figure 86: Asia Pacific Turf & Ornamental Chemical Input Industry Volume Share (%), by Country 2025 & 2033
- Figure 87: South America Turf & Ornamental Chemical Input Industry Revenue (Million), by Type of Turf Grass 2025 & 2033
- Figure 88: South America Turf & Ornamental Chemical Input Industry Volume (Kiloton), by Type of Turf Grass 2025 & 2033
- Figure 89: South America Turf & Ornamental Chemical Input Industry Revenue Share (%), by Type of Turf Grass 2025 & 2033
- Figure 90: South America Turf & Ornamental Chemical Input Industry Volume Share (%), by Type of Turf Grass 2025 & 2033
- Figure 91: South America Turf & Ornamental Chemical Input Industry Revenue (Million), by Type of Ornamental Grass 2025 & 2033
- Figure 92: South America Turf & Ornamental Chemical Input Industry Volume (Kiloton), by Type of Ornamental Grass 2025 & 2033
- Figure 93: South America Turf & Ornamental Chemical Input Industry Revenue Share (%), by Type of Ornamental Grass 2025 & 2033
- Figure 94: South America Turf & Ornamental Chemical Input Industry Volume Share (%), by Type of Ornamental Grass 2025 & 2033
- Figure 95: South America Turf & Ornamental Chemical Input Industry Revenue (Million), by Synthetic Chemical Inputs 2025 & 2033
- Figure 96: South America Turf & Ornamental Chemical Input Industry Volume (Kiloton), by Synthetic Chemical Inputs 2025 & 2033
- Figure 97: South America Turf & Ornamental Chemical Input Industry Revenue Share (%), by Synthetic Chemical Inputs 2025 & 2033
- Figure 98: South America Turf & Ornamental Chemical Input Industry Volume Share (%), by Synthetic Chemical Inputs 2025 & 2033
- Figure 99: South America Turf & Ornamental Chemical Input Industry Revenue (Million), by Type of Turf Grass 2025 & 2033
- Figure 100: South America Turf & Ornamental Chemical Input Industry Volume (Kiloton), by Type of Turf Grass 2025 & 2033
- Figure 101: South America Turf & Ornamental Chemical Input Industry Revenue Share (%), by Type of Turf Grass 2025 & 2033
- Figure 102: South America Turf & Ornamental Chemical Input Industry Volume Share (%), by Type of Turf Grass 2025 & 2033
- Figure 103: South America Turf & Ornamental Chemical Input Industry Revenue (Million), by Type of Ornamental Grass 2025 & 2033
- Figure 104: South America Turf & Ornamental Chemical Input Industry Volume (Kiloton), by Type of Ornamental Grass 2025 & 2033
- Figure 105: South America Turf & Ornamental Chemical Input Industry Revenue Share (%), by Type of Ornamental Grass 2025 & 2033
- Figure 106: South America Turf & Ornamental Chemical Input Industry Volume Share (%), by Type of Ornamental Grass 2025 & 2033
- Figure 107: South America Turf & Ornamental Chemical Input Industry Revenue (Million), by Synthetic Chemical Inputs 2025 & 2033
- Figure 108: South America Turf & Ornamental Chemical Input Industry Volume (Kiloton), by Synthetic Chemical Inputs 2025 & 2033
- Figure 109: South America Turf & Ornamental Chemical Input Industry Revenue Share (%), by Synthetic Chemical Inputs 2025 & 2033
- Figure 110: South America Turf & Ornamental Chemical Input Industry Volume Share (%), by Synthetic Chemical Inputs 2025 & 2033
- Figure 111: South America Turf & Ornamental Chemical Input Industry Revenue (Million), by Country 2025 & 2033
- Figure 112: South America Turf & Ornamental Chemical Input Industry Volume (Kiloton), by Country 2025 & 2033
- Figure 113: South America Turf & Ornamental Chemical Input Industry Revenue Share (%), by Country 2025 & 2033
- Figure 114: South America Turf & Ornamental Chemical Input Industry Volume Share (%), by Country 2025 & 2033
- Figure 115: Africa Turf & Ornamental Chemical Input Industry Revenue (Million), by Type of Turf Grass 2025 & 2033
- Figure 116: Africa Turf & Ornamental Chemical Input Industry Volume (Kiloton), by Type of Turf Grass 2025 & 2033
- Figure 117: Africa Turf & Ornamental Chemical Input Industry Revenue Share (%), by Type of Turf Grass 2025 & 2033
- Figure 118: Africa Turf & Ornamental Chemical Input Industry Volume Share (%), by Type of Turf Grass 2025 & 2033
- Figure 119: Africa Turf & Ornamental Chemical Input Industry Revenue (Million), by Type of Ornamental Grass 2025 & 2033
- Figure 120: Africa Turf & Ornamental Chemical Input Industry Volume (Kiloton), by Type of Ornamental Grass 2025 & 2033
- Figure 121: Africa Turf & Ornamental Chemical Input Industry Revenue Share (%), by Type of Ornamental Grass 2025 & 2033
- Figure 122: Africa Turf & Ornamental Chemical Input Industry Volume Share (%), by Type of Ornamental Grass 2025 & 2033
- Figure 123: Africa Turf & Ornamental Chemical Input Industry Revenue (Million), by Synthetic Chemical Inputs 2025 & 2033
- Figure 124: Africa Turf & Ornamental Chemical Input Industry Volume (Kiloton), by Synthetic Chemical Inputs 2025 & 2033
- Figure 125: Africa Turf & Ornamental Chemical Input Industry Revenue Share (%), by Synthetic Chemical Inputs 2025 & 2033
- Figure 126: Africa Turf & Ornamental Chemical Input Industry Volume Share (%), by Synthetic Chemical Inputs 2025 & 2033
- Figure 127: Africa Turf & Ornamental Chemical Input Industry Revenue (Million), by Type of Turf Grass 2025 & 2033
- Figure 128: Africa Turf & Ornamental Chemical Input Industry Volume (Kiloton), by Type of Turf Grass 2025 & 2033
- Figure 129: Africa Turf & Ornamental Chemical Input Industry Revenue Share (%), by Type of Turf Grass 2025 & 2033
- Figure 130: Africa Turf & Ornamental Chemical Input Industry Volume Share (%), by Type of Turf Grass 2025 & 2033
- Figure 131: Africa Turf & Ornamental Chemical Input Industry Revenue (Million), by Type of Ornamental Grass 2025 & 2033
- Figure 132: Africa Turf & Ornamental Chemical Input Industry Volume (Kiloton), by Type of Ornamental Grass 2025 & 2033
- Figure 133: Africa Turf & Ornamental Chemical Input Industry Revenue Share (%), by Type of Ornamental Grass 2025 & 2033
- Figure 134: Africa Turf & Ornamental Chemical Input Industry Volume Share (%), by Type of Ornamental Grass 2025 & 2033
- Figure 135: Africa Turf & Ornamental Chemical Input Industry Revenue (Million), by Synthetic Chemical Inputs 2025 & 2033
- Figure 136: Africa Turf & Ornamental Chemical Input Industry Volume (Kiloton), by Synthetic Chemical Inputs 2025 & 2033
- Figure 137: Africa Turf & Ornamental Chemical Input Industry Revenue Share (%), by Synthetic Chemical Inputs 2025 & 2033
- Figure 138: Africa Turf & Ornamental Chemical Input Industry Volume Share (%), by Synthetic Chemical Inputs 2025 & 2033
- Figure 139: Africa Turf & Ornamental Chemical Input Industry Revenue (Million), by Country 2025 & 2033
- Figure 140: Africa Turf & Ornamental Chemical Input Industry Volume (Kiloton), by Country 2025 & 2033
- Figure 141: Africa Turf & Ornamental Chemical Input Industry Revenue Share (%), by Country 2025 & 2033
- Figure 142: Africa Turf & Ornamental Chemical Input Industry Volume Share (%), by Country 2025 & 2033
List of Tables
- Table 1: Global Turf & Ornamental Chemical Input Industry Revenue Million Forecast, by Type of Turf Grass 2020 & 2033
- Table 2: Global Turf & Ornamental Chemical Input Industry Volume Kiloton Forecast, by Type of Turf Grass 2020 & 2033
- Table 3: Global Turf & Ornamental Chemical Input Industry Revenue Million Forecast, by Type of Ornamental Grass 2020 & 2033
- Table 4: Global Turf & Ornamental Chemical Input Industry Volume Kiloton Forecast, by Type of Ornamental Grass 2020 & 2033
- Table 5: Global Turf & Ornamental Chemical Input Industry Revenue Million Forecast, by Synthetic Chemical Inputs 2020 & 2033
- Table 6: Global Turf & Ornamental Chemical Input Industry Volume Kiloton Forecast, by Synthetic Chemical Inputs 2020 & 2033
- Table 7: Global Turf & Ornamental Chemical Input Industry Revenue Million Forecast, by Type of Turf Grass 2020 & 2033
- Table 8: Global Turf & Ornamental Chemical Input Industry Volume Kiloton Forecast, by Type of Turf Grass 2020 & 2033
- Table 9: Global Turf & Ornamental Chemical Input Industry Revenue Million Forecast, by Type of Ornamental Grass 2020 & 2033
- Table 10: Global Turf & Ornamental Chemical Input Industry Volume Kiloton Forecast, by Type of Ornamental Grass 2020 & 2033
- Table 11: Global Turf & Ornamental Chemical Input Industry Revenue Million Forecast, by Synthetic Chemical Inputs 2020 & 2033
- Table 12: Global Turf & Ornamental Chemical Input Industry Volume Kiloton Forecast, by Synthetic Chemical Inputs 2020 & 2033
- Table 13: Global Turf & Ornamental Chemical Input Industry Revenue Million Forecast, by Region 2020 & 2033
- Table 14: Global Turf & Ornamental Chemical Input Industry Volume Kiloton Forecast, by Region 2020 & 2033
- Table 15: Global Turf & Ornamental Chemical Input Industry Revenue Million Forecast, by Type of Turf Grass 2020 & 2033
- Table 16: Global Turf & Ornamental Chemical Input Industry Volume Kiloton Forecast, by Type of Turf Grass 2020 & 2033
- Table 17: Global Turf & Ornamental Chemical Input Industry Revenue Million Forecast, by Type of Ornamental Grass 2020 & 2033
- Table 18: Global Turf & Ornamental Chemical Input Industry Volume Kiloton Forecast, by Type of Ornamental Grass 2020 & 2033
- Table 19: Global Turf & Ornamental Chemical Input Industry Revenue Million Forecast, by Synthetic Chemical Inputs 2020 & 2033
- Table 20: Global Turf & Ornamental Chemical Input Industry Volume Kiloton Forecast, by Synthetic Chemical Inputs 2020 & 2033
- Table 21: Global Turf & Ornamental Chemical Input Industry Revenue Million Forecast, by Type of Turf Grass 2020 & 2033
- Table 22: Global Turf & Ornamental Chemical Input Industry Volume Kiloton Forecast, by Type of Turf Grass 2020 & 2033
- Table 23: Global Turf & Ornamental Chemical Input Industry Revenue Million Forecast, by Type of Ornamental Grass 2020 & 2033
- Table 24: Global Turf & Ornamental Chemical Input Industry Volume Kiloton Forecast, by Type of Ornamental Grass 2020 & 2033
- Table 25: Global Turf & Ornamental Chemical Input Industry Revenue Million Forecast, by Synthetic Chemical Inputs 2020 & 2033
- Table 26: Global Turf & Ornamental Chemical Input Industry Volume Kiloton Forecast, by Synthetic Chemical Inputs 2020 & 2033
- Table 27: Global Turf & Ornamental Chemical Input Industry Revenue Million Forecast, by Country 2020 & 2033
- Table 28: Global Turf & Ornamental Chemical Input Industry Volume Kiloton Forecast, by Country 2020 & 2033
- Table 29: United States Turf & Ornamental Chemical Input Industry Revenue (Million) Forecast, by Application 2020 & 2033
- Table 30: United States Turf & Ornamental Chemical Input Industry Volume (Kiloton) Forecast, by Application 2020 & 2033
- Table 31: Canada Turf & Ornamental Chemical Input Industry Revenue (Million) Forecast, by Application 2020 & 2033
- Table 32: Canada Turf & Ornamental Chemical Input Industry Volume (Kiloton) Forecast, by Application 2020 & 2033
- Table 33: Mexico Turf & Ornamental Chemical Input Industry Revenue (Million) Forecast, by Application 2020 & 2033
- Table 34: Mexico Turf & Ornamental Chemical Input Industry Volume (Kiloton) Forecast, by Application 2020 & 2033
- Table 35: Rest of North America Turf & Ornamental Chemical Input Industry Revenue (Million) Forecast, by Application 2020 & 2033
- Table 36: Rest of North America Turf & Ornamental Chemical Input Industry Volume (Kiloton) Forecast, by Application 2020 & 2033
- Table 37: Global Turf & Ornamental Chemical Input Industry Revenue Million Forecast, by Type of Turf Grass 2020 & 2033
- Table 38: Global Turf & Ornamental Chemical Input Industry Volume Kiloton Forecast, by Type of Turf Grass 2020 & 2033
- Table 39: Global Turf & Ornamental Chemical Input Industry Revenue Million Forecast, by Type of Ornamental Grass 2020 & 2033
- Table 40: Global Turf & Ornamental Chemical Input Industry Volume Kiloton Forecast, by Type of Ornamental Grass 2020 & 2033
- Table 41: Global Turf & Ornamental Chemical Input Industry Revenue Million Forecast, by Synthetic Chemical Inputs 2020 & 2033
- Table 42: Global Turf & Ornamental Chemical Input Industry Volume Kiloton Forecast, by Synthetic Chemical Inputs 2020 & 2033
- Table 43: Global Turf & Ornamental Chemical Input Industry Revenue Million Forecast, by Type of Turf Grass 2020 & 2033
- Table 44: Global Turf & Ornamental Chemical Input Industry Volume Kiloton Forecast, by Type of Turf Grass 2020 & 2033
- Table 45: Global Turf & Ornamental Chemical Input Industry Revenue Million Forecast, by Type of Ornamental Grass 2020 & 2033
- Table 46: Global Turf & Ornamental Chemical Input Industry Volume Kiloton Forecast, by Type of Ornamental Grass 2020 & 2033
- Table 47: Global Turf & Ornamental Chemical Input Industry Revenue Million Forecast, by Synthetic Chemical Inputs 2020 & 2033
- Table 48: Global Turf & Ornamental Chemical Input Industry Volume Kiloton Forecast, by Synthetic Chemical Inputs 2020 & 2033
- Table 49: Global Turf & Ornamental Chemical Input Industry Revenue Million Forecast, by Country 2020 & 2033
- Table 50: Global Turf & Ornamental Chemical Input Industry Volume Kiloton Forecast, by Country 2020 & 2033
- Table 51: Spain Turf & Ornamental Chemical Input Industry Revenue (Million) Forecast, by Application 2020 & 2033
- Table 52: Spain Turf & Ornamental Chemical Input Industry Volume (Kiloton) Forecast, by Application 2020 & 2033
- Table 53: United Kingdom Turf & Ornamental Chemical Input Industry Revenue (Million) Forecast, by Application 2020 & 2033
- Table 54: United Kingdom Turf & Ornamental Chemical Input Industry Volume (Kiloton) Forecast, by Application 2020 & 2033
- Table 55: France Turf & Ornamental Chemical Input Industry Revenue (Million) Forecast, by Application 2020 & 2033
- Table 56: France Turf & Ornamental Chemical Input Industry Volume (Kiloton) Forecast, by Application 2020 & 2033
- Table 57: Germany Turf & Ornamental Chemical Input Industry Revenue (Million) Forecast, by Application 2020 & 2033
- Table 58: Germany Turf & Ornamental Chemical Input Industry Volume (Kiloton) Forecast, by Application 2020 & 2033
- Table 59: Denmark Turf & Ornamental Chemical Input Industry Revenue (Million) Forecast, by Application 2020 & 2033
- Table 60: Denmark Turf & Ornamental Chemical Input Industry Volume (Kiloton) Forecast, by Application 2020 & 2033
- Table 61: Italy Turf & Ornamental Chemical Input Industry Revenue (Million) Forecast, by Application 2020 & 2033
- Table 62: Italy Turf & Ornamental Chemical Input Industry Volume (Kiloton) Forecast, by Application 2020 & 2033
- Table 63: Rest of Europe Turf & Ornamental Chemical Input Industry Revenue (Million) Forecast, by Application 2020 & 2033
- Table 64: Rest of Europe Turf & Ornamental Chemical Input Industry Volume (Kiloton) Forecast, by Application 2020 & 2033
- Table 65: Global Turf & Ornamental Chemical Input Industry Revenue Million Forecast, by Type of Turf Grass 2020 & 2033
- Table 66: Global Turf & Ornamental Chemical Input Industry Volume Kiloton Forecast, by Type of Turf Grass 2020 & 2033
- Table 67: Global Turf & Ornamental Chemical Input Industry Revenue Million Forecast, by Type of Ornamental Grass 2020 & 2033
- Table 68: Global Turf & Ornamental Chemical Input Industry Volume Kiloton Forecast, by Type of Ornamental Grass 2020 & 2033
- Table 69: Global Turf & Ornamental Chemical Input Industry Revenue Million Forecast, by Synthetic Chemical Inputs 2020 & 2033
- Table 70: Global Turf & Ornamental Chemical Input Industry Volume Kiloton Forecast, by Synthetic Chemical Inputs 2020 & 2033
- Table 71: Global Turf & Ornamental Chemical Input Industry Revenue Million Forecast, by Type of Turf Grass 2020 & 2033
- Table 72: Global Turf & Ornamental Chemical Input Industry Volume Kiloton Forecast, by Type of Turf Grass 2020 & 2033
- Table 73: Global Turf & Ornamental Chemical Input Industry Revenue Million Forecast, by Type of Ornamental Grass 2020 & 2033
- Table 74: Global Turf & Ornamental Chemical Input Industry Volume Kiloton Forecast, by Type of Ornamental Grass 2020 & 2033
- Table 75: Global Turf & Ornamental Chemical Input Industry Revenue Million Forecast, by Synthetic Chemical Inputs 2020 & 2033
- Table 76: Global Turf & Ornamental Chemical Input Industry Volume Kiloton Forecast, by Synthetic Chemical Inputs 2020 & 2033
- Table 77: Global Turf & Ornamental Chemical Input Industry Revenue Million Forecast, by Country 2020 & 2033
- Table 78: Global Turf & Ornamental Chemical Input Industry Volume Kiloton Forecast, by Country 2020 & 2033
- Table 79: China Turf & Ornamental Chemical Input Industry Revenue (Million) Forecast, by Application 2020 & 2033
- Table 80: China Turf & Ornamental Chemical Input Industry Volume (Kiloton) Forecast, by Application 2020 & 2033
- Table 81: India Turf & Ornamental Chemical Input Industry Revenue (Million) Forecast, by Application 2020 & 2033
- Table 82: India Turf & Ornamental Chemical Input Industry Volume (Kiloton) Forecast, by Application 2020 & 2033
- Table 83: Japan Turf & Ornamental Chemical Input Industry Revenue (Million) Forecast, by Application 2020 & 2033
- Table 84: Japan Turf & Ornamental Chemical Input Industry Volume (Kiloton) Forecast, by Application 2020 & 2033
- Table 85: Thailand Turf & Ornamental Chemical Input Industry Revenue (Million) Forecast, by Application 2020 & 2033
- Table 86: Thailand Turf & Ornamental Chemical Input Industry Volume (Kiloton) Forecast, by Application 2020 & 2033
- Table 87: Australia Turf & Ornamental Chemical Input Industry Revenue (Million) Forecast, by Application 2020 & 2033
- Table 88: Australia Turf & Ornamental Chemical Input Industry Volume (Kiloton) Forecast, by Application 2020 & 2033
- Table 89: Rest of Asia Pacific Turf & Ornamental Chemical Input Industry Revenue (Million) Forecast, by Application 2020 & 2033
- Table 90: Rest of Asia Pacific Turf & Ornamental Chemical Input Industry Volume (Kiloton) Forecast, by Application 2020 & 2033
- Table 91: Global Turf & Ornamental Chemical Input Industry Revenue Million Forecast, by Type of Turf Grass 2020 & 2033
- Table 92: Global Turf & Ornamental Chemical Input Industry Volume Kiloton Forecast, by Type of Turf Grass 2020 & 2033
- Table 93: Global Turf & Ornamental Chemical Input Industry Revenue Million Forecast, by Type of Ornamental Grass 2020 & 2033
- Table 94: Global Turf & Ornamental Chemical Input Industry Volume Kiloton Forecast, by Type of Ornamental Grass 2020 & 2033
- Table 95: Global Turf & Ornamental Chemical Input Industry Revenue Million Forecast, by Synthetic Chemical Inputs 2020 & 2033
- Table 96: Global Turf & Ornamental Chemical Input Industry Volume Kiloton Forecast, by Synthetic Chemical Inputs 2020 & 2033
- Table 97: Global Turf & Ornamental Chemical Input Industry Revenue Million Forecast, by Type of Turf Grass 2020 & 2033
- Table 98: Global Turf & Ornamental Chemical Input Industry Volume Kiloton Forecast, by Type of Turf Grass 2020 & 2033
- Table 99: Global Turf & Ornamental Chemical Input Industry Revenue Million Forecast, by Type of Ornamental Grass 2020 & 2033
- Table 100: Global Turf & Ornamental Chemical Input Industry Volume Kiloton Forecast, by Type of Ornamental Grass 2020 & 2033
- Table 101: Global Turf & Ornamental Chemical Input Industry Revenue Million Forecast, by Synthetic Chemical Inputs 2020 & 2033
- Table 102: Global Turf & Ornamental Chemical Input Industry Volume Kiloton Forecast, by Synthetic Chemical Inputs 2020 & 2033
- Table 103: Global Turf & Ornamental Chemical Input Industry Revenue Million Forecast, by Country 2020 & 2033
- Table 104: Global Turf & Ornamental Chemical Input Industry Volume Kiloton Forecast, by Country 2020 & 2033
- Table 105: Brazil Turf & Ornamental Chemical Input Industry Revenue (Million) Forecast, by Application 2020 & 2033
- Table 106: Brazil Turf & Ornamental Chemical Input Industry Volume (Kiloton) Forecast, by Application 2020 & 2033
- Table 107: Argentina Turf & Ornamental Chemical Input Industry Revenue (Million) Forecast, by Application 2020 & 2033
- Table 108: Argentina Turf & Ornamental Chemical Input Industry Volume (Kiloton) Forecast, by Application 2020 & 2033
- Table 109: Rest of South America Turf & Ornamental Chemical Input Industry Revenue (Million) Forecast, by Application 2020 & 2033
- Table 110: Rest of South America Turf & Ornamental Chemical Input Industry Volume (Kiloton) Forecast, by Application 2020 & 2033
- Table 111: Global Turf & Ornamental Chemical Input Industry Revenue Million Forecast, by Type of Turf Grass 2020 & 2033
- Table 112: Global Turf & Ornamental Chemical Input Industry Volume Kiloton Forecast, by Type of Turf Grass 2020 & 2033
- Table 113: Global Turf & Ornamental Chemical Input Industry Revenue Million Forecast, by Type of Ornamental Grass 2020 & 2033
- Table 114: Global Turf & Ornamental Chemical Input Industry Volume Kiloton Forecast, by Type of Ornamental Grass 2020 & 2033
- Table 115: Global Turf & Ornamental Chemical Input Industry Revenue Million Forecast, by Synthetic Chemical Inputs 2020 & 2033
- Table 116: Global Turf & Ornamental Chemical Input Industry Volume Kiloton Forecast, by Synthetic Chemical Inputs 2020 & 2033
- Table 117: Global Turf & Ornamental Chemical Input Industry Revenue Million Forecast, by Type of Turf Grass 2020 & 2033
- Table 118: Global Turf & Ornamental Chemical Input Industry Volume Kiloton Forecast, by Type of Turf Grass 2020 & 2033
- Table 119: Global Turf & Ornamental Chemical Input Industry Revenue Million Forecast, by Type of Ornamental Grass 2020 & 2033
- Table 120: Global Turf & Ornamental Chemical Input Industry Volume Kiloton Forecast, by Type of Ornamental Grass 2020 & 2033
- Table 121: Global Turf & Ornamental Chemical Input Industry Revenue Million Forecast, by Synthetic Chemical Inputs 2020 & 2033
- Table 122: Global Turf & Ornamental Chemical Input Industry Volume Kiloton Forecast, by Synthetic Chemical Inputs 2020 & 2033
- Table 123: Global Turf & Ornamental Chemical Input Industry Revenue Million Forecast, by Country 2020 & 2033
- Table 124: Global Turf & Ornamental Chemical Input Industry Volume Kiloton Forecast, by Country 2020 & 2033
- Table 125: South Africa Turf & Ornamental Chemical Input Industry Revenue (Million) Forecast, by Application 2020 & 2033
- Table 126: South Africa Turf & Ornamental Chemical Input Industry Volume (Kiloton) Forecast, by Application 2020 & 2033
- Table 127: Rest of Africa Turf & Ornamental Chemical Input Industry Revenue (Million) Forecast, by Application 2020 & 2033
- Table 128: Rest of Africa Turf & Ornamental Chemical Input Industry Volume (Kiloton) Forecast, by Application 2020 & 2033
Frequently Asked Questions
1. What is the projected Compound Annual Growth Rate (CAGR) of the Turf & Ornamental Chemical Input Industry?
The projected CAGR is approximately 4.34%.
2. Which companies are prominent players in the Turf & Ornamental Chemical Input Industry?
Key companies in the market include FMC Corporation, Bayer Crop Sciences, American Vanguard Corporation, Chemisco Division of United Industries Corp, Syngenta A, Precision Laboratories, DowDuPont, Monsanto Company, Gowan International, Chemtura Agro Solutions, Adama Agricultural Solutions, Koch Agronomic Services LLC, Nufarm Ltd, BASF SE.
3. What are the main segments of the Turf & Ornamental Chemical Input Industry?
The market segments include Type of Turf Grass, Type of Ornamental Grass, Synthetic Chemical Inputs, Type of Turf Grass, Type of Ornamental Grass, Synthetic Chemical Inputs.
4. Can you provide details about the market size?
The market size is estimated to be USD 7.02 Million as of 2022.
5. What are some drivers contributing to market growth?
Seed Treatment As A Solution To Enhance Yield; Growing Awareness For Seed Treatment Among The Farmers; Rising Trend Of Organic Farming.
6. What are the notable trends driving market growth?
Increasing Development of the Golf Courses and Sports Field.
7. Are there any restraints impacting market growth?
Limitations Across Farm-Level Seed Treatment; Rising Environmental Concerns.
8. Can you provide examples of recent developments in the market?
March 2022: BASF introduced Pillar SC Intrinsic brand fungicide.This fungicide provided broad-spectrum control of 26 cool- and warm-season turf diseases, like brown patch, dollar spot, leaf spots and large patch with one use rate. Pillar SC Intrinsic brand fungicide is the first fungicide developed for lawn care from BASF.
9. What pricing options are available for accessing the report?
Pricing options include single-user, multi-user, and enterprise licenses priced at USD 4750, USD 5250, and USD 8750 respectively.
10. Is the market size provided in terms of value or volume?
The market size is provided in terms of value, measured in Million and volume, measured in Kiloton.
11. Are there any specific market keywords associated with the report?
Yes, the market keyword associated with the report is "Turf & Ornamental Chemical Input Industry," which aids in identifying and referencing the specific market segment covered.
12. How do I determine which pricing option suits my needs best?
The pricing options vary based on user requirements and access needs. Individual users may opt for single-user licenses, while businesses requiring broader access may choose multi-user or enterprise licenses for cost-effective access to the report.
13. Are there any additional resources or data provided in the Turf & Ornamental Chemical Input Industry report?
While the report offers comprehensive insights, it's advisable to review the specific contents or supplementary materials provided to ascertain if additional resources or data are available.
14. How can I stay updated on further developments or reports in the Turf & Ornamental Chemical Input Industry?
To stay informed about further developments, trends, and reports in the Turf & Ornamental Chemical Input Industry, consider subscribing to industry newsletters, following relevant companies and organizations, or regularly checking reputable industry news sources and publications.
Methodology
Step 1 - Identification of Relevant Samples Size from Population Database


Step 2 - Approaches for Defining Global Market Size (Value, Volume* & Price*)

Note*: In applicable scenarios
Step 3 - Data Sources
Primary Research
- Web Analytics
- Survey Reports
- Research Institute
- Latest Research Reports
- Opinion Leaders
Secondary Research
- Annual Reports
- White Paper
- Latest Press Release
- Industry Association
- Paid Database
- Investor Presentations

Step 4 - Data Triangulation
Involves using different sources of information in order to increase the validity of a study
These sources are likely to be stakeholders in a program - participants, other researchers, program staff, other community members, and so on.
Then we put all data in single framework & apply various statistical tools to find out the dynamic on the market.
During the analysis stage, feedback from the stakeholder groups would be compared to determine areas of agreement as well as areas of divergence