

Key Insights
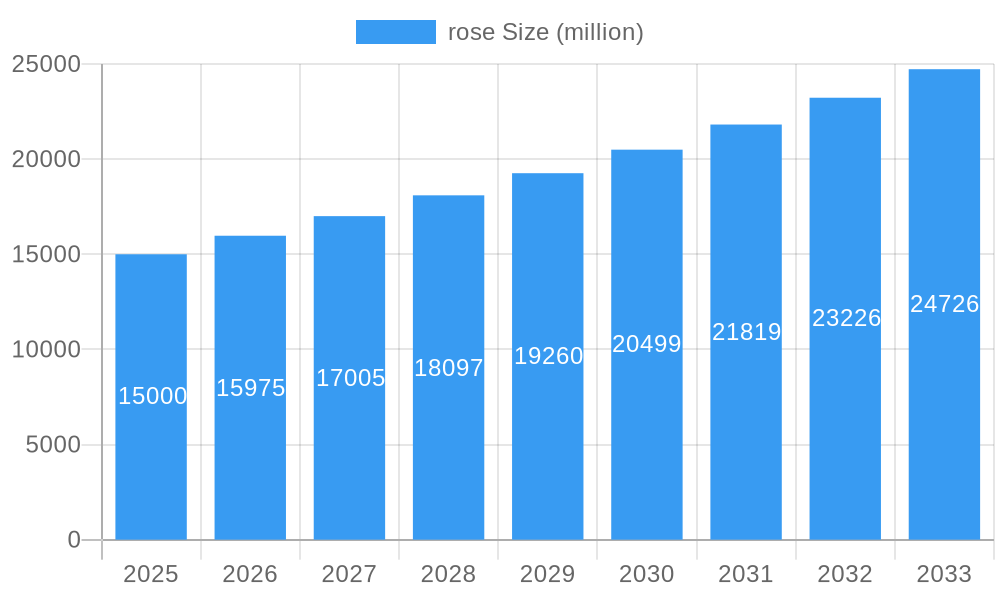
The global rose market is poised for substantial growth, driven by increasing demand for ornamental plants and the expanding floral industry across both commercial and household applications. With a projected market size of approximately $15,000 million in 2025, the sector is anticipated to expand at a robust Compound Annual Growth Rate (CAGR) of 6.5% through 2033. This upward trajectory is fueled by several key factors. The enduring cultural significance of roses in gifting, celebrations, and decor continues to be a primary driver. Furthermore, advancements in cultivation techniques and the introduction of novel rose varieties with enhanced resilience and aesthetic appeal are broadening their appeal to a wider consumer base. The commercial sector, encompassing florists, event planners, and the hospitality industry, remains a significant contributor, while a burgeoning trend of home gardening and interior decor with live plants is also boosting household consumption. Emerging markets, particularly in Asia Pacific, are expected to play a pivotal role in this expansion due to rising disposable incomes and a growing appreciation for floral aesthetics.
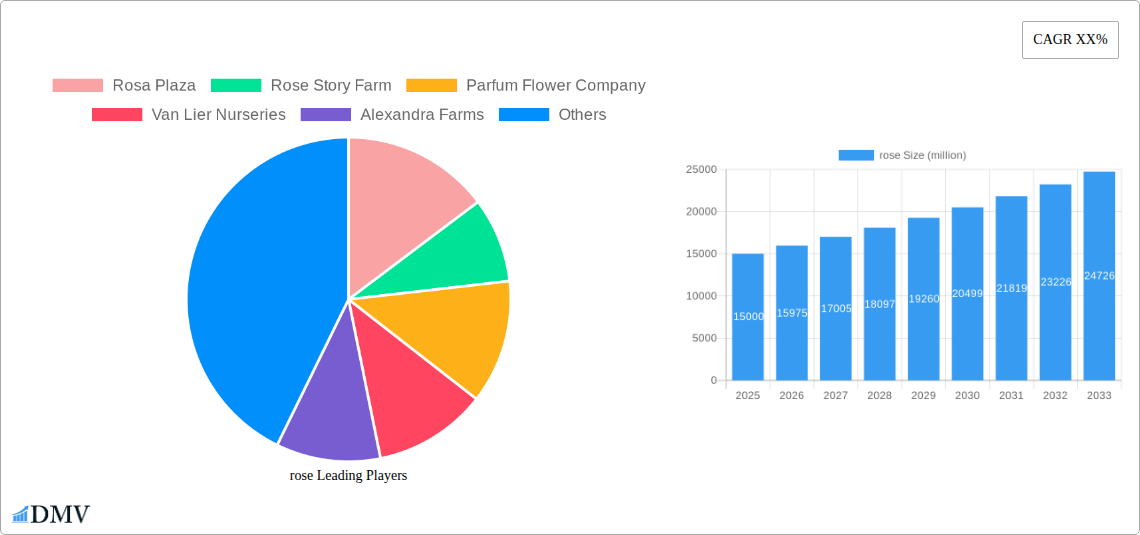
rose Market Size (In Billion)
The market segmentation reveals distinct opportunities within both application and type categories. Commercial use applications, including events, retail floristry, and landscape design, represent the largest share, driven by large-scale procurement and continuous demand. Household use is steadily gaining traction, reflecting a growing consumer desire for home beautification and the therapeutic benefits associated with indoor plants. In terms of types, Spray Roses are experiencing remarkable demand due to their versatility in arrangements, offering volume and intricate detail, while Single Roses continue to hold their ground as classic symbols of love and admiration. Key players like Alexandra Farms, Esmeralda Farms, and Rio Roses are actively innovating and expanding their product portfolios to cater to these evolving market needs. However, challenges such as fluctuating weather patterns impacting cultivation, the high cost of specialized cultivation for certain varieties, and the logistical complexities of perishable goods pose potential restraints to the market's unhindered growth, necessitating strategic planning and investment in resilient supply chains.
rose Company Market Share
Unveiling the Global Rose Market: Trends, Innovations, and Future Outlook (2019-2033)
This comprehensive report provides an in-depth analysis of the global rose market, meticulously examining its composition, evolution, key drivers, and future trajectory. Spanning the study period from 2019 to 2033, with a base year of 2025, this report leverages historical data, current trends, and forward-looking projections to offer unparalleled insights for stakeholders. We delve into market concentration, innovation, regulatory landscapes, and the strategic activities of major industry players, providing a clear roadmap for navigating this vibrant and evolving sector.
Rose Market Composition & Trends
The global rose market exhibits a dynamic composition influenced by diverse applications and evolving consumer preferences. Market concentration remains moderately fragmented, with key players vying for dominance. Innovation catalysts are primarily driven by advancements in cultivation techniques, novel breeding programs, and the development of sustainable practices. The regulatory landscape, while generally supportive, varies across regions, impacting import/export dynamics and quality standards. Substitute products, though present, are largely unable to replicate the unique emotional and aesthetic appeal of roses. End-user profiles are diverse, encompassing commercial florists, event planners, household consumers, and the fragrance industry. Mergers and acquisitions (M&A) activities have been strategic, aimed at consolidating market share and expanding geographical reach, with estimated M&A deal values reaching millions annually.
- Market Share Distribution: Leading companies command significant, though not absolute, market share, with a steady influx of new entrants and specialized growers.
- Innovation Focus: Emphasis on disease resistance, extended vase life, unique color varieties, and organic cultivation methods.
- Regulatory Impact: Strict phytosanitary regulations and certifications shape international trade and product quality.
- Substitute Threat Analysis: While artificial flowers and other botanical options exist, the symbolic and sensory value of fresh roses remains unmatched.
- M&A Strategic Rationale: Acquisitions often target companies with unique varietal portfolios or established distribution networks, with estimated deal values in the millions.
Rose Industry Evolution
The rose industry has undergone a significant evolution, characterized by consistent market growth trajectories fueled by increasing demand across various sectors. Technological advancements in greenhouse cultivation, hydroponics, and precision farming have dramatically improved yield, quality, and consistency, enabling year-round supply. Shifting consumer demands, particularly the growing appreciation for premium and exotic rose varieties, coupled with the rise of e-commerce platforms for floral delivery, have reshaped consumption patterns. The historical period (2019–2024) witnessed a steady upward trend in global rose sales, with an estimated growth rate of x.x% annually. The base year (2025) is projected to see continued expansion, with the forecast period (2025–2033) anticipating sustained growth, driven by emerging markets and a renewed focus on gifting and event décor. Adoption metrics for new cultivation technologies are rising, with millions of hectares now employing advanced growing systems.
Leading Regions, Countries, or Segments in Rose
The Commercial Use segment, encompassing floral arrangements, events, and the fragrance industry, dominates the global rose market. This dominance is underpinned by consistent demand from professional florists and event planners who rely on roses for their versatility, aesthetic appeal, and symbolic significance. Regions with robust floral industries and favorable climates for rose cultivation, such as [Insert Dominant Region, e.g., Europe, South America], are key contributors. Within this region, specific countries like [Insert Dominant Country, e.g., Ecuador, The Netherlands] stand out due to their advanced horticultural practices and strong export networks. The Types: Single Roses segment within commercial use also holds a significant share due to their widespread application in bouquets and arrangements.
- Key Drivers for Commercial Use Dominance:
- High Investment Trends: Significant capital investment in large-scale commercial rose farms and advanced cultivation technologies.
- Regulatory Support: Favorable trade agreements and import/export policies facilitating global distribution of commercial rose products.
- Event Industry Demand: Consistent demand from weddings, corporate events, and public celebrations.
- Fragrance Industry Integration: Roses remain a cornerstone ingredient in high-value perfumes and cosmetics.
- In-depth Analysis of Dominance Factors: The commercial sector benefits from economies of scale, sophisticated logistics, and established relationships with wholesale buyers. The ability to produce a wide array of varieties, colors, and stem lengths caters to diverse commercial needs. Furthermore, the intrinsic value and emotional resonance of roses in gift-giving and special occasions solidify their position in commercial applications.
Rose Product Innovations
Recent product innovations in the rose market are significantly enhancing their appeal and utility. Breeders are achieving remarkable success in developing roses with extended vase life, reaching up to xx days under optimal conditions, and exhibiting exceptional resistance to common diseases, reducing the need for chemical interventions. Novel color palettes, including rare blues and deep blacks, are capturing consumer attention. Furthermore, advancements in preservation techniques are enabling the creation of long-lasting preserved roses, suitable for decorative purposes and artisanal crafts, with an estimated market value of millions. Unique selling propositions often lie in sustainably grown, ethically sourced varieties that appeal to the environmentally conscious consumer.
Propelling Factors for Rose Growth
Several key factors are propelling the growth of the rose market. Technologically, advancements in hydroponic farming and climate-controlled greenhouses ensure consistent, high-quality production year-round, overcoming seasonal limitations. Economically, rising disposable incomes in emerging economies are fueling demand for premium floral products, including roses, for gifting and home décor. Regulatory-wise, supportive trade policies and a growing emphasis on sustainable agricultural practices are creating a favorable environment for responsible rose cultivation and distribution, with global market growth projected to reach millions by the forecast period.
Obstacles in the Rose Market
Despite robust growth, the rose market faces several obstacles. Regulatory challenges, including stringent phytosanitary requirements and varying import restrictions across countries, can impede international trade and increase logistical complexities. Supply chain disruptions, exacerbated by global events, can impact the timely delivery of fresh roses, leading to potential spoilage and financial losses. Competitive pressures from a diverse range of ornamental flowers and the increasing availability of artificial alternatives also present a continuous challenge, with the cost of premium roses sometimes limiting accessibility for certain consumer segments.
Future Opportunities in Rose
Emerging opportunities in the rose market are abundant. The burgeoning e-commerce sector presents a significant avenue for direct-to-consumer sales, expanding market reach and customer engagement. Technological advancements in breeding are paving the way for even more resilient and uniquely colored varieties, catering to niche markets and designer preferences. The growing consumer interest in wellness and biophilic design creates opportunities for increased home use of roses for their aesthetic and mood-enhancing qualities. Furthermore, the exploration of new applications in culinary and medicinal fields holds promising, albeit nascent, potential for market expansion, with an estimated millions in untapped potential.
Major Players in the Rose Ecosystem
- Rosa Plaza
- Rose Story Farm
- Parfum Flower Company
- Van Lier Nurseries
- Alexandra Farms
- Esmeralda Farms
- Jet Fresh Flower Growers
- Soho Rose Farm
- Subati Group
- Rio Roses
- Royal Flowers
- Virgin Farms
- Pajarosa Floral
Key Developments in Rose Industry
- 2023 - Introduction of disease-resistant rose varietals: Significantly reduced crop loss and the need for chemical treatments.
- 2022 - Expansion of vertical farming for rose cultivation: Increased efficiency and reduced land usage, with millions invested globally.
- 2021 - Surge in online flower delivery services: Facilitated direct-to-consumer sales and expanded market access for growers.
- 2020 - Focus on sustainable and organic rose farming practices: Driven by consumer demand for eco-friendly products.
- 2019 - Development of advanced rose preservation techniques: Extending the shelf life of roses for decorative and artisanal applications.
Strategic Rose Market Forecast
The strategic forecast for the rose market is exceptionally promising, driven by sustained demand in Commercial Use and a growing appreciation for Household Use. Key growth catalysts include ongoing technological innovations in cultivation, leading to higher yields and superior quality, alongside the expanding reach of e-commerce platforms. Emerging markets present significant untapped potential, while a continued emphasis on sustainability and unique varietal development will further invigorate the sector. The market is poised for robust growth, with an anticipated market size reaching millions by the end of the forecast period.
rose Segmentation
-
1. Application
- 1.1. Commercial Use
- 1.2. Household Use
-
2. Types
- 2.1. Spray Roses
- 2.2. Single Roses
rose Segmentation By Geography
-
1. North America
- 1.1. United States
- 1.2. Canada
- 1.3. Mexico
-
2. South America
- 2.1. Brazil
- 2.2. Argentina
- 2.3. Rest of South America
-
3. Europe
- 3.1. United Kingdom
- 3.2. Germany
- 3.3. France
- 3.4. Italy
- 3.5. Spain
- 3.6. Russia
- 3.7. Benelux
- 3.8. Nordics
- 3.9. Rest of Europe
-
4. Middle East & Africa
- 4.1. Turkey
- 4.2. Israel
- 4.3. GCC
- 4.4. North Africa
- 4.5. South Africa
- 4.6. Rest of Middle East & Africa
-
5. Asia Pacific
- 5.1. China
- 5.2. India
- 5.3. Japan
- 5.4. South Korea
- 5.5. ASEAN
- 5.6. Oceania
- 5.7. Rest of Asia Pacific
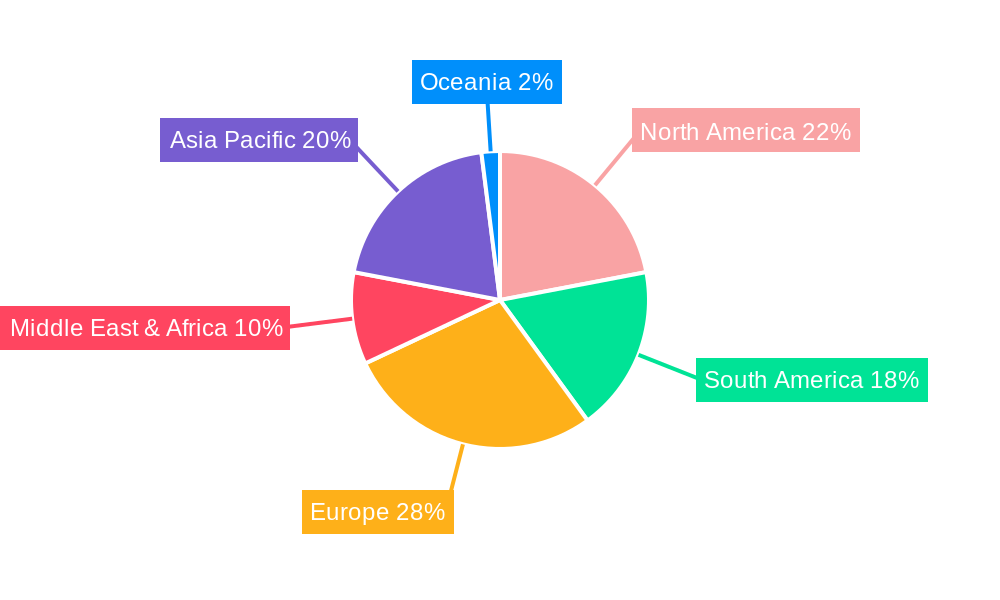
rose Regional Market Share
Geographic Coverage of rose
rose REPORT HIGHLIGHTS
| Aspects | Details |
|---|---|
| Study Period | 2020-2034 |
| Base Year | 2025 |
| Estimated Year | 2026 |
| Forecast Period | 2026-2034 |
| Historical Period | 2020-2025 |
| Growth Rate | CAGR of 5.62% from 2020-2034 |
| Segmentation |
|
Table of Contents
- 1. Introduction
- 1.1. Research Scope
- 1.2. Market Segmentation
- 1.3. Research Objective
- 1.4. Definitions and Assumptions
- 2. Executive Summary
- 2.1. Market Snapshot
- 3. Market Dynamics
- 3.1. Market Drivers
- 3.2. Market Restrains
- 3.3. Market Trends
- 3.4. Market Opportunities
- 4. Market Factor Analysis
- 4.1. Porters Five Forces
- 4.1.1. Bargaining Power of Suppliers
- 4.1.2. Bargaining Power of Buyers
- 4.1.3. Threat of New Entrants
- 4.1.4. Threat of Substitutes
- 4.1.5. Competitive Rivalry
- 4.2. PESTEL analysis
- 4.3. BCG Analysis
- 4.3.1. Stars (High Growth, High Market Share)
- 4.3.2. Cash Cows (Low Growth, High Market Share)
- 4.3.3. Question Mark (High Growth, Low Market Share)
- 4.3.4. Dogs (Low Growth, Low Market Share)
- 4.4. Ansoff Matrix Analysis
- 4.5. Supply Chain Analysis
- 4.6. Regulatory Landscape
- 4.7. Current Market Potential and Opportunity Assessment (TAM–SAM–SOM Framework)
- 4.8. DMV Analyst Note
- 4.1. Porters Five Forces
- 5. Market Analysis, Insights and Forecast 2021-2033
- 5.1. Market Analysis, Insights and Forecast - by Application
- 5.1.1. Commercial Use
- 5.1.2. Household Use
- 5.2. Market Analysis, Insights and Forecast - by Types
- 5.2.1. Spray Roses
- 5.2.2. Single Roses
- 5.3. Market Analysis, Insights and Forecast - by Region
- 5.3.1. North America
- 5.3.2. South America
- 5.3.3. Europe
- 5.3.4. Middle East & Africa
- 5.3.5. Asia Pacific
- 5.1. Market Analysis, Insights and Forecast - by Application
- 6. Global rose Analysis, Insights and Forecast, 2021-2033
- 6.1. Market Analysis, Insights and Forecast - by Application
- 6.1.1. Commercial Use
- 6.1.2. Household Use
- 6.2. Market Analysis, Insights and Forecast - by Types
- 6.2.1. Spray Roses
- 6.2.2. Single Roses
- 6.1. Market Analysis, Insights and Forecast - by Application
- 7. North America rose Analysis, Insights and Forecast, 2020-2032
- 7.1. Market Analysis, Insights and Forecast - by Application
- 7.1.1. Commercial Use
- 7.1.2. Household Use
- 7.2. Market Analysis, Insights and Forecast - by Types
- 7.2.1. Spray Roses
- 7.2.2. Single Roses
- 7.1. Market Analysis, Insights and Forecast - by Application
- 8. South America rose Analysis, Insights and Forecast, 2020-2032
- 8.1. Market Analysis, Insights and Forecast - by Application
- 8.1.1. Commercial Use
- 8.1.2. Household Use
- 8.2. Market Analysis, Insights and Forecast - by Types
- 8.2.1. Spray Roses
- 8.2.2. Single Roses
- 8.1. Market Analysis, Insights and Forecast - by Application
- 9. Europe rose Analysis, Insights and Forecast, 2020-2032
- 9.1. Market Analysis, Insights and Forecast - by Application
- 9.1.1. Commercial Use
- 9.1.2. Household Use
- 9.2. Market Analysis, Insights and Forecast - by Types
- 9.2.1. Spray Roses
- 9.2.2. Single Roses
- 9.1. Market Analysis, Insights and Forecast - by Application
- 10. Middle East & Africa rose Analysis, Insights and Forecast, 2020-2032
- 10.1. Market Analysis, Insights and Forecast - by Application
- 10.1.1. Commercial Use
- 10.1.2. Household Use
- 10.2. Market Analysis, Insights and Forecast - by Types
- 10.2.1. Spray Roses
- 10.2.2. Single Roses
- 10.1. Market Analysis, Insights and Forecast - by Application
- 11. Asia Pacific rose Analysis, Insights and Forecast, 2020-2032
- 11.1. Market Analysis, Insights and Forecast - by Application
- 11.1.1. Commercial Use
- 11.1.2. Household Use
- 11.2. Market Analysis, Insights and Forecast - by Types
- 11.2.1. Spray Roses
- 11.2.2. Single Roses
- 11.1. Market Analysis, Insights and Forecast - by Application
- 12. Competitive Analysis
- 12.1. Company Profiles
- 12.1.1 Rosa Plaza
- 12.1.1.1. Company Overview
- 12.1.1.2. Products
- 12.1.1.3. Company Financials
- 12.1.1.4. SWOT Analysis
- 12.1.2 Rose Story Farm
- 12.1.2.1. Company Overview
- 12.1.2.2. Products
- 12.1.2.3. Company Financials
- 12.1.2.4. SWOT Analysis
- 12.1.3 Parfum Flower Company
- 12.1.3.1. Company Overview
- 12.1.3.2. Products
- 12.1.3.3. Company Financials
- 12.1.3.4. SWOT Analysis
- 12.1.4 Van Lier Nurseries
- 12.1.4.1. Company Overview
- 12.1.4.2. Products
- 12.1.4.3. Company Financials
- 12.1.4.4. SWOT Analysis
- 12.1.5 Alexandra Farms
- 12.1.5.1. Company Overview
- 12.1.5.2. Products
- 12.1.5.3. Company Financials
- 12.1.5.4. SWOT Analysis
- 12.1.6 Esmeralda Farms
- 12.1.6.1. Company Overview
- 12.1.6.2. Products
- 12.1.6.3. Company Financials
- 12.1.6.4. SWOT Analysis
- 12.1.7 Jet Fresh Flower Growers
- 12.1.7.1. Company Overview
- 12.1.7.2. Products
- 12.1.7.3. Company Financials
- 12.1.7.4. SWOT Analysis
- 12.1.8 Soho Rose Farm
- 12.1.8.1. Company Overview
- 12.1.8.2. Products
- 12.1.8.3. Company Financials
- 12.1.8.4. SWOT Analysis
- 12.1.9 Subati Group
- 12.1.9.1. Company Overview
- 12.1.9.2. Products
- 12.1.9.3. Company Financials
- 12.1.9.4. SWOT Analysis
- 12.1.10 Rio Roses
- 12.1.10.1. Company Overview
- 12.1.10.2. Products
- 12.1.10.3. Company Financials
- 12.1.10.4. SWOT Analysis
- 12.1.11 Royal Flowers
- 12.1.11.1. Company Overview
- 12.1.11.2. Products
- 12.1.11.3. Company Financials
- 12.1.11.4. SWOT Analysis
- 12.1.12 Virgin Farms
- 12.1.12.1. Company Overview
- 12.1.12.2. Products
- 12.1.12.3. Company Financials
- 12.1.12.4. SWOT Analysis
- 12.1.13 Pajarosa Floral
- 12.1.13.1. Company Overview
- 12.1.13.2. Products
- 12.1.13.3. Company Financials
- 12.1.13.4. SWOT Analysis
- 12.1.1 Rosa Plaza
- 12.2. Market Entropy
- 12.2.1 Company's Key Areas Served
- 12.2.2 Recent Developments
- 12.3. Company Market Share Analysis 2025
- 12.3.1 Top 5 Companies Market Share Analysis
- 12.3.2 Top 3 Companies Market Share Analysis
- 12.4. List of Potential Customers
- 13. Research Methodology
List of Figures
- Figure 1: Global rose Revenue Breakdown (billion, %) by Region 2025 & 2033
- Figure 2: Global rose Volume Breakdown (K, %) by Region 2025 & 2033
- Figure 3: North America rose Revenue (billion), by Application 2025 & 2033
- Figure 4: North America rose Volume (K), by Application 2025 & 2033
- Figure 5: North America rose Revenue Share (%), by Application 2025 & 2033
- Figure 6: North America rose Volume Share (%), by Application 2025 & 2033
- Figure 7: North America rose Revenue (billion), by Types 2025 & 2033
- Figure 8: North America rose Volume (K), by Types 2025 & 2033
- Figure 9: North America rose Revenue Share (%), by Types 2025 & 2033
- Figure 10: North America rose Volume Share (%), by Types 2025 & 2033
- Figure 11: North America rose Revenue (billion), by Country 2025 & 2033
- Figure 12: North America rose Volume (K), by Country 2025 & 2033
- Figure 13: North America rose Revenue Share (%), by Country 2025 & 2033
- Figure 14: North America rose Volume Share (%), by Country 2025 & 2033
- Figure 15: South America rose Revenue (billion), by Application 2025 & 2033
- Figure 16: South America rose Volume (K), by Application 2025 & 2033
- Figure 17: South America rose Revenue Share (%), by Application 2025 & 2033
- Figure 18: South America rose Volume Share (%), by Application 2025 & 2033
- Figure 19: South America rose Revenue (billion), by Types 2025 & 2033
- Figure 20: South America rose Volume (K), by Types 2025 & 2033
- Figure 21: South America rose Revenue Share (%), by Types 2025 & 2033
- Figure 22: South America rose Volume Share (%), by Types 2025 & 2033
- Figure 23: South America rose Revenue (billion), by Country 2025 & 2033
- Figure 24: South America rose Volume (K), by Country 2025 & 2033
- Figure 25: South America rose Revenue Share (%), by Country 2025 & 2033
- Figure 26: South America rose Volume Share (%), by Country 2025 & 2033
- Figure 27: Europe rose Revenue (billion), by Application 2025 & 2033
- Figure 28: Europe rose Volume (K), by Application 2025 & 2033
- Figure 29: Europe rose Revenue Share (%), by Application 2025 & 2033
- Figure 30: Europe rose Volume Share (%), by Application 2025 & 2033
- Figure 31: Europe rose Revenue (billion), by Types 2025 & 2033
- Figure 32: Europe rose Volume (K), by Types 2025 & 2033
- Figure 33: Europe rose Revenue Share (%), by Types 2025 & 2033
- Figure 34: Europe rose Volume Share (%), by Types 2025 & 2033
- Figure 35: Europe rose Revenue (billion), by Country 2025 & 2033
- Figure 36: Europe rose Volume (K), by Country 2025 & 2033
- Figure 37: Europe rose Revenue Share (%), by Country 2025 & 2033
- Figure 38: Europe rose Volume Share (%), by Country 2025 & 2033
- Figure 39: Middle East & Africa rose Revenue (billion), by Application 2025 & 2033
- Figure 40: Middle East & Africa rose Volume (K), by Application 2025 & 2033
- Figure 41: Middle East & Africa rose Revenue Share (%), by Application 2025 & 2033
- Figure 42: Middle East & Africa rose Volume Share (%), by Application 2025 & 2033
- Figure 43: Middle East & Africa rose Revenue (billion), by Types 2025 & 2033
- Figure 44: Middle East & Africa rose Volume (K), by Types 2025 & 2033
- Figure 45: Middle East & Africa rose Revenue Share (%), by Types 2025 & 2033
- Figure 46: Middle East & Africa rose Volume Share (%), by Types 2025 & 2033
- Figure 47: Middle East & Africa rose Revenue (billion), by Country 2025 & 2033
- Figure 48: Middle East & Africa rose Volume (K), by Country 2025 & 2033
- Figure 49: Middle East & Africa rose Revenue Share (%), by Country 2025 & 2033
- Figure 50: Middle East & Africa rose Volume Share (%), by Country 2025 & 2033
- Figure 51: Asia Pacific rose Revenue (billion), by Application 2025 & 2033
- Figure 52: Asia Pacific rose Volume (K), by Application 2025 & 2033
- Figure 53: Asia Pacific rose Revenue Share (%), by Application 2025 & 2033
- Figure 54: Asia Pacific rose Volume Share (%), by Application 2025 & 2033
- Figure 55: Asia Pacific rose Revenue (billion), by Types 2025 & 2033
- Figure 56: Asia Pacific rose Volume (K), by Types 2025 & 2033
- Figure 57: Asia Pacific rose Revenue Share (%), by Types 2025 & 2033
- Figure 58: Asia Pacific rose Volume Share (%), by Types 2025 & 2033
- Figure 59: Asia Pacific rose Revenue (billion), by Country 2025 & 2033
- Figure 60: Asia Pacific rose Volume (K), by Country 2025 & 2033
- Figure 61: Asia Pacific rose Revenue Share (%), by Country 2025 & 2033
- Figure 62: Asia Pacific rose Volume Share (%), by Country 2025 & 2033
List of Tables
- Table 1: Global rose Revenue billion Forecast, by Application 2020 & 2033
- Table 2: Global rose Volume K Forecast, by Application 2020 & 2033
- Table 3: Global rose Revenue billion Forecast, by Types 2020 & 2033
- Table 4: Global rose Volume K Forecast, by Types 2020 & 2033
- Table 5: Global rose Revenue billion Forecast, by Region 2020 & 2033
- Table 6: Global rose Volume K Forecast, by Region 2020 & 2033
- Table 7: Global rose Revenue billion Forecast, by Application 2020 & 2033
- Table 8: Global rose Volume K Forecast, by Application 2020 & 2033
- Table 9: Global rose Revenue billion Forecast, by Types 2020 & 2033
- Table 10: Global rose Volume K Forecast, by Types 2020 & 2033
- Table 11: Global rose Revenue billion Forecast, by Country 2020 & 2033
- Table 12: Global rose Volume K Forecast, by Country 2020 & 2033
- Table 13: United States rose Revenue (billion) Forecast, by Application 2020 & 2033
- Table 14: United States rose Volume (K) Forecast, by Application 2020 & 2033
- Table 15: Canada rose Revenue (billion) Forecast, by Application 2020 & 2033
- Table 16: Canada rose Volume (K) Forecast, by Application 2020 & 2033
- Table 17: Mexico rose Revenue (billion) Forecast, by Application 2020 & 2033
- Table 18: Mexico rose Volume (K) Forecast, by Application 2020 & 2033
- Table 19: Global rose Revenue billion Forecast, by Application 2020 & 2033
- Table 20: Global rose Volume K Forecast, by Application 2020 & 2033
- Table 21: Global rose Revenue billion Forecast, by Types 2020 & 2033
- Table 22: Global rose Volume K Forecast, by Types 2020 & 2033
- Table 23: Global rose Revenue billion Forecast, by Country 2020 & 2033
- Table 24: Global rose Volume K Forecast, by Country 2020 & 2033
- Table 25: Brazil rose Revenue (billion) Forecast, by Application 2020 & 2033
- Table 26: Brazil rose Volume (K) Forecast, by Application 2020 & 2033
- Table 27: Argentina rose Revenue (billion) Forecast, by Application 2020 & 2033
- Table 28: Argentina rose Volume (K) Forecast, by Application 2020 & 2033
- Table 29: Rest of South America rose Revenue (billion) Forecast, by Application 2020 & 2033
- Table 30: Rest of South America rose Volume (K) Forecast, by Application 2020 & 2033
- Table 31: Global rose Revenue billion Forecast, by Application 2020 & 2033
- Table 32: Global rose Volume K Forecast, by Application 2020 & 2033
- Table 33: Global rose Revenue billion Forecast, by Types 2020 & 2033
- Table 34: Global rose Volume K Forecast, by Types 2020 & 2033
- Table 35: Global rose Revenue billion Forecast, by Country 2020 & 2033
- Table 36: Global rose Volume K Forecast, by Country 2020 & 2033
- Table 37: United Kingdom rose Revenue (billion) Forecast, by Application 2020 & 2033
- Table 38: United Kingdom rose Volume (K) Forecast, by Application 2020 & 2033
- Table 39: Germany rose Revenue (billion) Forecast, by Application 2020 & 2033
- Table 40: Germany rose Volume (K) Forecast, by Application 2020 & 2033
- Table 41: France rose Revenue (billion) Forecast, by Application 2020 & 2033
- Table 42: France rose Volume (K) Forecast, by Application 2020 & 2033
- Table 43: Italy rose Revenue (billion) Forecast, by Application 2020 & 2033
- Table 44: Italy rose Volume (K) Forecast, by Application 2020 & 2033
- Table 45: Spain rose Revenue (billion) Forecast, by Application 2020 & 2033
- Table 46: Spain rose Volume (K) Forecast, by Application 2020 & 2033
- Table 47: Russia rose Revenue (billion) Forecast, by Application 2020 & 2033
- Table 48: Russia rose Volume (K) Forecast, by Application 2020 & 2033
- Table 49: Benelux rose Revenue (billion) Forecast, by Application 2020 & 2033
- Table 50: Benelux rose Volume (K) Forecast, by Application 2020 & 2033
- Table 51: Nordics rose Revenue (billion) Forecast, by Application 2020 & 2033
- Table 52: Nordics rose Volume (K) Forecast, by Application 2020 & 2033
- Table 53: Rest of Europe rose Revenue (billion) Forecast, by Application 2020 & 2033
- Table 54: Rest of Europe rose Volume (K) Forecast, by Application 2020 & 2033
- Table 55: Global rose Revenue billion Forecast, by Application 2020 & 2033
- Table 56: Global rose Volume K Forecast, by Application 2020 & 2033
- Table 57: Global rose Revenue billion Forecast, by Types 2020 & 2033
- Table 58: Global rose Volume K Forecast, by Types 2020 & 2033
- Table 59: Global rose Revenue billion Forecast, by Country 2020 & 2033
- Table 60: Global rose Volume K Forecast, by Country 2020 & 2033
- Table 61: Turkey rose Revenue (billion) Forecast, by Application 2020 & 2033
- Table 62: Turkey rose Volume (K) Forecast, by Application 2020 & 2033
- Table 63: Israel rose Revenue (billion) Forecast, by Application 2020 & 2033
- Table 64: Israel rose Volume (K) Forecast, by Application 2020 & 2033
- Table 65: GCC rose Revenue (billion) Forecast, by Application 2020 & 2033
- Table 66: GCC rose Volume (K) Forecast, by Application 2020 & 2033
- Table 67: North Africa rose Revenue (billion) Forecast, by Application 2020 & 2033
- Table 68: North Africa rose Volume (K) Forecast, by Application 2020 & 2033
- Table 69: South Africa rose Revenue (billion) Forecast, by Application 2020 & 2033
- Table 70: South Africa rose Volume (K) Forecast, by Application 2020 & 2033
- Table 71: Rest of Middle East & Africa rose Revenue (billion) Forecast, by Application 2020 & 2033
- Table 72: Rest of Middle East & Africa rose Volume (K) Forecast, by Application 2020 & 2033
- Table 73: Global rose Revenue billion Forecast, by Application 2020 & 2033
- Table 74: Global rose Volume K Forecast, by Application 2020 & 2033
- Table 75: Global rose Revenue billion Forecast, by Types 2020 & 2033
- Table 76: Global rose Volume K Forecast, by Types 2020 & 2033
- Table 77: Global rose Revenue billion Forecast, by Country 2020 & 2033
- Table 78: Global rose Volume K Forecast, by Country 2020 & 2033
- Table 79: China rose Revenue (billion) Forecast, by Application 2020 & 2033
- Table 80: China rose Volume (K) Forecast, by Application 2020 & 2033
- Table 81: India rose Revenue (billion) Forecast, by Application 2020 & 2033
- Table 82: India rose Volume (K) Forecast, by Application 2020 & 2033
- Table 83: Japan rose Revenue (billion) Forecast, by Application 2020 & 2033
- Table 84: Japan rose Volume (K) Forecast, by Application 2020 & 2033
- Table 85: South Korea rose Revenue (billion) Forecast, by Application 2020 & 2033
- Table 86: South Korea rose Volume (K) Forecast, by Application 2020 & 2033
- Table 87: ASEAN rose Revenue (billion) Forecast, by Application 2020 & 2033
- Table 88: ASEAN rose Volume (K) Forecast, by Application 2020 & 2033
- Table 89: Oceania rose Revenue (billion) Forecast, by Application 2020 & 2033
- Table 90: Oceania rose Volume (K) Forecast, by Application 2020 & 2033
- Table 91: Rest of Asia Pacific rose Revenue (billion) Forecast, by Application 2020 & 2033
- Table 92: Rest of Asia Pacific rose Volume (K) Forecast, by Application 2020 & 2033
Frequently Asked Questions
1. What is the projected Compound Annual Growth Rate (CAGR) of the rose?
The projected CAGR is approximately 5.62%.
2. Which companies are prominent players in the rose?
Key companies in the market include Rosa Plaza, Rose Story Farm, Parfum Flower Company, Van Lier Nurseries, Alexandra Farms, Esmeralda Farms, Jet Fresh Flower Growers, Soho Rose Farm, Subati Group, Rio Roses, Royal Flowers, Virgin Farms, Pajarosa Floral.
3. What are the main segments of the rose?
The market segments include Application, Types.
4. Can you provide details about the market size?
The market size is estimated to be USD 2.2 billion as of 2022.
5. What are some drivers contributing to market growth?
N/A
6. What are the notable trends driving market growth?
N/A
7. Are there any restraints impacting market growth?
N/A
8. Can you provide examples of recent developments in the market?
N/A
9. What pricing options are available for accessing the report?
Pricing options include single-user, multi-user, and enterprise licenses priced at USD 4350.00, USD 6525.00, and USD 8700.00 respectively.
10. Is the market size provided in terms of value or volume?
The market size is provided in terms of value, measured in billion and volume, measured in K.
11. Are there any specific market keywords associated with the report?
Yes, the market keyword associated with the report is "rose," which aids in identifying and referencing the specific market segment covered.
12. How do I determine which pricing option suits my needs best?
The pricing options vary based on user requirements and access needs. Individual users may opt for single-user licenses, while businesses requiring broader access may choose multi-user or enterprise licenses for cost-effective access to the report.
13. Are there any additional resources or data provided in the rose report?
While the report offers comprehensive insights, it's advisable to review the specific contents or supplementary materials provided to ascertain if additional resources or data are available.
14. How can I stay updated on further developments or reports in the rose?
To stay informed about further developments, trends, and reports in the rose, consider subscribing to industry newsletters, following relevant companies and organizations, or regularly checking reputable industry news sources and publications.
Methodology
Step 1 - Identification of Relevant Samples Size from Population Database


Step 2 - Approaches for Defining Global Market Size (Value, Volume* & Price*)

Note*: In applicable scenarios
Step 3 - Data Sources
Primary Research
- Web Analytics
- Survey Reports
- Research Institute
- Latest Research Reports
- Opinion Leaders
Secondary Research
- Annual Reports
- White Paper
- Latest Press Release
- Industry Association
- Paid Database
- Investor Presentations

Step 4 - Data Triangulation
Involves using different sources of information in order to increase the validity of a study
These sources are likely to be stakeholders in a program - participants, other researchers, program staff, other community members, and so on.
Then we put all data in single framework & apply various statistical tools to find out the dynamic on the market.
During the analysis stage, feedback from the stakeholder groups would be compared to determine areas of agreement as well as areas of divergence