

Key Insights
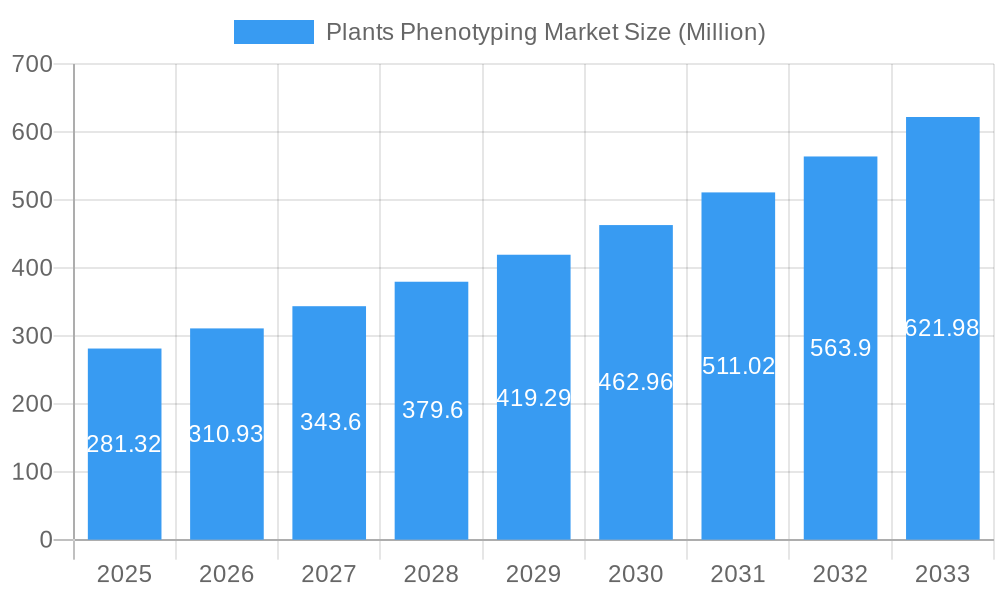
The global plants phenotyping market is experiencing robust growth, projected to reach \$281.32 million in 2025 and maintain a Compound Annual Growth Rate (CAGR) of 10.50% from 2025 to 2033. This expansion is driven by several key factors. The increasing demand for high-throughput screening in agricultural research and the need for efficient crop improvement are major contributors. Advancements in imaging technologies, such as multispectral cameras and image analysis systems, are enabling more precise and detailed phenotyping, leading to faster breeding cycles and improved crop yields. Furthermore, the growing adoption of automation in phenotyping, encompassing automated data acquisition and analysis, is streamlining workflows and reducing manual labor. The market is segmented by various factors, including software solutions (sensors and data analysis), hardware (equipment like fluorometers and canopy analysis systems), automation type (manual to fully automated), application (high-throughput screening, trait identification, etc.), analysis system, location (laboratory, greenhouse, field), and platform (conveyor-based, handheld, drone-based). The diverse applications of plants phenotyping, from basic research to commercial crop development, fuel market growth across various regions.
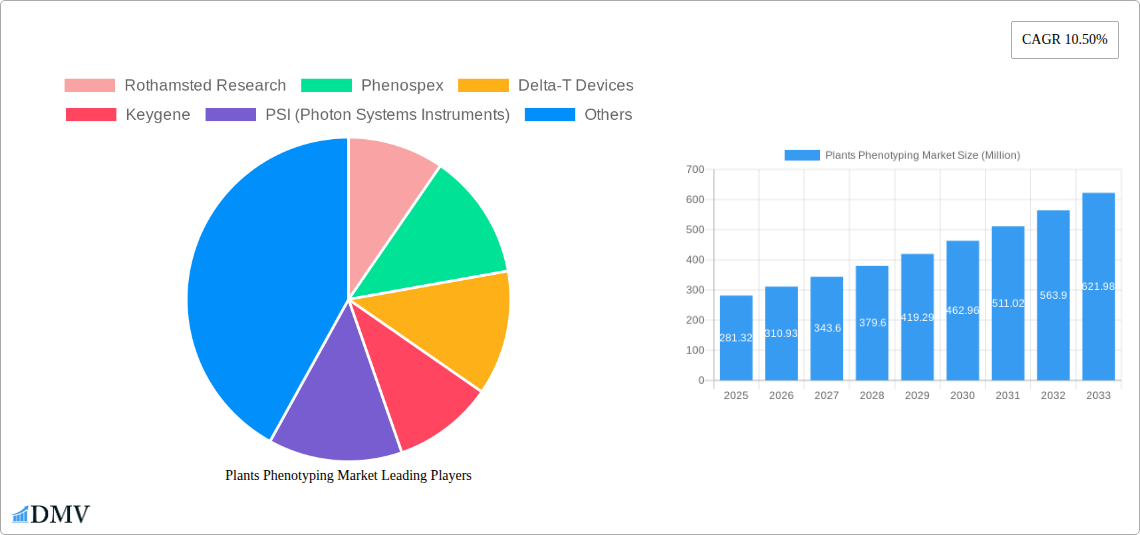
Plants Phenotyping Market Market Size (In Million)
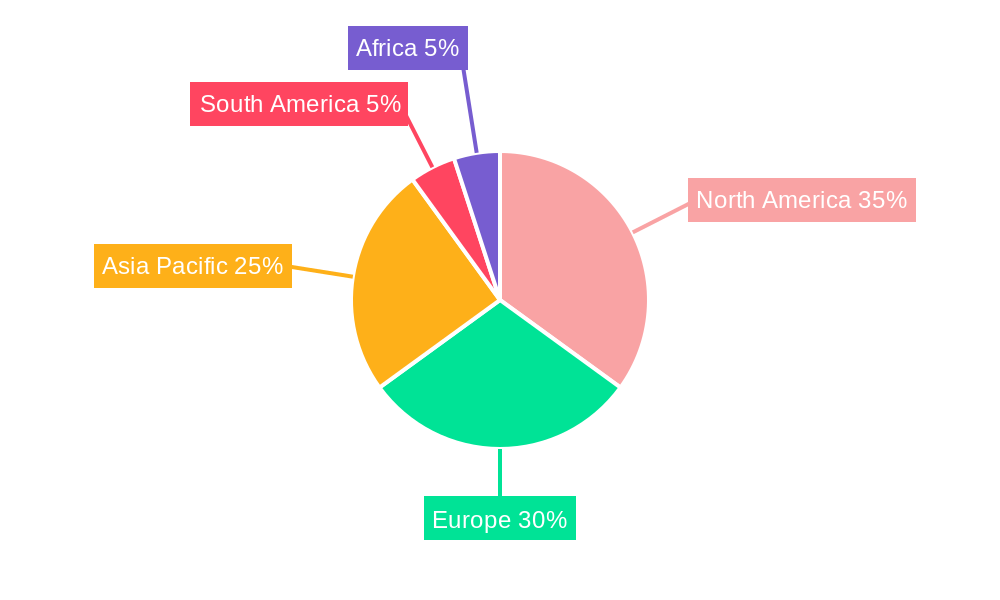
North America and Europe currently hold significant market shares, driven by strong research infrastructure and technological advancements. However, the Asia-Pacific region is expected to witness substantial growth in the coming years, fueled by increasing agricultural production and investment in agricultural technology. The market faces some restraints, including the high initial investment costs of advanced phenotyping equipment and the need for specialized expertise in data analysis. However, the long-term benefits of improved crop yields and reduced development time are expected to outweigh these challenges, continuing the market’s upward trajectory. Companies like Rothamsted Research, Phenospex, and LemnaTec GmbH are key players contributing to innovation and market expansion through their diverse product and service offerings. The market's future growth hinges on continued technological innovation, particularly in areas like artificial intelligence (AI) and machine learning for advanced data analysis and the development of more cost-effective and user-friendly phenotyping systems.
Plants Phenotyping Market Company Market Share
Plants Phenotyping Market: A Comprehensive Report (2019-2033)
This insightful report provides a comprehensive analysis of the Plants Phenotyping Market, encompassing market size, segmentation, leading players, technological advancements, and future growth prospects. The study period covers 2019-2033, with 2025 as the base and estimated year, and a forecast period of 2025-2033. The historical period analyzed is 2019-2024. This report is crucial for stakeholders seeking to understand the dynamics of this rapidly evolving market and make informed business decisions. The market is projected to reach xx Million by 2033.
Plants Phenotyping Market Market Composition & Trends
The Plants Phenotyping market is characterized by a moderately fragmented competitive landscape, with key players including Rothamsted Research, Phenospex, Delta-T Devices, Keygene, PSI (Photon Systems Instruments), BASF SE (Crop Design), Heinz Walz GmbH, The Vienna Biocenter Core Facilities, LemnaTec GmbH, Phenomix, WP, and Qubit Systems. Market share distribution varies significantly across segments, with equipment and software solutions holding the largest shares. Innovation is driven by advancements in sensor technology, data analytics, and automation. Stringent regulatory frameworks concerning data privacy and environmental impact influence market growth. Substitute products, such as traditional manual phenotyping methods, pose a challenge to market expansion but their limitations in efficiency and scalability are progressively making them less competitive. End-users primarily comprise agricultural research institutions, biotechnology companies, and large-scale farming operations. M&A activity has been moderate, with deal values ranging from xx Million to xx Million in recent years, primarily focused on consolidating technological capabilities and expanding market reach.
- Market Concentration: Moderately fragmented.
- Innovation Catalysts: Advancements in sensor technology, AI-driven data analytics.
- Regulatory Landscape: Stringent data privacy and environmental regulations.
- Substitute Products: Traditional manual phenotyping methods.
- End-User Profiles: Research institutions, biotech companies, large-scale farms.
- M&A Activity: Moderate, with deal values ranging from xx Million to xx Million.
Plants Phenotyping Market Industry Evolution
The Plants Phenotyping market has witnessed substantial growth fueled by increasing demand for high-throughput screening and precision agriculture. Technological advancements, such as the integration of AI and machine learning for data analysis, have significantly improved the efficiency and accuracy of phenotyping processes. The market has seen a shift from manual and semi-automated systems towards fully automated high-throughput solutions, driven by the need for increased speed and scalability. Consumer demand for improved crop yields, enhanced disease resistance, and climate-resilient varieties is fueling market growth. The market grew at a CAGR of xx% during the historical period (2019-2024) and is projected to grow at a CAGR of xx% during the forecast period (2025-2033). Adoption rates of automated systems have increased significantly, with an estimated xx% of the market utilizing fully automated systems by 2025.
Leading Regions, Countries, or Segments in Plants Phenotyping Market
The North American region currently dominates the Plants Phenotyping market, driven by substantial investments in agricultural research and technological advancements. Europe and Asia-Pacific are also experiencing significant growth, fueled by increasing adoption of precision agriculture techniques. Within market segments, the equipment segment holds the largest market share, followed by services (Measurement Acquisition & Data Analysis, Statistical Analysis) and software solutions. Fully automated systems are witnessing the highest growth rate among automation types. High-throughput screening and trait identification are the leading applications. Image analysis systems and multispectral scientific cameras dominate the analysis system segment. Field-based phenotyping is growing at a rapid pace.
- Key Drivers:
- Substantial investments in agricultural research (North America).
- Increasing adoption of precision agriculture (Europe and Asia-Pacific).
- Government initiatives promoting technological advancements.
- Dominance Factors:
- High demand for high-throughput screening and precision agriculture.
- Advanced infrastructure and research capabilities in leading regions.
- Favorable regulatory environment.
Plants Phenotyping Market Product Innovations
Recent innovations focus on miniaturization, improved sensor accuracy, and advanced data analytics capabilities. New products incorporate AI and machine learning algorithms for automated data processing and interpretation. Unique selling propositions include increased throughput, reduced analysis time, and enhanced data accuracy. Advancements in hyperspectral imaging and 3D scanning technologies are providing richer datasets for more in-depth plant analysis.
Propelling Factors for Plants Phenotyping Market Growth
Technological advancements in sensors, data analytics, and automation are key drivers. Increasing demand for higher crop yields and improved food security is also crucial. Government initiatives and funding programs supporting agricultural research and development stimulate market growth. The rising adoption of precision agriculture practices globally is fueling market expansion.
Obstacles in the Plants Phenotyping Market Market
High initial investment costs for equipment and software can hinder adoption, particularly among smaller farms. The complexity of data analysis and interpretation can pose a challenge for some users. Supply chain disruptions impacting the availability of crucial components can restrict market growth. Intense competition among established players and new entrants can put pressure on profit margins.
Future Opportunities in Plants Phenotyping Market
Expansion into new geographical markets with growing agricultural sectors presents significant opportunities. The integration of drones and other unmanned aerial vehicles for large-scale phenotyping offers considerable potential. Development of user-friendly software solutions and improved data visualization tools can broaden market reach. The increasing focus on sustainable agriculture will drive demand for environmentally friendly phenotyping technologies.
Major Players in the Plants Phenotyping Market Ecosystem
- Rothamsted Research
- Phenospex
- Delta-T Devices
- Keygene
- PSI (Photon Systems Instruments)
- BASF SE (Crop Design)
- Heinz Walz GmbH
- The Vienna Biocenter Core Facilities
- LemnaTec GmbH
- Phenomix
- WP
- Qubit Systems
Key Developments in Plants Phenotyping Market Industry
- 2023-03: LemnaTec GmbH launched a new high-throughput phenotyping system.
- 2022-11: Phenospex announced a strategic partnership with a major agricultural company.
- 2022-08: Delta-T Devices released upgraded software with AI-powered data analysis capabilities.
- 2021-05: PSI (Photon Systems Instruments) acquired a smaller sensor technology company. (Further details on acquisitions would require additional data)
Strategic Plants Phenotyping Market Market Forecast
The Plants Phenotyping market is poised for robust growth, driven by ongoing technological advancements, increasing demand for efficient crop improvement, and the global push towards sustainable agriculture. Future opportunities lie in the development of more sophisticated sensor technologies, improved data analytics capabilities, and the integration of AI and machine learning for automated plant characterization. Expansion into emerging markets and the adoption of innovative phenotyping platforms will further drive market growth.
Plants Phenotyping Market Segmentation
- 1. Production Analysis
- 2. Consumption Analysis
- 3. Import Market Analysis (Value & Volume)
- 4. Export Market Analysis (Value & Volume)
- 5. Price Trend Analysis
Plants Phenotyping Market Segmentation By Geography
-
1. North America
- 1.1. United States
- 1.2. Canada
- 1.3. Mexico
-
2. South America
- 2.1. Brazil
- 2.2. Argentina
- 2.3. Rest of South America
-
3. Europe
- 3.1. United Kingdom
- 3.2. Germany
- 3.3. France
- 3.4. Italy
- 3.5. Spain
- 3.6. Russia
- 3.7. Benelux
- 3.8. Nordics
- 3.9. Rest of Europe
-
4. Middle East & Africa
- 4.1. Turkey
- 4.2. Israel
- 4.3. GCC
- 4.4. North Africa
- 4.5. South Africa
- 4.6. Rest of Middle East & Africa
-
5. Asia Pacific
- 5.1. China
- 5.2. India
- 5.3. Japan
- 5.4. South Korea
- 5.5. ASEAN
- 5.6. Oceania
- 5.7. Rest of Asia Pacific
Plants Phenotyping Market Regional Market Share
Geographic Coverage of Plants Phenotyping Market
Plants Phenotyping Market REPORT HIGHLIGHTS
| Aspects | Details |
|---|---|
| Study Period | 2020-2034 |
| Base Year | 2025 |
| Estimated Year | 2026 |
| Forecast Period | 2026-2034 |
| Historical Period | 2020-2025 |
| Growth Rate | CAGR of 10.50% from 2020-2034 |
| Segmentation |
|
Table of Contents
- 1. Introduction
- 1.1. Research Scope
- 1.2. Market Segmentation
- 1.3. Research Objective
- 1.4. Definitions and Assumptions
- 2. Executive Summary
- 2.1. Market Snapshot
- 3. Market Dynamics
- 3.1. Market Drivers
- 3.2. Market Restrains
- 3.3. Market Trends
- 3.4. Market Opportunities
- 4. Market Factor Analysis
- 4.1. Porters Five Forces
- 4.1.1. Bargaining Power of Suppliers
- 4.1.2. Bargaining Power of Buyers
- 4.1.3. Threat of New Entrants
- 4.1.4. Threat of Substitutes
- 4.1.5. Competitive Rivalry
- 4.2. PESTEL analysis
- 4.3. BCG Analysis
- 4.3.1. Stars (High Growth, High Market Share)
- 4.3.2. Cash Cows (Low Growth, High Market Share)
- 4.3.3. Question Mark (High Growth, Low Market Share)
- 4.3.4. Dogs (Low Growth, Low Market Share)
- 4.4. Ansoff Matrix Analysis
- 4.5. Supply Chain Analysis
- 4.6. Regulatory Landscape
- 4.7. Current Market Potential and Opportunity Assessment (TAM–SAM–SOM Framework)
- 4.8. DMV Analyst Note
- 4.1. Porters Five Forces
- 5. Market Analysis, Insights and Forecast 2021-2033
- 5.1. Market Analysis, Insights and Forecast - by Production Analysis
- 5.2. Market Analysis, Insights and Forecast - by Consumption Analysis
- 5.3. Market Analysis, Insights and Forecast - by Import Market Analysis (Value & Volume)
- 5.4. Market Analysis, Insights and Forecast - by Export Market Analysis (Value & Volume)
- 5.5. Market Analysis, Insights and Forecast - by Price Trend Analysis
- 5.6. Market Analysis, Insights and Forecast - by Region
- 5.6.1. North America
- 5.6.2. South America
- 5.6.3. Europe
- 5.6.4. Middle East & Africa
- 5.6.5. Asia Pacific
- 6. Global Plants Phenotyping Market Analysis, Insights and Forecast, 2021-2033
- 6.1. Market Analysis, Insights and Forecast - by Production Analysis
- 6.2. Market Analysis, Insights and Forecast - by Consumption Analysis
- 6.3. Market Analysis, Insights and Forecast - by Import Market Analysis (Value & Volume)
- 6.4. Market Analysis, Insights and Forecast - by Export Market Analysis (Value & Volume)
- 6.5. Market Analysis, Insights and Forecast - by Price Trend Analysis
- 7. North America Plants Phenotyping Market Analysis, Insights and Forecast, 2020-2032
- 7.1. Market Analysis, Insights and Forecast - by Production Analysis
- 7.2. Market Analysis, Insights and Forecast - by Consumption Analysis
- 7.3. Market Analysis, Insights and Forecast - by Import Market Analysis (Value & Volume)
- 7.4. Market Analysis, Insights and Forecast - by Export Market Analysis (Value & Volume)
- 7.5. Market Analysis, Insights and Forecast - by Price Trend Analysis
- 8. South America Plants Phenotyping Market Analysis, Insights and Forecast, 2020-2032
- 8.1. Market Analysis, Insights and Forecast - by Production Analysis
- 8.2. Market Analysis, Insights and Forecast - by Consumption Analysis
- 8.3. Market Analysis, Insights and Forecast - by Import Market Analysis (Value & Volume)
- 8.4. Market Analysis, Insights and Forecast - by Export Market Analysis (Value & Volume)
- 8.5. Market Analysis, Insights and Forecast - by Price Trend Analysis
- 9. Europe Plants Phenotyping Market Analysis, Insights and Forecast, 2020-2032
- 9.1. Market Analysis, Insights and Forecast - by Production Analysis
- 9.2. Market Analysis, Insights and Forecast - by Consumption Analysis
- 9.3. Market Analysis, Insights and Forecast - by Import Market Analysis (Value & Volume)
- 9.4. Market Analysis, Insights and Forecast - by Export Market Analysis (Value & Volume)
- 9.5. Market Analysis, Insights and Forecast - by Price Trend Analysis
- 10. Middle East & Africa Plants Phenotyping Market Analysis, Insights and Forecast, 2020-2032
- 10.1. Market Analysis, Insights and Forecast - by Production Analysis
- 10.2. Market Analysis, Insights and Forecast - by Consumption Analysis
- 10.3. Market Analysis, Insights and Forecast - by Import Market Analysis (Value & Volume)
- 10.4. Market Analysis, Insights and Forecast - by Export Market Analysis (Value & Volume)
- 10.5. Market Analysis, Insights and Forecast - by Price Trend Analysis
- 11. Asia Pacific Plants Phenotyping Market Analysis, Insights and Forecast, 2020-2032
- 11.1. Market Analysis, Insights and Forecast - by Production Analysis
- 11.2. Market Analysis, Insights and Forecast - by Consumption Analysis
- 11.3. Market Analysis, Insights and Forecast - by Import Market Analysis (Value & Volume)
- 11.4. Market Analysis, Insights and Forecast - by Export Market Analysis (Value & Volume)
- 11.5. Market Analysis, Insights and Forecast - by Price Trend Analysis
- 12. Competitive Analysis
- 12.1. Company Profiles
- 12.1.1 Rothamsted Research
- 12.1.1.1. Company Overview
- 12.1.1.2. Products
- 12.1.1.3. Company Financials
- 12.1.1.4. SWOT Analysis
- 12.1.2 Phenospex
- 12.1.2.1. Company Overview
- 12.1.2.2. Products
- 12.1.2.3. Company Financials
- 12.1.2.4. SWOT Analysis
- 12.1.3 Delta-T Devices
- 12.1.3.1. Company Overview
- 12.1.3.2. Products
- 12.1.3.3. Company Financials
- 12.1.3.4. SWOT Analysis
- 12.1.4 Keygene
- 12.1.4.1. Company Overview
- 12.1.4.2. Products
- 12.1.4.3. Company Financials
- 12.1.4.4. SWOT Analysis
- 12.1.5 PSI (Photon Systems Instruments)
- 12.1.5.1. Company Overview
- 12.1.5.2. Products
- 12.1.5.3. Company Financials
- 12.1.5.4. SWOT Analysis
- 12.1.6 BASF SE (Crop Design)
- 12.1.6.1. Company Overview
- 12.1.6.2. Products
- 12.1.6.3. Company Financials
- 12.1.6.4. SWOT Analysis
- 12.1.7 Heinz Walz GmbH
- 12.1.7.1. Company Overview
- 12.1.7.2. Products
- 12.1.7.3. Company Financials
- 12.1.7.4. SWOT Analysis
- 12.1.8 The Vienna Biocenter Core Facilities
- 12.1.8.1. Company Overview
- 12.1.8.2. Products
- 12.1.8.3. Company Financials
- 12.1.8.4. SWOT Analysis
- 12.1.9 LemnaTec GmbH
- 12.1.9.1. Company Overview
- 12.1.9.2. Products
- 12.1.9.3. Company Financials
- 12.1.9.4. SWOT Analysis
- 12.1.10 Phenomix
- 12.1.10.1. Company Overview
- 12.1.10.2. Products
- 12.1.10.3. Company Financials
- 12.1.10.4. SWOT Analysis
- 12.1.11 WP
- 12.1.11.1. Company Overview
- 12.1.11.2. Products
- 12.1.11.3. Company Financials
- 12.1.11.4. SWOT Analysis
- 12.1.12 Qubit Systems
- 12.1.12.1. Company Overview
- 12.1.12.2. Products
- 12.1.12.3. Company Financials
- 12.1.12.4. SWOT Analysis
- 12.1.1 Rothamsted Research
- 12.2. Market Entropy
- 12.2.1 Company's Key Areas Served
- 12.2.2 Recent Developments
- 12.3. Company Market Share Analysis 2025
- 12.3.1 Top 5 Companies Market Share Analysis
- 12.3.2 Top 3 Companies Market Share Analysis
- 12.4. List of Potential Customers
- 13. Research Methodology
List of Figures
- Figure 1: Global Plants Phenotyping Market Revenue Breakdown (Million, %) by Region 2025 & 2033
- Figure 2: North America Plants Phenotyping Market Revenue (Million), by Production Analysis 2025 & 2033
- Figure 3: North America Plants Phenotyping Market Revenue Share (%), by Production Analysis 2025 & 2033
- Figure 4: North America Plants Phenotyping Market Revenue (Million), by Consumption Analysis 2025 & 2033
- Figure 5: North America Plants Phenotyping Market Revenue Share (%), by Consumption Analysis 2025 & 2033
- Figure 6: North America Plants Phenotyping Market Revenue (Million), by Import Market Analysis (Value & Volume) 2025 & 2033
- Figure 7: North America Plants Phenotyping Market Revenue Share (%), by Import Market Analysis (Value & Volume) 2025 & 2033
- Figure 8: North America Plants Phenotyping Market Revenue (Million), by Export Market Analysis (Value & Volume) 2025 & 2033
- Figure 9: North America Plants Phenotyping Market Revenue Share (%), by Export Market Analysis (Value & Volume) 2025 & 2033
- Figure 10: North America Plants Phenotyping Market Revenue (Million), by Price Trend Analysis 2025 & 2033
- Figure 11: North America Plants Phenotyping Market Revenue Share (%), by Price Trend Analysis 2025 & 2033
- Figure 12: North America Plants Phenotyping Market Revenue (Million), by Country 2025 & 2033
- Figure 13: North America Plants Phenotyping Market Revenue Share (%), by Country 2025 & 2033
- Figure 14: South America Plants Phenotyping Market Revenue (Million), by Production Analysis 2025 & 2033
- Figure 15: South America Plants Phenotyping Market Revenue Share (%), by Production Analysis 2025 & 2033
- Figure 16: South America Plants Phenotyping Market Revenue (Million), by Consumption Analysis 2025 & 2033
- Figure 17: South America Plants Phenotyping Market Revenue Share (%), by Consumption Analysis 2025 & 2033
- Figure 18: South America Plants Phenotyping Market Revenue (Million), by Import Market Analysis (Value & Volume) 2025 & 2033
- Figure 19: South America Plants Phenotyping Market Revenue Share (%), by Import Market Analysis (Value & Volume) 2025 & 2033
- Figure 20: South America Plants Phenotyping Market Revenue (Million), by Export Market Analysis (Value & Volume) 2025 & 2033
- Figure 21: South America Plants Phenotyping Market Revenue Share (%), by Export Market Analysis (Value & Volume) 2025 & 2033
- Figure 22: South America Plants Phenotyping Market Revenue (Million), by Price Trend Analysis 2025 & 2033
- Figure 23: South America Plants Phenotyping Market Revenue Share (%), by Price Trend Analysis 2025 & 2033
- Figure 24: South America Plants Phenotyping Market Revenue (Million), by Country 2025 & 2033
- Figure 25: South America Plants Phenotyping Market Revenue Share (%), by Country 2025 & 2033
- Figure 26: Europe Plants Phenotyping Market Revenue (Million), by Production Analysis 2025 & 2033
- Figure 27: Europe Plants Phenotyping Market Revenue Share (%), by Production Analysis 2025 & 2033
- Figure 28: Europe Plants Phenotyping Market Revenue (Million), by Consumption Analysis 2025 & 2033
- Figure 29: Europe Plants Phenotyping Market Revenue Share (%), by Consumption Analysis 2025 & 2033
- Figure 30: Europe Plants Phenotyping Market Revenue (Million), by Import Market Analysis (Value & Volume) 2025 & 2033
- Figure 31: Europe Plants Phenotyping Market Revenue Share (%), by Import Market Analysis (Value & Volume) 2025 & 2033
- Figure 32: Europe Plants Phenotyping Market Revenue (Million), by Export Market Analysis (Value & Volume) 2025 & 2033
- Figure 33: Europe Plants Phenotyping Market Revenue Share (%), by Export Market Analysis (Value & Volume) 2025 & 2033
- Figure 34: Europe Plants Phenotyping Market Revenue (Million), by Price Trend Analysis 2025 & 2033
- Figure 35: Europe Plants Phenotyping Market Revenue Share (%), by Price Trend Analysis 2025 & 2033
- Figure 36: Europe Plants Phenotyping Market Revenue (Million), by Country 2025 & 2033
- Figure 37: Europe Plants Phenotyping Market Revenue Share (%), by Country 2025 & 2033
- Figure 38: Middle East & Africa Plants Phenotyping Market Revenue (Million), by Production Analysis 2025 & 2033
- Figure 39: Middle East & Africa Plants Phenotyping Market Revenue Share (%), by Production Analysis 2025 & 2033
- Figure 40: Middle East & Africa Plants Phenotyping Market Revenue (Million), by Consumption Analysis 2025 & 2033
- Figure 41: Middle East & Africa Plants Phenotyping Market Revenue Share (%), by Consumption Analysis 2025 & 2033
- Figure 42: Middle East & Africa Plants Phenotyping Market Revenue (Million), by Import Market Analysis (Value & Volume) 2025 & 2033
- Figure 43: Middle East & Africa Plants Phenotyping Market Revenue Share (%), by Import Market Analysis (Value & Volume) 2025 & 2033
- Figure 44: Middle East & Africa Plants Phenotyping Market Revenue (Million), by Export Market Analysis (Value & Volume) 2025 & 2033
- Figure 45: Middle East & Africa Plants Phenotyping Market Revenue Share (%), by Export Market Analysis (Value & Volume) 2025 & 2033
- Figure 46: Middle East & Africa Plants Phenotyping Market Revenue (Million), by Price Trend Analysis 2025 & 2033
- Figure 47: Middle East & Africa Plants Phenotyping Market Revenue Share (%), by Price Trend Analysis 2025 & 2033
- Figure 48: Middle East & Africa Plants Phenotyping Market Revenue (Million), by Country 2025 & 2033
- Figure 49: Middle East & Africa Plants Phenotyping Market Revenue Share (%), by Country 2025 & 2033
- Figure 50: Asia Pacific Plants Phenotyping Market Revenue (Million), by Production Analysis 2025 & 2033
- Figure 51: Asia Pacific Plants Phenotyping Market Revenue Share (%), by Production Analysis 2025 & 2033
- Figure 52: Asia Pacific Plants Phenotyping Market Revenue (Million), by Consumption Analysis 2025 & 2033
- Figure 53: Asia Pacific Plants Phenotyping Market Revenue Share (%), by Consumption Analysis 2025 & 2033
- Figure 54: Asia Pacific Plants Phenotyping Market Revenue (Million), by Import Market Analysis (Value & Volume) 2025 & 2033
- Figure 55: Asia Pacific Plants Phenotyping Market Revenue Share (%), by Import Market Analysis (Value & Volume) 2025 & 2033
- Figure 56: Asia Pacific Plants Phenotyping Market Revenue (Million), by Export Market Analysis (Value & Volume) 2025 & 2033
- Figure 57: Asia Pacific Plants Phenotyping Market Revenue Share (%), by Export Market Analysis (Value & Volume) 2025 & 2033
- Figure 58: Asia Pacific Plants Phenotyping Market Revenue (Million), by Price Trend Analysis 2025 & 2033
- Figure 59: Asia Pacific Plants Phenotyping Market Revenue Share (%), by Price Trend Analysis 2025 & 2033
- Figure 60: Asia Pacific Plants Phenotyping Market Revenue (Million), by Country 2025 & 2033
- Figure 61: Asia Pacific Plants Phenotyping Market Revenue Share (%), by Country 2025 & 2033
List of Tables
- Table 1: Global Plants Phenotyping Market Revenue Million Forecast, by Production Analysis 2020 & 2033
- Table 2: Global Plants Phenotyping Market Revenue Million Forecast, by Consumption Analysis 2020 & 2033
- Table 3: Global Plants Phenotyping Market Revenue Million Forecast, by Import Market Analysis (Value & Volume) 2020 & 2033
- Table 4: Global Plants Phenotyping Market Revenue Million Forecast, by Export Market Analysis (Value & Volume) 2020 & 2033
- Table 5: Global Plants Phenotyping Market Revenue Million Forecast, by Price Trend Analysis 2020 & 2033
- Table 6: Global Plants Phenotyping Market Revenue Million Forecast, by Region 2020 & 2033
- Table 7: Global Plants Phenotyping Market Revenue Million Forecast, by Production Analysis 2020 & 2033
- Table 8: Global Plants Phenotyping Market Revenue Million Forecast, by Consumption Analysis 2020 & 2033
- Table 9: Global Plants Phenotyping Market Revenue Million Forecast, by Import Market Analysis (Value & Volume) 2020 & 2033
- Table 10: Global Plants Phenotyping Market Revenue Million Forecast, by Export Market Analysis (Value & Volume) 2020 & 2033
- Table 11: Global Plants Phenotyping Market Revenue Million Forecast, by Price Trend Analysis 2020 & 2033
- Table 12: Global Plants Phenotyping Market Revenue Million Forecast, by Country 2020 & 2033
- Table 13: United States Plants Phenotyping Market Revenue (Million) Forecast, by Application 2020 & 2033
- Table 14: Canada Plants Phenotyping Market Revenue (Million) Forecast, by Application 2020 & 2033
- Table 15: Mexico Plants Phenotyping Market Revenue (Million) Forecast, by Application 2020 & 2033
- Table 16: Global Plants Phenotyping Market Revenue Million Forecast, by Production Analysis 2020 & 2033
- Table 17: Global Plants Phenotyping Market Revenue Million Forecast, by Consumption Analysis 2020 & 2033
- Table 18: Global Plants Phenotyping Market Revenue Million Forecast, by Import Market Analysis (Value & Volume) 2020 & 2033
- Table 19: Global Plants Phenotyping Market Revenue Million Forecast, by Export Market Analysis (Value & Volume) 2020 & 2033
- Table 20: Global Plants Phenotyping Market Revenue Million Forecast, by Price Trend Analysis 2020 & 2033
- Table 21: Global Plants Phenotyping Market Revenue Million Forecast, by Country 2020 & 2033
- Table 22: Brazil Plants Phenotyping Market Revenue (Million) Forecast, by Application 2020 & 2033
- Table 23: Argentina Plants Phenotyping Market Revenue (Million) Forecast, by Application 2020 & 2033
- Table 24: Rest of South America Plants Phenotyping Market Revenue (Million) Forecast, by Application 2020 & 2033
- Table 25: Global Plants Phenotyping Market Revenue Million Forecast, by Production Analysis 2020 & 2033
- Table 26: Global Plants Phenotyping Market Revenue Million Forecast, by Consumption Analysis 2020 & 2033
- Table 27: Global Plants Phenotyping Market Revenue Million Forecast, by Import Market Analysis (Value & Volume) 2020 & 2033
- Table 28: Global Plants Phenotyping Market Revenue Million Forecast, by Export Market Analysis (Value & Volume) 2020 & 2033
- Table 29: Global Plants Phenotyping Market Revenue Million Forecast, by Price Trend Analysis 2020 & 2033
- Table 30: Global Plants Phenotyping Market Revenue Million Forecast, by Country 2020 & 2033
- Table 31: United Kingdom Plants Phenotyping Market Revenue (Million) Forecast, by Application 2020 & 2033
- Table 32: Germany Plants Phenotyping Market Revenue (Million) Forecast, by Application 2020 & 2033
- Table 33: France Plants Phenotyping Market Revenue (Million) Forecast, by Application 2020 & 2033
- Table 34: Italy Plants Phenotyping Market Revenue (Million) Forecast, by Application 2020 & 2033
- Table 35: Spain Plants Phenotyping Market Revenue (Million) Forecast, by Application 2020 & 2033
- Table 36: Russia Plants Phenotyping Market Revenue (Million) Forecast, by Application 2020 & 2033
- Table 37: Benelux Plants Phenotyping Market Revenue (Million) Forecast, by Application 2020 & 2033
- Table 38: Nordics Plants Phenotyping Market Revenue (Million) Forecast, by Application 2020 & 2033
- Table 39: Rest of Europe Plants Phenotyping Market Revenue (Million) Forecast, by Application 2020 & 2033
- Table 40: Global Plants Phenotyping Market Revenue Million Forecast, by Production Analysis 2020 & 2033
- Table 41: Global Plants Phenotyping Market Revenue Million Forecast, by Consumption Analysis 2020 & 2033
- Table 42: Global Plants Phenotyping Market Revenue Million Forecast, by Import Market Analysis (Value & Volume) 2020 & 2033
- Table 43: Global Plants Phenotyping Market Revenue Million Forecast, by Export Market Analysis (Value & Volume) 2020 & 2033
- Table 44: Global Plants Phenotyping Market Revenue Million Forecast, by Price Trend Analysis 2020 & 2033
- Table 45: Global Plants Phenotyping Market Revenue Million Forecast, by Country 2020 & 2033
- Table 46: Turkey Plants Phenotyping Market Revenue (Million) Forecast, by Application 2020 & 2033
- Table 47: Israel Plants Phenotyping Market Revenue (Million) Forecast, by Application 2020 & 2033
- Table 48: GCC Plants Phenotyping Market Revenue (Million) Forecast, by Application 2020 & 2033
- Table 49: North Africa Plants Phenotyping Market Revenue (Million) Forecast, by Application 2020 & 2033
- Table 50: South Africa Plants Phenotyping Market Revenue (Million) Forecast, by Application 2020 & 2033
- Table 51: Rest of Middle East & Africa Plants Phenotyping Market Revenue (Million) Forecast, by Application 2020 & 2033
- Table 52: Global Plants Phenotyping Market Revenue Million Forecast, by Production Analysis 2020 & 2033
- Table 53: Global Plants Phenotyping Market Revenue Million Forecast, by Consumption Analysis 2020 & 2033
- Table 54: Global Plants Phenotyping Market Revenue Million Forecast, by Import Market Analysis (Value & Volume) 2020 & 2033
- Table 55: Global Plants Phenotyping Market Revenue Million Forecast, by Export Market Analysis (Value & Volume) 2020 & 2033
- Table 56: Global Plants Phenotyping Market Revenue Million Forecast, by Price Trend Analysis 2020 & 2033
- Table 57: Global Plants Phenotyping Market Revenue Million Forecast, by Country 2020 & 2033
- Table 58: China Plants Phenotyping Market Revenue (Million) Forecast, by Application 2020 & 2033
- Table 59: India Plants Phenotyping Market Revenue (Million) Forecast, by Application 2020 & 2033
- Table 60: Japan Plants Phenotyping Market Revenue (Million) Forecast, by Application 2020 & 2033
- Table 61: South Korea Plants Phenotyping Market Revenue (Million) Forecast, by Application 2020 & 2033
- Table 62: ASEAN Plants Phenotyping Market Revenue (Million) Forecast, by Application 2020 & 2033
- Table 63: Oceania Plants Phenotyping Market Revenue (Million) Forecast, by Application 2020 & 2033
- Table 64: Rest of Asia Pacific Plants Phenotyping Market Revenue (Million) Forecast, by Application 2020 & 2033
Frequently Asked Questions
1. What is the projected Compound Annual Growth Rate (CAGR) of the Plants Phenotyping Market?
The projected CAGR is approximately 10.50%.
2. Which companies are prominent players in the Plants Phenotyping Market?
Key companies in the market include Rothamsted Research, Phenospex, Delta-T Devices, Keygene, PSI (Photon Systems Instruments), BASF SE (Crop Design), Heinz Walz GmbH, The Vienna Biocenter Core Facilities, LemnaTec GmbH, Phenomix, WP, Qubit Systems.
3. What are the main segments of the Plants Phenotyping Market?
The market segments include Production Analysis, Consumption Analysis, Import Market Analysis (Value & Volume), Export Market Analysis (Value & Volume), Price Trend Analysis.
4. Can you provide details about the market size?
The market size is estimated to be USD 281.32 Million as of 2022.
5. What are some drivers contributing to market growth?
Demand For Landscaping Maintenance; Adoption of Green Spaces and Green Roofs.
6. What are the notable trends driving market growth?
Increasing Number of Seed Borne Diseases is Driving the Market.
7. Are there any restraints impacting market growth?
Shortage of Labor In Landscaping; High Maintenance Cost of Lawn Mowers.
8. Can you provide examples of recent developments in the market?
N/A
9. What pricing options are available for accessing the report?
Pricing options include single-user, multi-user, and enterprise licenses priced at USD 4750, USD 5250, and USD 8750 respectively.
10. Is the market size provided in terms of value or volume?
The market size is provided in terms of value, measured in Million.
11. Are there any specific market keywords associated with the report?
Yes, the market keyword associated with the report is "Plants Phenotyping Market," which aids in identifying and referencing the specific market segment covered.
12. How do I determine which pricing option suits my needs best?
The pricing options vary based on user requirements and access needs. Individual users may opt for single-user licenses, while businesses requiring broader access may choose multi-user or enterprise licenses for cost-effective access to the report.
13. Are there any additional resources or data provided in the Plants Phenotyping Market report?
While the report offers comprehensive insights, it's advisable to review the specific contents or supplementary materials provided to ascertain if additional resources or data are available.
14. How can I stay updated on further developments or reports in the Plants Phenotyping Market?
To stay informed about further developments, trends, and reports in the Plants Phenotyping Market, consider subscribing to industry newsletters, following relevant companies and organizations, or regularly checking reputable industry news sources and publications.
Methodology
Step 1 - Identification of Relevant Samples Size from Population Database


Step 2 - Approaches for Defining Global Market Size (Value, Volume* & Price*)

Note*: In applicable scenarios
Step 3 - Data Sources
Primary Research
- Web Analytics
- Survey Reports
- Research Institute
- Latest Research Reports
- Opinion Leaders
Secondary Research
- Annual Reports
- White Paper
- Latest Press Release
- Industry Association
- Paid Database
- Investor Presentations

Step 4 - Data Triangulation
Involves using different sources of information in order to increase the validity of a study
These sources are likely to be stakeholders in a program - participants, other researchers, program staff, other community members, and so on.
Then we put all data in single framework & apply various statistical tools to find out the dynamic on the market.
During the analysis stage, feedback from the stakeholder groups would be compared to determine areas of agreement as well as areas of divergence