

Key Insights
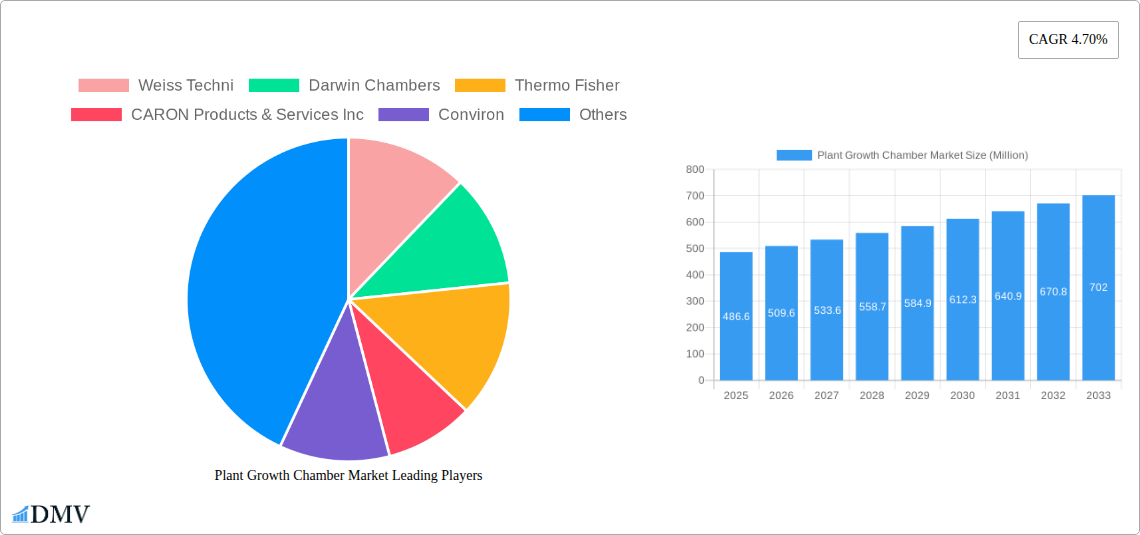
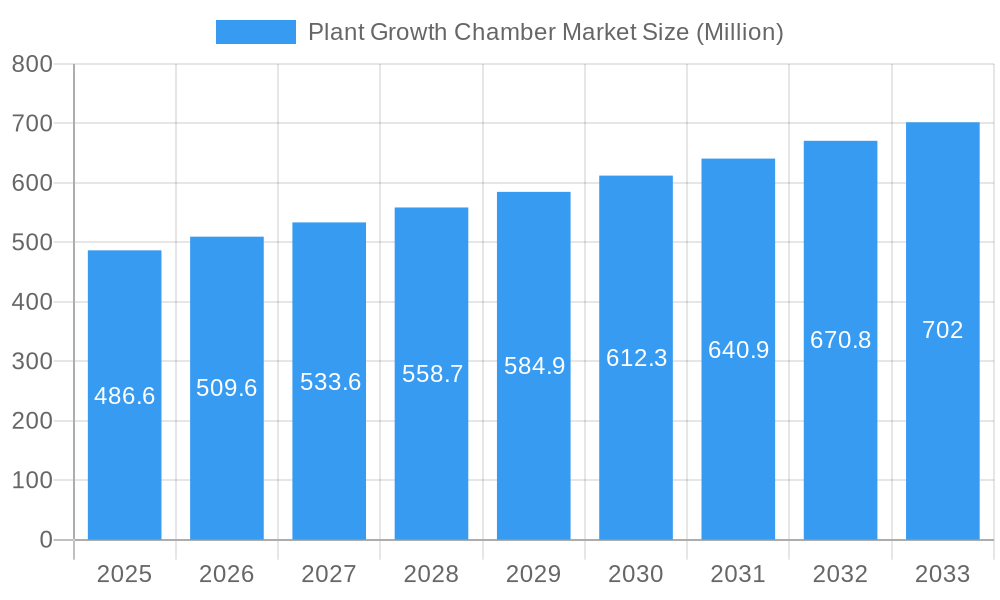
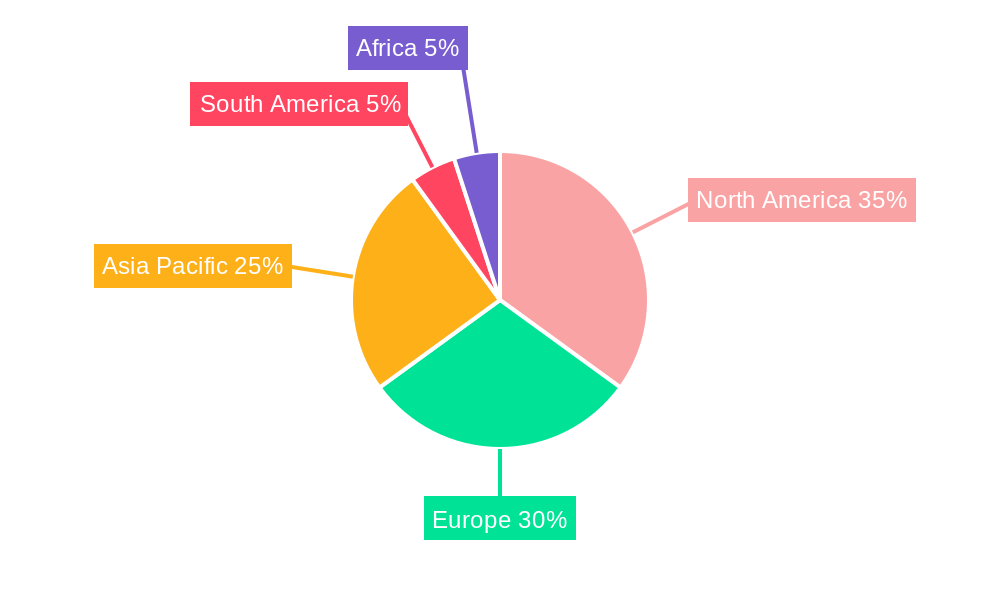
The global plant growth chamber market, valued at $486.60 million in 2025, is projected to experience robust growth, driven by escalating demand for controlled environment agriculture (CEA) and advancements in plant science research. The market's Compound Annual Growth Rate (CAGR) of 4.70% from 2025 to 2033 signifies a steady expansion, fueled by several key factors. Increasing investments in agricultural technology, the burgeoning need for year-round crop production irrespective of climate, and the rising adoption of tissue culture techniques in plant breeding and propagation are major contributors to market growth. The segmentation reveals a diverse market landscape. Reach-in chambers dominate the equipment type segment due to their cost-effectiveness and suitability for smaller-scale operations. However, walk-in chambers are gaining traction among large-scale research facilities and commercial growers. Application-wise, short-plant growth chambers hold a larger market share currently, but the demand for tall-plant chambers is expected to rise with increasing focus on larger crops. The market is witnessing innovation across functionalities, with plant growth, seed germination, and environment optimization being the primary applications. Tissue culture, a specialized segment, is experiencing significant growth due to its crucial role in plant propagation and genetic improvement. Geographically, North America and Europe are currently leading the market, driven by established research institutions and advanced agricultural practices. However, the Asia-Pacific region is expected to exhibit significant growth in the coming years due to the increasing adoption of advanced agricultural technologies and rising awareness of food security. Competition is intense, with a mix of established players like Thermo Fisher and Conviron and regional players like Saveer Biotech Limited catering to the diverse needs of the market.
Plant Growth Chamber Market Market Size (In Million)
The competitive landscape is dynamic, with both established multinational corporations and specialized regional companies vying for market share. Successful strategies involve offering customized solutions to meet specific research and cultivation needs, focusing on energy efficiency and automation features in chamber designs, and leveraging strong distribution networks. Challenges remain in addressing the high initial investment costs associated with plant growth chambers, particularly for smaller businesses and developing nations. However, innovative financing models and government subsidies aimed at promoting sustainable agriculture are expected to mitigate this barrier. The future trajectory points towards increased integration of smart technologies, including IoT sensors and AI-driven automation, to optimize resource utilization and enhance yield predictions. This will lead to more precise environmental control within chambers, resulting in higher-quality plant growth and improved efficiency in research and commercial applications.
Plant Growth Chamber Market Company Market Share
Plant Growth Chamber Market: A Comprehensive Report (2019-2033)
This insightful report provides a detailed analysis of the Plant Growth Chamber Market, offering a comprehensive overview of market dynamics, key players, and future growth prospects. Covering the period from 2019 to 2033, with a base year of 2025 and a forecast period of 2025-2033, this report is an essential resource for stakeholders seeking to understand and capitalize on opportunities within this dynamic market. The total market size in 2025 is estimated at $XX Million.
Plant Growth Chamber Market Market Composition & Trends
This section delves into the intricate structure of the plant growth chamber market, examining market concentration, innovative drivers, regulatory frameworks, substitute products, end-user profiles, and mergers and acquisitions (M&A) activities. The market is moderately fragmented, with several key players vying for market share. The top five companies – Weiss Techni, Darwin Chambers, Thermo Fisher, Conviron, and Caron Products & Services Inc. – collectively hold an estimated xx% of the market share in 2025. However, the presence of several smaller players indicates a competitive landscape.
Market Concentration:
- High degree of competition among established players and emerging companies.
- Market share distribution is moderately concentrated, with top players holding xx% in 2025.
- Significant opportunities exist for smaller players to innovate and gain market share.
Innovation Catalysts:
- Advancements in LED lighting technology are increasing energy efficiency and improving plant growth outcomes.
- Development of sophisticated control systems enhances environmental precision within chambers.
- Focus on automation is boosting productivity and reducing labor costs.
Regulatory Landscape:
- Stringent environmental regulations and safety standards are shaping the design and production of plant growth chambers.
- Variations in regulatory requirements across different geographies influence market dynamics.
Substitute Products:
- Greenhouse technologies present a partial substitute, but plant growth chambers offer more precise environmental control.
- The suitability of substitutes varies significantly based on plant type and research needs.
End-User Profiles:
- Research institutions (universities, government labs) constitute a major segment of end-users.
- Commercial applications (pharmaceutical companies, agricultural businesses) are growing rapidly.
- Private growers and hobbyists represent a smaller but increasingly significant segment.
M&A Activities:
- Recent M&A activity demonstrates consolidation in the market, with significant transactions shaping the competitive landscape.
- The May 2021 merger between Weiss Umwelttechnik GmbH and Vötsch Industrietechnik GmbH illustrates this trend. The reported deal value was $XX Million.
- Acquisitions, such as Caron's acquisition of Bigneat in August 2021 ($XX Million), are enhancing product portfolios and expanding market reach.
Plant Growth Chamber Market Industry Evolution
The plant growth chamber market has witnessed consistent growth, driven by several converging factors. Technological advancements, such as the development of LED lighting systems and improved climate control technologies, are enabling more precise environmental simulations. This precision translates to higher quality research data, faster plant growth cycles, and improved yields, further boosting market adoption. The rising global demand for food and the need for sustainable agricultural practices are also contributing to increased demand for plant growth chambers in various sectors.
The market experienced a Compound Annual Growth Rate (CAGR) of xx% during the historical period (2019-2024). This growth is expected to continue, with a projected CAGR of xx% during the forecast period (2025-2033). The increasing adoption of plant growth chambers in pharmaceutical and agricultural research, along with the growing awareness of the technology’s benefits, will fuel this continued expansion. The market's growth trajectory is further propelled by government initiatives and funding dedicated to agricultural research and development.
Leading Regions, Countries, or Segments in Plant Growth Chamber Market
North America currently dominates the global plant growth chamber market, driven by significant investments in agricultural research and the presence of major market players. Europe also holds a substantial share, fueled by a strong focus on sustainable agriculture and technological advancements. The Asia-Pacific region, while presently having a smaller market share, presents considerable growth potential due to the increasing adoption of advanced technologies in agriculture and the burgeoning research sector.
Key Drivers for North American Dominance:
- High R&D investment: substantial funding for agricultural and plant science research.
- Presence of major players: established manufacturers and suppliers within the region.
- Strong regulatory support: government initiatives promoting technological advancements in agriculture.
Segment Analysis:
- Equipment Type: Walk-in chambers hold a larger market share than reach-in chambers due to their capacity for larger-scale research and commercial operations.
- Application: The demand for chambers suitable for tall plants is higher than those for short plants due to the increasing cultivation of high-yield crops and trees.
- Function: Plant growth and environment optimization are the most common functions, accounting for the largest share of the market. Tissue culture and seed germination applications are growing steadily.
Factors driving segment dominance: The dominance of specific regions and segments is significantly impacted by the level of investment in agricultural research and the demand for optimized plant growth conditions across various industries. The advancements in technology and increasing awareness of sustainable agriculture practices further contribute to segment growth.
Plant Growth Chamber Market Product Innovations
Recent innovations include the development of energy-efficient LED lighting systems, sophisticated environmental control systems offering precision in temperature, humidity, and light intensity, and automated data acquisition and analysis software. These innovations improve experimental control, reduce energy consumption, and enhance data analysis capabilities, leading to more efficient and reliable research outcomes. Unique selling propositions now frequently include customized chamber designs for specific plant types, optimized lighting spectra, and user-friendly interfaces.
Propelling Factors for Plant Growth Chamber Market Growth
The plant growth chamber market is experiencing rapid expansion due to several converging factors. The growing global population and increasing demand for food are fueling the need for advanced agricultural techniques. Technological advancements, such as improved LED lighting and climate control systems, offer greater precision and efficiency. Furthermore, stringent regulations promoting sustainable agricultural practices are driving adoption. Government initiatives, funding for agricultural research, and the increasing adoption of plant growth chambers in pharmaceutical research are also significantly impacting market growth.
Obstacles in the Plant Growth Chamber Market Market
Despite significant growth, the market faces challenges. High initial investment costs can deter smaller players or institutions with limited budgets. Supply chain disruptions, especially concerning specialized components, can impact production and availability. Competitive pressures from established and emerging players intensify the need for continuous innovation and cost-effectiveness. Furthermore, varying regulatory standards across regions complicate market access and expansion for international companies.
Future Opportunities in Plant Growth Chamber Market
Future opportunities lie in the development of more sustainable and energy-efficient plant growth chambers. Increased focus on precision agriculture and vertical farming will drive the demand for customizable and automated systems. The expansion into emerging markets, particularly in developing economies, offers substantial growth potential. The integration of advanced technologies such as IoT and AI for data analysis and process optimization will enhance the efficiency and capabilities of plant growth chambers.
Major Players in the Plant Growth Chamber Market Ecosystem
- Weiss Techni
- Darwin Chambers
- Thermo Fisher
- CARON Products & Services Inc
- Conviron
- Aralab
- Percival Scientific Inc
- Brs Bvba
- BINDER GmbH
- Hettich Benelux BV
- Saveer Biotech Limited
- Freezers India
Key Developments in Plant Growth Chamber Market Industry
January 2022: Conviron launched its new EVO series of plant growth chambers, featuring advanced LED lighting for improved spatial uniformity and suitability for various plant heights. This launch significantly enhanced the company's product offerings and competitiveness.
August 2021: Caron's acquisition of Bigneat expanded its product portfolio into laboratory equipment, notably testing chambers and incubators. This strategic move broadened Caron's market reach and product diversity within the life sciences sector.
May 2021: The merger between Weiss Umwelttechnik GmbH and Vötsch Industrietechnik GmbH consolidated expertise in environmental simulation and plant growth chambers, creating a stronger player in the market. This merger led to increased market share and enhanced product development capabilities.
Strategic Plant Growth Chamber Market Market Forecast
The plant growth chamber market is poised for continued robust growth driven by technological advancements, increasing research activities, and a greater emphasis on sustainable agricultural practices. The growing demand for higher-yield crops and the increasing focus on precision agriculture will contribute to market expansion. The exploration of new applications, coupled with continuous product innovation, will further stimulate market growth and unlock new opportunities for market players. The forecast anticipates strong growth across all major segments, with particular focus on regions exhibiting increasing investment in agricultural research and development.
Plant Growth Chamber Market Segmentation
- 1. Production Analysis
- 2. Consumption Analysis
- 3. Import Market Analysis (Value & Volume)
- 4. Export Market Analysis (Value & Volume)
- 5. Price Trend Analysis
Plant Growth Chamber Market Segmentation By Geography
-
1. North America
- 1.1. United States
- 1.2. Canada
- 1.3. Mexico
-
2. South America
- 2.1. Brazil
- 2.2. Argentina
- 2.3. Rest of South America
-
3. Europe
- 3.1. United Kingdom
- 3.2. Germany
- 3.3. France
- 3.4. Italy
- 3.5. Spain
- 3.6. Russia
- 3.7. Benelux
- 3.8. Nordics
- 3.9. Rest of Europe
-
4. Middle East & Africa
- 4.1. Turkey
- 4.2. Israel
- 4.3. GCC
- 4.4. North Africa
- 4.5. South Africa
- 4.6. Rest of Middle East & Africa
-
5. Asia Pacific
- 5.1. China
- 5.2. India
- 5.3. Japan
- 5.4. South Korea
- 5.5. ASEAN
- 5.6. Oceania
- 5.7. Rest of Asia Pacific
Plant Growth Chamber Market Regional Market Share
Geographic Coverage of Plant Growth Chamber Market
Plant Growth Chamber Market REPORT HIGHLIGHTS
| Aspects | Details |
|---|---|
| Study Period | 2020-2034 |
| Base Year | 2025 |
| Estimated Year | 2026 |
| Forecast Period | 2026-2034 |
| Historical Period | 2020-2025 |
| Growth Rate | CAGR of 4.70% from 2020-2034 |
| Segmentation |
|
Table of Contents
- 1. Introduction
- 1.1. Research Scope
- 1.2. Market Segmentation
- 1.3. Research Objective
- 1.4. Definitions and Assumptions
- 2. Executive Summary
- 2.1. Market Snapshot
- 3. Market Dynamics
- 3.1. Market Drivers
- 3.2. Market Restrains
- 3.3. Market Trends
- 3.4. Market Opportunities
- 4. Market Factor Analysis
- 4.1. Porters Five Forces
- 4.1.1. Bargaining Power of Suppliers
- 4.1.2. Bargaining Power of Buyers
- 4.1.3. Threat of New Entrants
- 4.1.4. Threat of Substitutes
- 4.1.5. Competitive Rivalry
- 4.2. PESTEL analysis
- 4.3. BCG Analysis
- 4.3.1. Stars (High Growth, High Market Share)
- 4.3.2. Cash Cows (Low Growth, High Market Share)
- 4.3.3. Question Mark (High Growth, Low Market Share)
- 4.3.4. Dogs (Low Growth, Low Market Share)
- 4.4. Ansoff Matrix Analysis
- 4.5. Supply Chain Analysis
- 4.6. Regulatory Landscape
- 4.7. Current Market Potential and Opportunity Assessment (TAM–SAM–SOM Framework)
- 4.8. DMV Analyst Note
- 4.1. Porters Five Forces
- 5. Market Analysis, Insights and Forecast 2021-2033
- 5.1. Market Analysis, Insights and Forecast - by Production Analysis
- 5.2. Market Analysis, Insights and Forecast - by Consumption Analysis
- 5.3. Market Analysis, Insights and Forecast - by Import Market Analysis (Value & Volume)
- 5.4. Market Analysis, Insights and Forecast - by Export Market Analysis (Value & Volume)
- 5.5. Market Analysis, Insights and Forecast - by Price Trend Analysis
- 5.6. Market Analysis, Insights and Forecast - by Region
- 5.6.1. North America
- 5.6.2. South America
- 5.6.3. Europe
- 5.6.4. Middle East & Africa
- 5.6.5. Asia Pacific
- 6. Global Plant Growth Chamber Market Analysis, Insights and Forecast, 2021-2033
- 6.1. Market Analysis, Insights and Forecast - by Production Analysis
- 6.2. Market Analysis, Insights and Forecast - by Consumption Analysis
- 6.3. Market Analysis, Insights and Forecast - by Import Market Analysis (Value & Volume)
- 6.4. Market Analysis, Insights and Forecast - by Export Market Analysis (Value & Volume)
- 6.5. Market Analysis, Insights and Forecast - by Price Trend Analysis
- 7. North America Plant Growth Chamber Market Analysis, Insights and Forecast, 2020-2032
- 7.1. Market Analysis, Insights and Forecast - by Production Analysis
- 7.2. Market Analysis, Insights and Forecast - by Consumption Analysis
- 7.3. Market Analysis, Insights and Forecast - by Import Market Analysis (Value & Volume)
- 7.4. Market Analysis, Insights and Forecast - by Export Market Analysis (Value & Volume)
- 7.5. Market Analysis, Insights and Forecast - by Price Trend Analysis
- 8. South America Plant Growth Chamber Market Analysis, Insights and Forecast, 2020-2032
- 8.1. Market Analysis, Insights and Forecast - by Production Analysis
- 8.2. Market Analysis, Insights and Forecast - by Consumption Analysis
- 8.3. Market Analysis, Insights and Forecast - by Import Market Analysis (Value & Volume)
- 8.4. Market Analysis, Insights and Forecast - by Export Market Analysis (Value & Volume)
- 8.5. Market Analysis, Insights and Forecast - by Price Trend Analysis
- 9. Europe Plant Growth Chamber Market Analysis, Insights and Forecast, 2020-2032
- 9.1. Market Analysis, Insights and Forecast - by Production Analysis
- 9.2. Market Analysis, Insights and Forecast - by Consumption Analysis
- 9.3. Market Analysis, Insights and Forecast - by Import Market Analysis (Value & Volume)
- 9.4. Market Analysis, Insights and Forecast - by Export Market Analysis (Value & Volume)
- 9.5. Market Analysis, Insights and Forecast - by Price Trend Analysis
- 10. Middle East & Africa Plant Growth Chamber Market Analysis, Insights and Forecast, 2020-2032
- 10.1. Market Analysis, Insights and Forecast - by Production Analysis
- 10.2. Market Analysis, Insights and Forecast - by Consumption Analysis
- 10.3. Market Analysis, Insights and Forecast - by Import Market Analysis (Value & Volume)
- 10.4. Market Analysis, Insights and Forecast - by Export Market Analysis (Value & Volume)
- 10.5. Market Analysis, Insights and Forecast - by Price Trend Analysis
- 11. Asia Pacific Plant Growth Chamber Market Analysis, Insights and Forecast, 2020-2032
- 11.1. Market Analysis, Insights and Forecast - by Production Analysis
- 11.2. Market Analysis, Insights and Forecast - by Consumption Analysis
- 11.3. Market Analysis, Insights and Forecast - by Import Market Analysis (Value & Volume)
- 11.4. Market Analysis, Insights and Forecast - by Export Market Analysis (Value & Volume)
- 11.5. Market Analysis, Insights and Forecast - by Price Trend Analysis
- 12. Competitive Analysis
- 12.1. Company Profiles
- 12.1.1 Weiss Techni
- 12.1.1.1. Company Overview
- 12.1.1.2. Products
- 12.1.1.3. Company Financials
- 12.1.1.4. SWOT Analysis
- 12.1.2 Darwin Chambers
- 12.1.2.1. Company Overview
- 12.1.2.2. Products
- 12.1.2.3. Company Financials
- 12.1.2.4. SWOT Analysis
- 12.1.3 Thermo Fisher
- 12.1.3.1. Company Overview
- 12.1.3.2. Products
- 12.1.3.3. Company Financials
- 12.1.3.4. SWOT Analysis
- 12.1.4 CARON Products & Services Inc
- 12.1.4.1. Company Overview
- 12.1.4.2. Products
- 12.1.4.3. Company Financials
- 12.1.4.4. SWOT Analysis
- 12.1.5 Conviron
- 12.1.5.1. Company Overview
- 12.1.5.2. Products
- 12.1.5.3. Company Financials
- 12.1.5.4. SWOT Analysis
- 12.1.6 Aralab
- 12.1.6.1. Company Overview
- 12.1.6.2. Products
- 12.1.6.3. Company Financials
- 12.1.6.4. SWOT Analysis
- 12.1.7 Percival Scientific Inc
- 12.1.7.1. Company Overview
- 12.1.7.2. Products
- 12.1.7.3. Company Financials
- 12.1.7.4. SWOT Analysis
- 12.1.8 Brs Bvba
- 12.1.8.1. Company Overview
- 12.1.8.2. Products
- 12.1.8.3. Company Financials
- 12.1.8.4. SWOT Analysis
- 12.1.9 BINDER GmbH
- 12.1.9.1. Company Overview
- 12.1.9.2. Products
- 12.1.9.3. Company Financials
- 12.1.9.4. SWOT Analysis
- 12.1.10 Hettich Benelux BV
- 12.1.10.1. Company Overview
- 12.1.10.2. Products
- 12.1.10.3. Company Financials
- 12.1.10.4. SWOT Analysis
- 12.1.11 Saveer Biotech Limited
- 12.1.11.1. Company Overview
- 12.1.11.2. Products
- 12.1.11.3. Company Financials
- 12.1.11.4. SWOT Analysis
- 12.1.12 Freezers India
- 12.1.12.1. Company Overview
- 12.1.12.2. Products
- 12.1.12.3. Company Financials
- 12.1.12.4. SWOT Analysis
- 12.1.1 Weiss Techni
- 12.2. Market Entropy
- 12.2.1 Company's Key Areas Served
- 12.2.2 Recent Developments
- 12.3. Company Market Share Analysis 2025
- 12.3.1 Top 5 Companies Market Share Analysis
- 12.3.2 Top 3 Companies Market Share Analysis
- 12.4. List of Potential Customers
- 13. Research Methodology
List of Figures
- Figure 1: Global Plant Growth Chamber Market Revenue Breakdown (Million, %) by Region 2025 & 2033
- Figure 2: North America Plant Growth Chamber Market Revenue (Million), by Production Analysis 2025 & 2033
- Figure 3: North America Plant Growth Chamber Market Revenue Share (%), by Production Analysis 2025 & 2033
- Figure 4: North America Plant Growth Chamber Market Revenue (Million), by Consumption Analysis 2025 & 2033
- Figure 5: North America Plant Growth Chamber Market Revenue Share (%), by Consumption Analysis 2025 & 2033
- Figure 6: North America Plant Growth Chamber Market Revenue (Million), by Import Market Analysis (Value & Volume) 2025 & 2033
- Figure 7: North America Plant Growth Chamber Market Revenue Share (%), by Import Market Analysis (Value & Volume) 2025 & 2033
- Figure 8: North America Plant Growth Chamber Market Revenue (Million), by Export Market Analysis (Value & Volume) 2025 & 2033
- Figure 9: North America Plant Growth Chamber Market Revenue Share (%), by Export Market Analysis (Value & Volume) 2025 & 2033
- Figure 10: North America Plant Growth Chamber Market Revenue (Million), by Price Trend Analysis 2025 & 2033
- Figure 11: North America Plant Growth Chamber Market Revenue Share (%), by Price Trend Analysis 2025 & 2033
- Figure 12: North America Plant Growth Chamber Market Revenue (Million), by Country 2025 & 2033
- Figure 13: North America Plant Growth Chamber Market Revenue Share (%), by Country 2025 & 2033
- Figure 14: South America Plant Growth Chamber Market Revenue (Million), by Production Analysis 2025 & 2033
- Figure 15: South America Plant Growth Chamber Market Revenue Share (%), by Production Analysis 2025 & 2033
- Figure 16: South America Plant Growth Chamber Market Revenue (Million), by Consumption Analysis 2025 & 2033
- Figure 17: South America Plant Growth Chamber Market Revenue Share (%), by Consumption Analysis 2025 & 2033
- Figure 18: South America Plant Growth Chamber Market Revenue (Million), by Import Market Analysis (Value & Volume) 2025 & 2033
- Figure 19: South America Plant Growth Chamber Market Revenue Share (%), by Import Market Analysis (Value & Volume) 2025 & 2033
- Figure 20: South America Plant Growth Chamber Market Revenue (Million), by Export Market Analysis (Value & Volume) 2025 & 2033
- Figure 21: South America Plant Growth Chamber Market Revenue Share (%), by Export Market Analysis (Value & Volume) 2025 & 2033
- Figure 22: South America Plant Growth Chamber Market Revenue (Million), by Price Trend Analysis 2025 & 2033
- Figure 23: South America Plant Growth Chamber Market Revenue Share (%), by Price Trend Analysis 2025 & 2033
- Figure 24: South America Plant Growth Chamber Market Revenue (Million), by Country 2025 & 2033
- Figure 25: South America Plant Growth Chamber Market Revenue Share (%), by Country 2025 & 2033
- Figure 26: Europe Plant Growth Chamber Market Revenue (Million), by Production Analysis 2025 & 2033
- Figure 27: Europe Plant Growth Chamber Market Revenue Share (%), by Production Analysis 2025 & 2033
- Figure 28: Europe Plant Growth Chamber Market Revenue (Million), by Consumption Analysis 2025 & 2033
- Figure 29: Europe Plant Growth Chamber Market Revenue Share (%), by Consumption Analysis 2025 & 2033
- Figure 30: Europe Plant Growth Chamber Market Revenue (Million), by Import Market Analysis (Value & Volume) 2025 & 2033
- Figure 31: Europe Plant Growth Chamber Market Revenue Share (%), by Import Market Analysis (Value & Volume) 2025 & 2033
- Figure 32: Europe Plant Growth Chamber Market Revenue (Million), by Export Market Analysis (Value & Volume) 2025 & 2033
- Figure 33: Europe Plant Growth Chamber Market Revenue Share (%), by Export Market Analysis (Value & Volume) 2025 & 2033
- Figure 34: Europe Plant Growth Chamber Market Revenue (Million), by Price Trend Analysis 2025 & 2033
- Figure 35: Europe Plant Growth Chamber Market Revenue Share (%), by Price Trend Analysis 2025 & 2033
- Figure 36: Europe Plant Growth Chamber Market Revenue (Million), by Country 2025 & 2033
- Figure 37: Europe Plant Growth Chamber Market Revenue Share (%), by Country 2025 & 2033
- Figure 38: Middle East & Africa Plant Growth Chamber Market Revenue (Million), by Production Analysis 2025 & 2033
- Figure 39: Middle East & Africa Plant Growth Chamber Market Revenue Share (%), by Production Analysis 2025 & 2033
- Figure 40: Middle East & Africa Plant Growth Chamber Market Revenue (Million), by Consumption Analysis 2025 & 2033
- Figure 41: Middle East & Africa Plant Growth Chamber Market Revenue Share (%), by Consumption Analysis 2025 & 2033
- Figure 42: Middle East & Africa Plant Growth Chamber Market Revenue (Million), by Import Market Analysis (Value & Volume) 2025 & 2033
- Figure 43: Middle East & Africa Plant Growth Chamber Market Revenue Share (%), by Import Market Analysis (Value & Volume) 2025 & 2033
- Figure 44: Middle East & Africa Plant Growth Chamber Market Revenue (Million), by Export Market Analysis (Value & Volume) 2025 & 2033
- Figure 45: Middle East & Africa Plant Growth Chamber Market Revenue Share (%), by Export Market Analysis (Value & Volume) 2025 & 2033
- Figure 46: Middle East & Africa Plant Growth Chamber Market Revenue (Million), by Price Trend Analysis 2025 & 2033
- Figure 47: Middle East & Africa Plant Growth Chamber Market Revenue Share (%), by Price Trend Analysis 2025 & 2033
- Figure 48: Middle East & Africa Plant Growth Chamber Market Revenue (Million), by Country 2025 & 2033
- Figure 49: Middle East & Africa Plant Growth Chamber Market Revenue Share (%), by Country 2025 & 2033
- Figure 50: Asia Pacific Plant Growth Chamber Market Revenue (Million), by Production Analysis 2025 & 2033
- Figure 51: Asia Pacific Plant Growth Chamber Market Revenue Share (%), by Production Analysis 2025 & 2033
- Figure 52: Asia Pacific Plant Growth Chamber Market Revenue (Million), by Consumption Analysis 2025 & 2033
- Figure 53: Asia Pacific Plant Growth Chamber Market Revenue Share (%), by Consumption Analysis 2025 & 2033
- Figure 54: Asia Pacific Plant Growth Chamber Market Revenue (Million), by Import Market Analysis (Value & Volume) 2025 & 2033
- Figure 55: Asia Pacific Plant Growth Chamber Market Revenue Share (%), by Import Market Analysis (Value & Volume) 2025 & 2033
- Figure 56: Asia Pacific Plant Growth Chamber Market Revenue (Million), by Export Market Analysis (Value & Volume) 2025 & 2033
- Figure 57: Asia Pacific Plant Growth Chamber Market Revenue Share (%), by Export Market Analysis (Value & Volume) 2025 & 2033
- Figure 58: Asia Pacific Plant Growth Chamber Market Revenue (Million), by Price Trend Analysis 2025 & 2033
- Figure 59: Asia Pacific Plant Growth Chamber Market Revenue Share (%), by Price Trend Analysis 2025 & 2033
- Figure 60: Asia Pacific Plant Growth Chamber Market Revenue (Million), by Country 2025 & 2033
- Figure 61: Asia Pacific Plant Growth Chamber Market Revenue Share (%), by Country 2025 & 2033
List of Tables
- Table 1: Global Plant Growth Chamber Market Revenue Million Forecast, by Production Analysis 2020 & 2033
- Table 2: Global Plant Growth Chamber Market Revenue Million Forecast, by Consumption Analysis 2020 & 2033
- Table 3: Global Plant Growth Chamber Market Revenue Million Forecast, by Import Market Analysis (Value & Volume) 2020 & 2033
- Table 4: Global Plant Growth Chamber Market Revenue Million Forecast, by Export Market Analysis (Value & Volume) 2020 & 2033
- Table 5: Global Plant Growth Chamber Market Revenue Million Forecast, by Price Trend Analysis 2020 & 2033
- Table 6: Global Plant Growth Chamber Market Revenue Million Forecast, by Region 2020 & 2033
- Table 7: Global Plant Growth Chamber Market Revenue Million Forecast, by Production Analysis 2020 & 2033
- Table 8: Global Plant Growth Chamber Market Revenue Million Forecast, by Consumption Analysis 2020 & 2033
- Table 9: Global Plant Growth Chamber Market Revenue Million Forecast, by Import Market Analysis (Value & Volume) 2020 & 2033
- Table 10: Global Plant Growth Chamber Market Revenue Million Forecast, by Export Market Analysis (Value & Volume) 2020 & 2033
- Table 11: Global Plant Growth Chamber Market Revenue Million Forecast, by Price Trend Analysis 2020 & 2033
- Table 12: Global Plant Growth Chamber Market Revenue Million Forecast, by Country 2020 & 2033
- Table 13: United States Plant Growth Chamber Market Revenue (Million) Forecast, by Application 2020 & 2033
- Table 14: Canada Plant Growth Chamber Market Revenue (Million) Forecast, by Application 2020 & 2033
- Table 15: Mexico Plant Growth Chamber Market Revenue (Million) Forecast, by Application 2020 & 2033
- Table 16: Global Plant Growth Chamber Market Revenue Million Forecast, by Production Analysis 2020 & 2033
- Table 17: Global Plant Growth Chamber Market Revenue Million Forecast, by Consumption Analysis 2020 & 2033
- Table 18: Global Plant Growth Chamber Market Revenue Million Forecast, by Import Market Analysis (Value & Volume) 2020 & 2033
- Table 19: Global Plant Growth Chamber Market Revenue Million Forecast, by Export Market Analysis (Value & Volume) 2020 & 2033
- Table 20: Global Plant Growth Chamber Market Revenue Million Forecast, by Price Trend Analysis 2020 & 2033
- Table 21: Global Plant Growth Chamber Market Revenue Million Forecast, by Country 2020 & 2033
- Table 22: Brazil Plant Growth Chamber Market Revenue (Million) Forecast, by Application 2020 & 2033
- Table 23: Argentina Plant Growth Chamber Market Revenue (Million) Forecast, by Application 2020 & 2033
- Table 24: Rest of South America Plant Growth Chamber Market Revenue (Million) Forecast, by Application 2020 & 2033
- Table 25: Global Plant Growth Chamber Market Revenue Million Forecast, by Production Analysis 2020 & 2033
- Table 26: Global Plant Growth Chamber Market Revenue Million Forecast, by Consumption Analysis 2020 & 2033
- Table 27: Global Plant Growth Chamber Market Revenue Million Forecast, by Import Market Analysis (Value & Volume) 2020 & 2033
- Table 28: Global Plant Growth Chamber Market Revenue Million Forecast, by Export Market Analysis (Value & Volume) 2020 & 2033
- Table 29: Global Plant Growth Chamber Market Revenue Million Forecast, by Price Trend Analysis 2020 & 2033
- Table 30: Global Plant Growth Chamber Market Revenue Million Forecast, by Country 2020 & 2033
- Table 31: United Kingdom Plant Growth Chamber Market Revenue (Million) Forecast, by Application 2020 & 2033
- Table 32: Germany Plant Growth Chamber Market Revenue (Million) Forecast, by Application 2020 & 2033
- Table 33: France Plant Growth Chamber Market Revenue (Million) Forecast, by Application 2020 & 2033
- Table 34: Italy Plant Growth Chamber Market Revenue (Million) Forecast, by Application 2020 & 2033
- Table 35: Spain Plant Growth Chamber Market Revenue (Million) Forecast, by Application 2020 & 2033
- Table 36: Russia Plant Growth Chamber Market Revenue (Million) Forecast, by Application 2020 & 2033
- Table 37: Benelux Plant Growth Chamber Market Revenue (Million) Forecast, by Application 2020 & 2033
- Table 38: Nordics Plant Growth Chamber Market Revenue (Million) Forecast, by Application 2020 & 2033
- Table 39: Rest of Europe Plant Growth Chamber Market Revenue (Million) Forecast, by Application 2020 & 2033
- Table 40: Global Plant Growth Chamber Market Revenue Million Forecast, by Production Analysis 2020 & 2033
- Table 41: Global Plant Growth Chamber Market Revenue Million Forecast, by Consumption Analysis 2020 & 2033
- Table 42: Global Plant Growth Chamber Market Revenue Million Forecast, by Import Market Analysis (Value & Volume) 2020 & 2033
- Table 43: Global Plant Growth Chamber Market Revenue Million Forecast, by Export Market Analysis (Value & Volume) 2020 & 2033
- Table 44: Global Plant Growth Chamber Market Revenue Million Forecast, by Price Trend Analysis 2020 & 2033
- Table 45: Global Plant Growth Chamber Market Revenue Million Forecast, by Country 2020 & 2033
- Table 46: Turkey Plant Growth Chamber Market Revenue (Million) Forecast, by Application 2020 & 2033
- Table 47: Israel Plant Growth Chamber Market Revenue (Million) Forecast, by Application 2020 & 2033
- Table 48: GCC Plant Growth Chamber Market Revenue (Million) Forecast, by Application 2020 & 2033
- Table 49: North Africa Plant Growth Chamber Market Revenue (Million) Forecast, by Application 2020 & 2033
- Table 50: South Africa Plant Growth Chamber Market Revenue (Million) Forecast, by Application 2020 & 2033
- Table 51: Rest of Middle East & Africa Plant Growth Chamber Market Revenue (Million) Forecast, by Application 2020 & 2033
- Table 52: Global Plant Growth Chamber Market Revenue Million Forecast, by Production Analysis 2020 & 2033
- Table 53: Global Plant Growth Chamber Market Revenue Million Forecast, by Consumption Analysis 2020 & 2033
- Table 54: Global Plant Growth Chamber Market Revenue Million Forecast, by Import Market Analysis (Value & Volume) 2020 & 2033
- Table 55: Global Plant Growth Chamber Market Revenue Million Forecast, by Export Market Analysis (Value & Volume) 2020 & 2033
- Table 56: Global Plant Growth Chamber Market Revenue Million Forecast, by Price Trend Analysis 2020 & 2033
- Table 57: Global Plant Growth Chamber Market Revenue Million Forecast, by Country 2020 & 2033
- Table 58: China Plant Growth Chamber Market Revenue (Million) Forecast, by Application 2020 & 2033
- Table 59: India Plant Growth Chamber Market Revenue (Million) Forecast, by Application 2020 & 2033
- Table 60: Japan Plant Growth Chamber Market Revenue (Million) Forecast, by Application 2020 & 2033
- Table 61: South Korea Plant Growth Chamber Market Revenue (Million) Forecast, by Application 2020 & 2033
- Table 62: ASEAN Plant Growth Chamber Market Revenue (Million) Forecast, by Application 2020 & 2033
- Table 63: Oceania Plant Growth Chamber Market Revenue (Million) Forecast, by Application 2020 & 2033
- Table 64: Rest of Asia Pacific Plant Growth Chamber Market Revenue (Million) Forecast, by Application 2020 & 2033
Frequently Asked Questions
1. What is the projected Compound Annual Growth Rate (CAGR) of the Plant Growth Chamber Market?
The projected CAGR is approximately 4.70%.
2. Which companies are prominent players in the Plant Growth Chamber Market?
Key companies in the market include Weiss Techni, Darwin Chambers, Thermo Fisher, CARON Products & Services Inc, Conviron, Aralab, Percival Scientific Inc, Brs Bvba, BINDER GmbH, Hettich Benelux BV, Saveer Biotech Limited, Freezers India.
3. What are the main segments of the Plant Growth Chamber Market?
The market segments include Production Analysis, Consumption Analysis, Import Market Analysis (Value & Volume), Export Market Analysis (Value & Volume), Price Trend Analysis.
4. Can you provide details about the market size?
The market size is estimated to be USD 486.60 Million as of 2022.
5. What are some drivers contributing to market growth?
Seed Treatment As A Solution To Enhance Yield; Growing Awareness For Seed Treatment Among The Farmers; Rising Trend Of Organic Farming.
6. What are the notable trends driving market growth?
Increasing Demand for Food and Decreasing Arable Land.
7. Are there any restraints impacting market growth?
Limitations Across Farm-Level Seed Treatment; Rising Environmental Concerns.
8. Can you provide examples of recent developments in the market?
January 2022: Conviron launched a new EVO series of plant growth chambers, featuring a range of LE intensities, delivering a high degree of spatial uniformity for plant growth suitable for both short, medium, and tall plants.
9. What pricing options are available for accessing the report?
Pricing options include single-user, multi-user, and enterprise licenses priced at USD 4750, USD 5250, and USD 8750 respectively.
10. Is the market size provided in terms of value or volume?
The market size is provided in terms of value, measured in Million.
11. Are there any specific market keywords associated with the report?
Yes, the market keyword associated with the report is "Plant Growth Chamber Market," which aids in identifying and referencing the specific market segment covered.
12. How do I determine which pricing option suits my needs best?
The pricing options vary based on user requirements and access needs. Individual users may opt for single-user licenses, while businesses requiring broader access may choose multi-user or enterprise licenses for cost-effective access to the report.
13. Are there any additional resources or data provided in the Plant Growth Chamber Market report?
While the report offers comprehensive insights, it's advisable to review the specific contents or supplementary materials provided to ascertain if additional resources or data are available.
14. How can I stay updated on further developments or reports in the Plant Growth Chamber Market?
To stay informed about further developments, trends, and reports in the Plant Growth Chamber Market, consider subscribing to industry newsletters, following relevant companies and organizations, or regularly checking reputable industry news sources and publications.
Methodology
Step 1 - Identification of Relevant Samples Size from Population Database


Step 2 - Approaches for Defining Global Market Size (Value, Volume* & Price*)

Note*: In applicable scenarios
Step 3 - Data Sources
Primary Research
- Web Analytics
- Survey Reports
- Research Institute
- Latest Research Reports
- Opinion Leaders
Secondary Research
- Annual Reports
- White Paper
- Latest Press Release
- Industry Association
- Paid Database
- Investor Presentations

Step 4 - Data Triangulation
Involves using different sources of information in order to increase the validity of a study
These sources are likely to be stakeholders in a program - participants, other researchers, program staff, other community members, and so on.
Then we put all data in single framework & apply various statistical tools to find out the dynamic on the market.
During the analysis stage, feedback from the stakeholder groups would be compared to determine areas of agreement as well as areas of divergence