

Key Insights
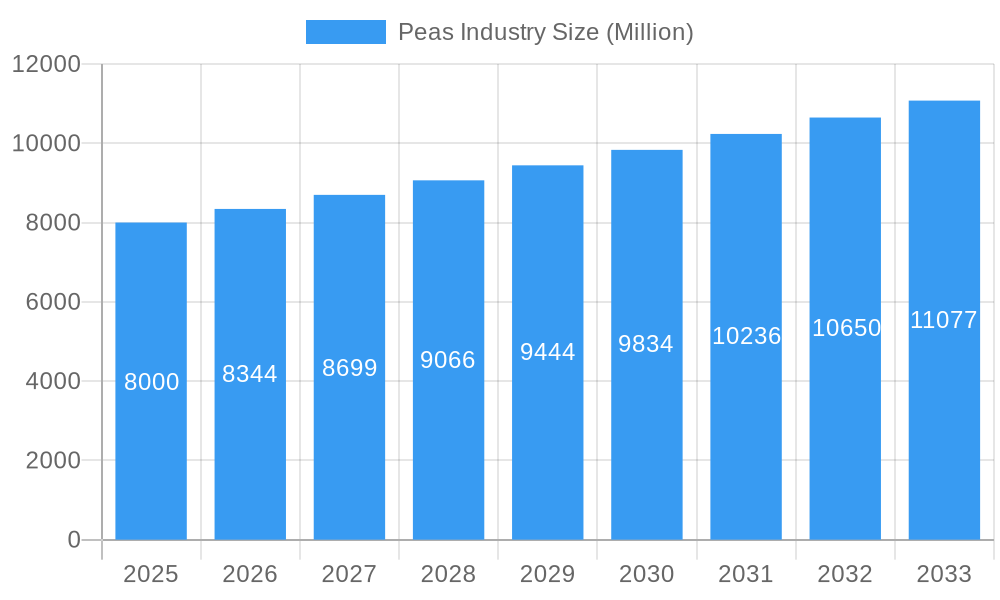
The global peas industry, valued at approximately $8 billion in 2025, is projected to experience steady growth, driven by increasing demand for plant-based protein and sustainable food solutions. A compound annual growth rate (CAGR) of 4.30% from 2025 to 2033 indicates a significant market expansion, reaching an estimated $12 billion by 2033. Key drivers include the rising popularity of pea-based protein in food and beverage products, catering to the growing vegan and vegetarian consumer base, and the increasing awareness of the health benefits associated with pea consumption. Furthermore, the utilization of peas in animal feed and biofuel production contributes to market growth. While challenges like price fluctuations and reliance on agricultural yields exist, innovative processing techniques and the development of new pea-based products are mitigating these restraints. The industry is segmented by product type (dry peas, green peas, pea protein, pea starch) and end-use (food, feed, biofuels), with the food segment currently dominating market share. Major players like Solina Group, Archer Daniels Midland, Ingredion, Cargill, and Roquette are actively shaping the industry through strategic partnerships, acquisitions, and product innovation. Geographically, North America and Europe currently hold significant market shares, but the Asia-Pacific region is anticipated to witness robust growth fueled by rising disposable incomes and changing dietary habits.

Peas Industry Market Size (In Billion)
The competitive landscape is characterized by both established players and emerging companies focusing on specialized pea-derived products. Technological advancements in pea processing are leading to higher-quality ingredients with improved functionality and nutritional profiles. The industry is also increasingly focused on sustainability, with efforts towards reducing water usage and promoting environmentally friendly farming practices. Future growth hinges on continued research and development to enhance the functionality of pea-based ingredients, expand market applications, and address consumer demands for healthier, more sustainable food choices. The shift towards plant-based diets is expected to further boost demand, driving further growth and innovation within the pea industry.
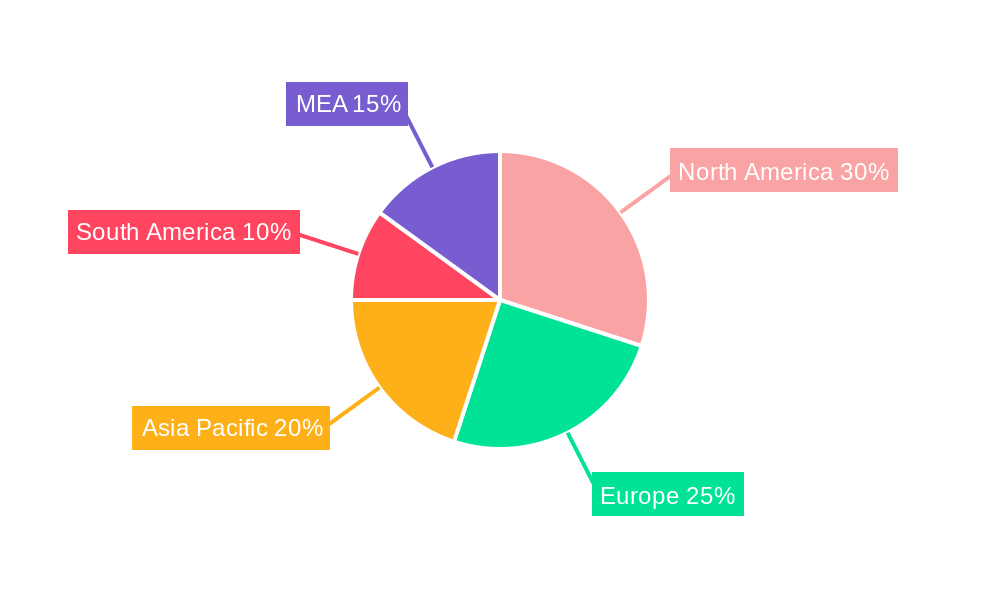
Peas Industry Company Market Share
Peas Industry Market Report: 2019-2033
This comprehensive report provides an in-depth analysis of the global peas industry, projecting a market value exceeding $XX Million by 2033. It covers the historical period (2019-2024), base year (2025), and forecast period (2025-2033), offering crucial insights for stakeholders across the value chain.
Peas Industry Market Composition & Trends
The global peas industry, valued at $XX Million in 2024, exhibits a moderately concentrated market structure. Key players such as Solina Group, Archer Daniels Midland, Ingredion, Cargill, and Roquette hold significant market share, though the precise distribution remains dynamic due to ongoing M&A activity and the emergence of smaller, specialized players. Innovation in pea protein extraction and processing, driven by the growing demand for plant-based alternatives, is a key trend. Regulatory landscapes vary across regions, influencing production and labeling standards. Substitute products like other pulses and protein sources exert competitive pressure, while the end-user profile is diversifying beyond traditional food applications into feed and biofuel sectors. Recent M&A activity has been valued at approximately $XX Million in the past five years, mostly focused on consolidating processing and distribution capabilities.
- Market Share Distribution (2024): Cargill (XX%), Roquette (XX%), ADM (XX%), Ingredion (XX%), Solina (XX%), Others (XX%). (Note: These percentages are estimated)
- M&A Deal Values (2019-2024): Approximately $XX Million
- Key Innovation Catalysts: Plant-based protein demand, improved extraction technologies, functional food ingredients
Peas Industry Evolution
The peas industry has witnessed significant growth over the past five years (2019-2024), driven primarily by the increasing consumer preference for plant-based foods and the expanding applications of pea protein and starch in various industries. The annual growth rate during this period averaged XX%, and we project a continued, though potentially moderated, expansion during the forecast period (2025-2033), with an anticipated CAGR of XX%. Technological advancements, such as improved processing techniques and the development of new pea varieties with enhanced yields and disease resistance, are contributing to increased efficiency and production capacity. Consumer demand shifts towards healthier, more sustainable food options are further bolstering market growth. This includes a rising interest in organic and non-GMO pea products. The adoption rate of pea protein in food products has increased by XX% in the last three years, and a similar trend is observed for pea starch in various industrial applications.
Leading Regions, Countries, or Segments in Peas Industry
The North American and European regions dominate the global peas industry, driven by high consumer demand for plant-based foods and the presence of significant processing and manufacturing facilities. Within product types, pea protein and pea starch are experiencing the fastest growth, fueled by their versatility and functionality. The food sector remains the largest end-use segment, though the feed and biofuel sectors offer significant growth potential.
Key Drivers in North America & Europe:
- High consumer demand for plant-based protein and sustainable food options.
- Strong investment in research and development of new pea varieties and processing technologies.
- Established supply chains and processing infrastructure.
- Favorable regulatory environment for plant-based food products.
Dominance Factors: Large consumer base, established infrastructure, favorable regulatory environments, high investment in R&D. Specific country-level data reveals the USA and Canada lead in North America, while France and Germany lead in Europe. (Precise market share data by country will be provided in the full report)
Peas Industry Product Innovations
Recent innovations have focused on enhancing the functionality and nutritional value of pea-based products. This includes the development of new pea protein isolates with improved solubility and emulsification properties, and pea starches with tailored viscosity profiles for specific applications. These innovations address market demands for clean-label ingredients and enhanced product performance in various food and industrial applications. For example, Roquette's launch of organic pea ingredients in 2022 directly addresses the growing demand for organic options.
Propelling Factors for Peas Industry Growth
The peas industry's growth is propelled by a confluence of factors: the burgeoning global demand for plant-based proteins, driven by health and sustainability concerns; technological advancements leading to more efficient and cost-effective pea processing; and increasing government support for sustainable agriculture and the development of new, high-yielding pea varieties. Furthermore, expanding applications of pea ingredients in food, feed, and biofuel sectors contribute significantly to market expansion.
Obstacles in the Peas Industry Market
Challenges include fluctuating raw material prices, potential supply chain disruptions due to climatic factors impacting crop yields, and intense competition from other plant-based protein sources. Regulatory changes and differing standards across regions can also pose hurdles for global players. These factors could potentially restrain the market's growth rate, though technological advancements and diversification into new markets could mitigate these risks.
Future Opportunities in Peas Industry
Future opportunities lie in expanding into new markets, particularly in developing economies with rising consumer incomes and growing demand for affordable and nutritious food. Advancements in processing technologies could unlock new applications for pea-based ingredients in cosmetics, pharmaceuticals, and other sectors. The increasing focus on sustainability will also drive the demand for organic and sustainably sourced pea products.
Major Players in the Peas Industry Ecosystem
- Solina Group
- Archer Daniels Midland
- Ingredion
- Cargill
- Roquette
Key Developments in Peas Industry Industry
- October 2022: Roquette launched a new line of organic pea ingredients (starch and protein) in North America and Europe.
- September 2022: Release of new high-yielding pea varieties (PBA Noosa and PBA Taylor) by Agriculture Victoria.
- March 2022: Birsa Agriculture University developed a new pest and disease-resistant pea variety (Birsa Matar-1) in India.
Strategic Peas Industry Market Forecast
The global peas industry is poised for continued expansion, driven by strong demand for plant-based proteins and the increasing versatility of pea-based ingredients. Opportunities in new markets, particularly in developing economies, and technological advancements will further fuel this growth. While challenges remain, innovative solutions and strategic partnerships will play a crucial role in shaping the industry's future trajectory. We project a steady rise in market value, exceeding $XX Million by 2033.
Peas Industry Segmentation
- 1. Production Analysis
- 2. Consumption Analysis
- 3. Import Market Analysis (Value & Volume)
- 4. Export Market Analysis (Value & Volume)
- 5. Price Trend Analysis
Peas Industry Segmentation By Geography
-
1. North America
- 1.1. United States
- 1.2. Canada
-
2. Europe
- 2.1. Russia
- 2.2. United Kingdom
- 2.3. France
- 2.4. Ukraine
-
3. Asia Pacific
- 3.1. China
- 3.2. Australia
- 3.3. India
-
4. South America
- 4.1. Brazil
- 4.2. Argentina
-
5. Africa
- 5.1. South Africa
- 5.2. Egypt
Peas Industry Regional Market Share
Geographic Coverage of Peas Industry
Peas Industry REPORT HIGHLIGHTS
| Aspects | Details |
|---|---|
| Study Period | 2020-2034 |
| Base Year | 2025 |
| Estimated Year | 2026 |
| Forecast Period | 2026-2034 |
| Historical Period | 2020-2025 |
| Growth Rate | CAGR of 4.30% from 2020-2034 |
| Segmentation |
|
Table of Contents
- 1. Introduction
- 1.1. Research Scope
- 1.2. Market Segmentation
- 1.3. Research Objective
- 1.4. Definitions and Assumptions
- 2. Executive Summary
- 2.1. Market Snapshot
- 3. Market Dynamics
- 3.1. Market Drivers
- 3.2. Market Restrains
- 3.3. Market Trends
- 3.4. Market Opportunities
- 4. Market Factor Analysis
- 4.1. Porters Five Forces
- 4.1.1. Bargaining Power of Suppliers
- 4.1.2. Bargaining Power of Buyers
- 4.1.3. Threat of New Entrants
- 4.1.4. Threat of Substitutes
- 4.1.5. Competitive Rivalry
- 4.2. PESTEL analysis
- 4.3. BCG Analysis
- 4.3.1. Stars (High Growth, High Market Share)
- 4.3.2. Cash Cows (Low Growth, High Market Share)
- 4.3.3. Question Mark (High Growth, Low Market Share)
- 4.3.4. Dogs (Low Growth, Low Market Share)
- 4.4. Ansoff Matrix Analysis
- 4.5. Supply Chain Analysis
- 4.6. Regulatory Landscape
- 4.7. Current Market Potential and Opportunity Assessment (TAM–SAM–SOM Framework)
- 4.8. DMV Analyst Note
- 4.1. Porters Five Forces
- 5. Market Analysis, Insights and Forecast 2021-2033
- 5.1. Market Analysis, Insights and Forecast - by Production Analysis
- 5.2. Market Analysis, Insights and Forecast - by Consumption Analysis
- 5.3. Market Analysis, Insights and Forecast - by Import Market Analysis (Value & Volume)
- 5.4. Market Analysis, Insights and Forecast - by Export Market Analysis (Value & Volume)
- 5.5. Market Analysis, Insights and Forecast - by Price Trend Analysis
- 5.6. Market Analysis, Insights and Forecast - by Region
- 5.6.1. North America
- 5.6.2. Europe
- 5.6.3. Asia Pacific
- 5.6.4. South America
- 5.6.5. Africa
- 6. Global Peas Industry Analysis, Insights and Forecast, 2021-2033
- 6.1. Market Analysis, Insights and Forecast - by Production Analysis
- 6.2. Market Analysis, Insights and Forecast - by Consumption Analysis
- 6.3. Market Analysis, Insights and Forecast - by Import Market Analysis (Value & Volume)
- 6.4. Market Analysis, Insights and Forecast - by Export Market Analysis (Value & Volume)
- 6.5. Market Analysis, Insights and Forecast - by Price Trend Analysis
- 7. North America Peas Industry Analysis, Insights and Forecast, 2020-2032
- 7.1. Market Analysis, Insights and Forecast - by Production Analysis
- 7.2. Market Analysis, Insights and Forecast - by Consumption Analysis
- 7.3. Market Analysis, Insights and Forecast - by Import Market Analysis (Value & Volume)
- 7.4. Market Analysis, Insights and Forecast - by Export Market Analysis (Value & Volume)
- 7.5. Market Analysis, Insights and Forecast - by Price Trend Analysis
- 8. Europe Peas Industry Analysis, Insights and Forecast, 2020-2032
- 8.1. Market Analysis, Insights and Forecast - by Production Analysis
- 8.2. Market Analysis, Insights and Forecast - by Consumption Analysis
- 8.3. Market Analysis, Insights and Forecast - by Import Market Analysis (Value & Volume)
- 8.4. Market Analysis, Insights and Forecast - by Export Market Analysis (Value & Volume)
- 8.5. Market Analysis, Insights and Forecast - by Price Trend Analysis
- 9. Asia Pacific Peas Industry Analysis, Insights and Forecast, 2020-2032
- 9.1. Market Analysis, Insights and Forecast - by Production Analysis
- 9.2. Market Analysis, Insights and Forecast - by Consumption Analysis
- 9.3. Market Analysis, Insights and Forecast - by Import Market Analysis (Value & Volume)
- 9.4. Market Analysis, Insights and Forecast - by Export Market Analysis (Value & Volume)
- 9.5. Market Analysis, Insights and Forecast - by Price Trend Analysis
- 10. South America Peas Industry Analysis, Insights and Forecast, 2020-2032
- 10.1. Market Analysis, Insights and Forecast - by Production Analysis
- 10.2. Market Analysis, Insights and Forecast - by Consumption Analysis
- 10.3. Market Analysis, Insights and Forecast - by Import Market Analysis (Value & Volume)
- 10.4. Market Analysis, Insights and Forecast - by Export Market Analysis (Value & Volume)
- 10.5. Market Analysis, Insights and Forecast - by Price Trend Analysis
- 11. Africa Peas Industry Analysis, Insights and Forecast, 2020-2032
- 11.1. Market Analysis, Insights and Forecast - by Production Analysis
- 11.2. Market Analysis, Insights and Forecast - by Consumption Analysis
- 11.3. Market Analysis, Insights and Forecast - by Import Market Analysis (Value & Volume)
- 11.4. Market Analysis, Insights and Forecast - by Export Market Analysis (Value & Volume)
- 11.5. Market Analysis, Insights and Forecast - by Price Trend Analysis
- 12. Competitive Analysis
- 12.1. Company Profiles
- 12.1.1 Solina Group
- 12.1.1.1. Company Overview
- 12.1.1.2. Products
- 12.1.1.3. Company Financials
- 12.1.1.4. SWOT Analysis
- 12.1.2 Archer Daniels Midland
- 12.1.2.1. Company Overview
- 12.1.2.2. Products
- 12.1.2.3. Company Financials
- 12.1.2.4. SWOT Analysis
- 12.1.3 Ingredion
- 12.1.3.1. Company Overview
- 12.1.3.2. Products
- 12.1.3.3. Company Financials
- 12.1.3.4. SWOT Analysis
- 12.1.4 Cargill
- 12.1.4.1. Company Overview
- 12.1.4.2. Products
- 12.1.4.3. Company Financials
- 12.1.4.4. SWOT Analysis
- 12.1.5 Roquette
- 12.1.5.1. Company Overview
- 12.1.5.2. Products
- 12.1.5.3. Company Financials
- 12.1.5.4. SWOT Analysis
- 12.1.1 Solina Group
- 12.2. Market Entropy
- 12.2.1 Company's Key Areas Served
- 12.2.2 Recent Developments
- 12.3. Company Market Share Analysis 2025
- 12.3.1 Top 5 Companies Market Share Analysis
- 12.3.2 Top 3 Companies Market Share Analysis
- 12.4. List of Potential Customers
- 13. Research Methodology
List of Figures
- Figure 1: Global Peas Industry Revenue Breakdown (Million, %) by Region 2025 & 2033
- Figure 2: Global Peas Industry Volume Breakdown (Kiloton, %) by Region 2025 & 2033
- Figure 3: North America Peas Industry Revenue (Million), by Production Analysis 2025 & 2033
- Figure 4: North America Peas Industry Volume (Kiloton), by Production Analysis 2025 & 2033
- Figure 5: North America Peas Industry Revenue Share (%), by Production Analysis 2025 & 2033
- Figure 6: North America Peas Industry Volume Share (%), by Production Analysis 2025 & 2033
- Figure 7: North America Peas Industry Revenue (Million), by Consumption Analysis 2025 & 2033
- Figure 8: North America Peas Industry Volume (Kiloton), by Consumption Analysis 2025 & 2033
- Figure 9: North America Peas Industry Revenue Share (%), by Consumption Analysis 2025 & 2033
- Figure 10: North America Peas Industry Volume Share (%), by Consumption Analysis 2025 & 2033
- Figure 11: North America Peas Industry Revenue (Million), by Import Market Analysis (Value & Volume) 2025 & 2033
- Figure 12: North America Peas Industry Volume (Kiloton), by Import Market Analysis (Value & Volume) 2025 & 2033
- Figure 13: North America Peas Industry Revenue Share (%), by Import Market Analysis (Value & Volume) 2025 & 2033
- Figure 14: North America Peas Industry Volume Share (%), by Import Market Analysis (Value & Volume) 2025 & 2033
- Figure 15: North America Peas Industry Revenue (Million), by Export Market Analysis (Value & Volume) 2025 & 2033
- Figure 16: North America Peas Industry Volume (Kiloton), by Export Market Analysis (Value & Volume) 2025 & 2033
- Figure 17: North America Peas Industry Revenue Share (%), by Export Market Analysis (Value & Volume) 2025 & 2033
- Figure 18: North America Peas Industry Volume Share (%), by Export Market Analysis (Value & Volume) 2025 & 2033
- Figure 19: North America Peas Industry Revenue (Million), by Price Trend Analysis 2025 & 2033
- Figure 20: North America Peas Industry Volume (Kiloton), by Price Trend Analysis 2025 & 2033
- Figure 21: North America Peas Industry Revenue Share (%), by Price Trend Analysis 2025 & 2033
- Figure 22: North America Peas Industry Volume Share (%), by Price Trend Analysis 2025 & 2033
- Figure 23: North America Peas Industry Revenue (Million), by Country 2025 & 2033
- Figure 24: North America Peas Industry Volume (Kiloton), by Country 2025 & 2033
- Figure 25: North America Peas Industry Revenue Share (%), by Country 2025 & 2033
- Figure 26: North America Peas Industry Volume Share (%), by Country 2025 & 2033
- Figure 27: Europe Peas Industry Revenue (Million), by Production Analysis 2025 & 2033
- Figure 28: Europe Peas Industry Volume (Kiloton), by Production Analysis 2025 & 2033
- Figure 29: Europe Peas Industry Revenue Share (%), by Production Analysis 2025 & 2033
- Figure 30: Europe Peas Industry Volume Share (%), by Production Analysis 2025 & 2033
- Figure 31: Europe Peas Industry Revenue (Million), by Consumption Analysis 2025 & 2033
- Figure 32: Europe Peas Industry Volume (Kiloton), by Consumption Analysis 2025 & 2033
- Figure 33: Europe Peas Industry Revenue Share (%), by Consumption Analysis 2025 & 2033
- Figure 34: Europe Peas Industry Volume Share (%), by Consumption Analysis 2025 & 2033
- Figure 35: Europe Peas Industry Revenue (Million), by Import Market Analysis (Value & Volume) 2025 & 2033
- Figure 36: Europe Peas Industry Volume (Kiloton), by Import Market Analysis (Value & Volume) 2025 & 2033
- Figure 37: Europe Peas Industry Revenue Share (%), by Import Market Analysis (Value & Volume) 2025 & 2033
- Figure 38: Europe Peas Industry Volume Share (%), by Import Market Analysis (Value & Volume) 2025 & 2033
- Figure 39: Europe Peas Industry Revenue (Million), by Export Market Analysis (Value & Volume) 2025 & 2033
- Figure 40: Europe Peas Industry Volume (Kiloton), by Export Market Analysis (Value & Volume) 2025 & 2033
- Figure 41: Europe Peas Industry Revenue Share (%), by Export Market Analysis (Value & Volume) 2025 & 2033
- Figure 42: Europe Peas Industry Volume Share (%), by Export Market Analysis (Value & Volume) 2025 & 2033
- Figure 43: Europe Peas Industry Revenue (Million), by Price Trend Analysis 2025 & 2033
- Figure 44: Europe Peas Industry Volume (Kiloton), by Price Trend Analysis 2025 & 2033
- Figure 45: Europe Peas Industry Revenue Share (%), by Price Trend Analysis 2025 & 2033
- Figure 46: Europe Peas Industry Volume Share (%), by Price Trend Analysis 2025 & 2033
- Figure 47: Europe Peas Industry Revenue (Million), by Country 2025 & 2033
- Figure 48: Europe Peas Industry Volume (Kiloton), by Country 2025 & 2033
- Figure 49: Europe Peas Industry Revenue Share (%), by Country 2025 & 2033
- Figure 50: Europe Peas Industry Volume Share (%), by Country 2025 & 2033
- Figure 51: Asia Pacific Peas Industry Revenue (Million), by Production Analysis 2025 & 2033
- Figure 52: Asia Pacific Peas Industry Volume (Kiloton), by Production Analysis 2025 & 2033
- Figure 53: Asia Pacific Peas Industry Revenue Share (%), by Production Analysis 2025 & 2033
- Figure 54: Asia Pacific Peas Industry Volume Share (%), by Production Analysis 2025 & 2033
- Figure 55: Asia Pacific Peas Industry Revenue (Million), by Consumption Analysis 2025 & 2033
- Figure 56: Asia Pacific Peas Industry Volume (Kiloton), by Consumption Analysis 2025 & 2033
- Figure 57: Asia Pacific Peas Industry Revenue Share (%), by Consumption Analysis 2025 & 2033
- Figure 58: Asia Pacific Peas Industry Volume Share (%), by Consumption Analysis 2025 & 2033
- Figure 59: Asia Pacific Peas Industry Revenue (Million), by Import Market Analysis (Value & Volume) 2025 & 2033
- Figure 60: Asia Pacific Peas Industry Volume (Kiloton), by Import Market Analysis (Value & Volume) 2025 & 2033
- Figure 61: Asia Pacific Peas Industry Revenue Share (%), by Import Market Analysis (Value & Volume) 2025 & 2033
- Figure 62: Asia Pacific Peas Industry Volume Share (%), by Import Market Analysis (Value & Volume) 2025 & 2033
- Figure 63: Asia Pacific Peas Industry Revenue (Million), by Export Market Analysis (Value & Volume) 2025 & 2033
- Figure 64: Asia Pacific Peas Industry Volume (Kiloton), by Export Market Analysis (Value & Volume) 2025 & 2033
- Figure 65: Asia Pacific Peas Industry Revenue Share (%), by Export Market Analysis (Value & Volume) 2025 & 2033
- Figure 66: Asia Pacific Peas Industry Volume Share (%), by Export Market Analysis (Value & Volume) 2025 & 2033
- Figure 67: Asia Pacific Peas Industry Revenue (Million), by Price Trend Analysis 2025 & 2033
- Figure 68: Asia Pacific Peas Industry Volume (Kiloton), by Price Trend Analysis 2025 & 2033
- Figure 69: Asia Pacific Peas Industry Revenue Share (%), by Price Trend Analysis 2025 & 2033
- Figure 70: Asia Pacific Peas Industry Volume Share (%), by Price Trend Analysis 2025 & 2033
- Figure 71: Asia Pacific Peas Industry Revenue (Million), by Country 2025 & 2033
- Figure 72: Asia Pacific Peas Industry Volume (Kiloton), by Country 2025 & 2033
- Figure 73: Asia Pacific Peas Industry Revenue Share (%), by Country 2025 & 2033
- Figure 74: Asia Pacific Peas Industry Volume Share (%), by Country 2025 & 2033
- Figure 75: South America Peas Industry Revenue (Million), by Production Analysis 2025 & 2033
- Figure 76: South America Peas Industry Volume (Kiloton), by Production Analysis 2025 & 2033
- Figure 77: South America Peas Industry Revenue Share (%), by Production Analysis 2025 & 2033
- Figure 78: South America Peas Industry Volume Share (%), by Production Analysis 2025 & 2033
- Figure 79: South America Peas Industry Revenue (Million), by Consumption Analysis 2025 & 2033
- Figure 80: South America Peas Industry Volume (Kiloton), by Consumption Analysis 2025 & 2033
- Figure 81: South America Peas Industry Revenue Share (%), by Consumption Analysis 2025 & 2033
- Figure 82: South America Peas Industry Volume Share (%), by Consumption Analysis 2025 & 2033
- Figure 83: South America Peas Industry Revenue (Million), by Import Market Analysis (Value & Volume) 2025 & 2033
- Figure 84: South America Peas Industry Volume (Kiloton), by Import Market Analysis (Value & Volume) 2025 & 2033
- Figure 85: South America Peas Industry Revenue Share (%), by Import Market Analysis (Value & Volume) 2025 & 2033
- Figure 86: South America Peas Industry Volume Share (%), by Import Market Analysis (Value & Volume) 2025 & 2033
- Figure 87: South America Peas Industry Revenue (Million), by Export Market Analysis (Value & Volume) 2025 & 2033
- Figure 88: South America Peas Industry Volume (Kiloton), by Export Market Analysis (Value & Volume) 2025 & 2033
- Figure 89: South America Peas Industry Revenue Share (%), by Export Market Analysis (Value & Volume) 2025 & 2033
- Figure 90: South America Peas Industry Volume Share (%), by Export Market Analysis (Value & Volume) 2025 & 2033
- Figure 91: South America Peas Industry Revenue (Million), by Price Trend Analysis 2025 & 2033
- Figure 92: South America Peas Industry Volume (Kiloton), by Price Trend Analysis 2025 & 2033
- Figure 93: South America Peas Industry Revenue Share (%), by Price Trend Analysis 2025 & 2033
- Figure 94: South America Peas Industry Volume Share (%), by Price Trend Analysis 2025 & 2033
- Figure 95: South America Peas Industry Revenue (Million), by Country 2025 & 2033
- Figure 96: South America Peas Industry Volume (Kiloton), by Country 2025 & 2033
- Figure 97: South America Peas Industry Revenue Share (%), by Country 2025 & 2033
- Figure 98: South America Peas Industry Volume Share (%), by Country 2025 & 2033
- Figure 99: Africa Peas Industry Revenue (Million), by Production Analysis 2025 & 2033
- Figure 100: Africa Peas Industry Volume (Kiloton), by Production Analysis 2025 & 2033
- Figure 101: Africa Peas Industry Revenue Share (%), by Production Analysis 2025 & 2033
- Figure 102: Africa Peas Industry Volume Share (%), by Production Analysis 2025 & 2033
- Figure 103: Africa Peas Industry Revenue (Million), by Consumption Analysis 2025 & 2033
- Figure 104: Africa Peas Industry Volume (Kiloton), by Consumption Analysis 2025 & 2033
- Figure 105: Africa Peas Industry Revenue Share (%), by Consumption Analysis 2025 & 2033
- Figure 106: Africa Peas Industry Volume Share (%), by Consumption Analysis 2025 & 2033
- Figure 107: Africa Peas Industry Revenue (Million), by Import Market Analysis (Value & Volume) 2025 & 2033
- Figure 108: Africa Peas Industry Volume (Kiloton), by Import Market Analysis (Value & Volume) 2025 & 2033
- Figure 109: Africa Peas Industry Revenue Share (%), by Import Market Analysis (Value & Volume) 2025 & 2033
- Figure 110: Africa Peas Industry Volume Share (%), by Import Market Analysis (Value & Volume) 2025 & 2033
- Figure 111: Africa Peas Industry Revenue (Million), by Export Market Analysis (Value & Volume) 2025 & 2033
- Figure 112: Africa Peas Industry Volume (Kiloton), by Export Market Analysis (Value & Volume) 2025 & 2033
- Figure 113: Africa Peas Industry Revenue Share (%), by Export Market Analysis (Value & Volume) 2025 & 2033
- Figure 114: Africa Peas Industry Volume Share (%), by Export Market Analysis (Value & Volume) 2025 & 2033
- Figure 115: Africa Peas Industry Revenue (Million), by Price Trend Analysis 2025 & 2033
- Figure 116: Africa Peas Industry Volume (Kiloton), by Price Trend Analysis 2025 & 2033
- Figure 117: Africa Peas Industry Revenue Share (%), by Price Trend Analysis 2025 & 2033
- Figure 118: Africa Peas Industry Volume Share (%), by Price Trend Analysis 2025 & 2033
- Figure 119: Africa Peas Industry Revenue (Million), by Country 2025 & 2033
- Figure 120: Africa Peas Industry Volume (Kiloton), by Country 2025 & 2033
- Figure 121: Africa Peas Industry Revenue Share (%), by Country 2025 & 2033
- Figure 122: Africa Peas Industry Volume Share (%), by Country 2025 & 2033
List of Tables
- Table 1: Global Peas Industry Revenue Million Forecast, by Production Analysis 2020 & 2033
- Table 2: Global Peas Industry Volume Kiloton Forecast, by Production Analysis 2020 & 2033
- Table 3: Global Peas Industry Revenue Million Forecast, by Consumption Analysis 2020 & 2033
- Table 4: Global Peas Industry Volume Kiloton Forecast, by Consumption Analysis 2020 & 2033
- Table 5: Global Peas Industry Revenue Million Forecast, by Import Market Analysis (Value & Volume) 2020 & 2033
- Table 6: Global Peas Industry Volume Kiloton Forecast, by Import Market Analysis (Value & Volume) 2020 & 2033
- Table 7: Global Peas Industry Revenue Million Forecast, by Export Market Analysis (Value & Volume) 2020 & 2033
- Table 8: Global Peas Industry Volume Kiloton Forecast, by Export Market Analysis (Value & Volume) 2020 & 2033
- Table 9: Global Peas Industry Revenue Million Forecast, by Price Trend Analysis 2020 & 2033
- Table 10: Global Peas Industry Volume Kiloton Forecast, by Price Trend Analysis 2020 & 2033
- Table 11: Global Peas Industry Revenue Million Forecast, by Region 2020 & 2033
- Table 12: Global Peas Industry Volume Kiloton Forecast, by Region 2020 & 2033
- Table 13: Global Peas Industry Revenue Million Forecast, by Production Analysis 2020 & 2033
- Table 14: Global Peas Industry Volume Kiloton Forecast, by Production Analysis 2020 & 2033
- Table 15: Global Peas Industry Revenue Million Forecast, by Consumption Analysis 2020 & 2033
- Table 16: Global Peas Industry Volume Kiloton Forecast, by Consumption Analysis 2020 & 2033
- Table 17: Global Peas Industry Revenue Million Forecast, by Import Market Analysis (Value & Volume) 2020 & 2033
- Table 18: Global Peas Industry Volume Kiloton Forecast, by Import Market Analysis (Value & Volume) 2020 & 2033
- Table 19: Global Peas Industry Revenue Million Forecast, by Export Market Analysis (Value & Volume) 2020 & 2033
- Table 20: Global Peas Industry Volume Kiloton Forecast, by Export Market Analysis (Value & Volume) 2020 & 2033
- Table 21: Global Peas Industry Revenue Million Forecast, by Price Trend Analysis 2020 & 2033
- Table 22: Global Peas Industry Volume Kiloton Forecast, by Price Trend Analysis 2020 & 2033
- Table 23: Global Peas Industry Revenue Million Forecast, by Country 2020 & 2033
- Table 24: Global Peas Industry Volume Kiloton Forecast, by Country 2020 & 2033
- Table 25: United States Peas Industry Revenue (Million) Forecast, by Application 2020 & 2033
- Table 26: United States Peas Industry Volume (Kiloton) Forecast, by Application 2020 & 2033
- Table 27: Canada Peas Industry Revenue (Million) Forecast, by Application 2020 & 2033
- Table 28: Canada Peas Industry Volume (Kiloton) Forecast, by Application 2020 & 2033
- Table 29: Global Peas Industry Revenue Million Forecast, by Production Analysis 2020 & 2033
- Table 30: Global Peas Industry Volume Kiloton Forecast, by Production Analysis 2020 & 2033
- Table 31: Global Peas Industry Revenue Million Forecast, by Consumption Analysis 2020 & 2033
- Table 32: Global Peas Industry Volume Kiloton Forecast, by Consumption Analysis 2020 & 2033
- Table 33: Global Peas Industry Revenue Million Forecast, by Import Market Analysis (Value & Volume) 2020 & 2033
- Table 34: Global Peas Industry Volume Kiloton Forecast, by Import Market Analysis (Value & Volume) 2020 & 2033
- Table 35: Global Peas Industry Revenue Million Forecast, by Export Market Analysis (Value & Volume) 2020 & 2033
- Table 36: Global Peas Industry Volume Kiloton Forecast, by Export Market Analysis (Value & Volume) 2020 & 2033
- Table 37: Global Peas Industry Revenue Million Forecast, by Price Trend Analysis 2020 & 2033
- Table 38: Global Peas Industry Volume Kiloton Forecast, by Price Trend Analysis 2020 & 2033
- Table 39: Global Peas Industry Revenue Million Forecast, by Country 2020 & 2033
- Table 40: Global Peas Industry Volume Kiloton Forecast, by Country 2020 & 2033
- Table 41: Russia Peas Industry Revenue (Million) Forecast, by Application 2020 & 2033
- Table 42: Russia Peas Industry Volume (Kiloton) Forecast, by Application 2020 & 2033
- Table 43: United Kingdom Peas Industry Revenue (Million) Forecast, by Application 2020 & 2033
- Table 44: United Kingdom Peas Industry Volume (Kiloton) Forecast, by Application 2020 & 2033
- Table 45: France Peas Industry Revenue (Million) Forecast, by Application 2020 & 2033
- Table 46: France Peas Industry Volume (Kiloton) Forecast, by Application 2020 & 2033
- Table 47: Ukraine Peas Industry Revenue (Million) Forecast, by Application 2020 & 2033
- Table 48: Ukraine Peas Industry Volume (Kiloton) Forecast, by Application 2020 & 2033
- Table 49: Global Peas Industry Revenue Million Forecast, by Production Analysis 2020 & 2033
- Table 50: Global Peas Industry Volume Kiloton Forecast, by Production Analysis 2020 & 2033
- Table 51: Global Peas Industry Revenue Million Forecast, by Consumption Analysis 2020 & 2033
- Table 52: Global Peas Industry Volume Kiloton Forecast, by Consumption Analysis 2020 & 2033
- Table 53: Global Peas Industry Revenue Million Forecast, by Import Market Analysis (Value & Volume) 2020 & 2033
- Table 54: Global Peas Industry Volume Kiloton Forecast, by Import Market Analysis (Value & Volume) 2020 & 2033
- Table 55: Global Peas Industry Revenue Million Forecast, by Export Market Analysis (Value & Volume) 2020 & 2033
- Table 56: Global Peas Industry Volume Kiloton Forecast, by Export Market Analysis (Value & Volume) 2020 & 2033
- Table 57: Global Peas Industry Revenue Million Forecast, by Price Trend Analysis 2020 & 2033
- Table 58: Global Peas Industry Volume Kiloton Forecast, by Price Trend Analysis 2020 & 2033
- Table 59: Global Peas Industry Revenue Million Forecast, by Country 2020 & 2033
- Table 60: Global Peas Industry Volume Kiloton Forecast, by Country 2020 & 2033
- Table 61: China Peas Industry Revenue (Million) Forecast, by Application 2020 & 2033
- Table 62: China Peas Industry Volume (Kiloton) Forecast, by Application 2020 & 2033
- Table 63: Australia Peas Industry Revenue (Million) Forecast, by Application 2020 & 2033
- Table 64: Australia Peas Industry Volume (Kiloton) Forecast, by Application 2020 & 2033
- Table 65: India Peas Industry Revenue (Million) Forecast, by Application 2020 & 2033
- Table 66: India Peas Industry Volume (Kiloton) Forecast, by Application 2020 & 2033
- Table 67: Global Peas Industry Revenue Million Forecast, by Production Analysis 2020 & 2033
- Table 68: Global Peas Industry Volume Kiloton Forecast, by Production Analysis 2020 & 2033
- Table 69: Global Peas Industry Revenue Million Forecast, by Consumption Analysis 2020 & 2033
- Table 70: Global Peas Industry Volume Kiloton Forecast, by Consumption Analysis 2020 & 2033
- Table 71: Global Peas Industry Revenue Million Forecast, by Import Market Analysis (Value & Volume) 2020 & 2033
- Table 72: Global Peas Industry Volume Kiloton Forecast, by Import Market Analysis (Value & Volume) 2020 & 2033
- Table 73: Global Peas Industry Revenue Million Forecast, by Export Market Analysis (Value & Volume) 2020 & 2033
- Table 74: Global Peas Industry Volume Kiloton Forecast, by Export Market Analysis (Value & Volume) 2020 & 2033
- Table 75: Global Peas Industry Revenue Million Forecast, by Price Trend Analysis 2020 & 2033
- Table 76: Global Peas Industry Volume Kiloton Forecast, by Price Trend Analysis 2020 & 2033
- Table 77: Global Peas Industry Revenue Million Forecast, by Country 2020 & 2033
- Table 78: Global Peas Industry Volume Kiloton Forecast, by Country 2020 & 2033
- Table 79: Brazil Peas Industry Revenue (Million) Forecast, by Application 2020 & 2033
- Table 80: Brazil Peas Industry Volume (Kiloton) Forecast, by Application 2020 & 2033
- Table 81: Argentina Peas Industry Revenue (Million) Forecast, by Application 2020 & 2033
- Table 82: Argentina Peas Industry Volume (Kiloton) Forecast, by Application 2020 & 2033
- Table 83: Global Peas Industry Revenue Million Forecast, by Production Analysis 2020 & 2033
- Table 84: Global Peas Industry Volume Kiloton Forecast, by Production Analysis 2020 & 2033
- Table 85: Global Peas Industry Revenue Million Forecast, by Consumption Analysis 2020 & 2033
- Table 86: Global Peas Industry Volume Kiloton Forecast, by Consumption Analysis 2020 & 2033
- Table 87: Global Peas Industry Revenue Million Forecast, by Import Market Analysis (Value & Volume) 2020 & 2033
- Table 88: Global Peas Industry Volume Kiloton Forecast, by Import Market Analysis (Value & Volume) 2020 & 2033
- Table 89: Global Peas Industry Revenue Million Forecast, by Export Market Analysis (Value & Volume) 2020 & 2033
- Table 90: Global Peas Industry Volume Kiloton Forecast, by Export Market Analysis (Value & Volume) 2020 & 2033
- Table 91: Global Peas Industry Revenue Million Forecast, by Price Trend Analysis 2020 & 2033
- Table 92: Global Peas Industry Volume Kiloton Forecast, by Price Trend Analysis 2020 & 2033
- Table 93: Global Peas Industry Revenue Million Forecast, by Country 2020 & 2033
- Table 94: Global Peas Industry Volume Kiloton Forecast, by Country 2020 & 2033
- Table 95: South Africa Peas Industry Revenue (Million) Forecast, by Application 2020 & 2033
- Table 96: South Africa Peas Industry Volume (Kiloton) Forecast, by Application 2020 & 2033
- Table 97: Egypt Peas Industry Revenue (Million) Forecast, by Application 2020 & 2033
- Table 98: Egypt Peas Industry Volume (Kiloton) Forecast, by Application 2020 & 2033
Frequently Asked Questions
1. What is the projected Compound Annual Growth Rate (CAGR) of the Peas Industry?
The projected CAGR is approximately 4.30%.
2. Which companies are prominent players in the Peas Industry?
Key companies in the market include Solina Group, Archer Daniels Midland, Ingredion, Cargill , Roquette .
3. What are the main segments of the Peas Industry?
The market segments include Production Analysis, Consumption Analysis, Import Market Analysis (Value & Volume), Export Market Analysis (Value & Volume), Price Trend Analysis.
4. Can you provide details about the market size?
The market size is estimated to be USD XXX Million as of 2022.
5. What are some drivers contributing to market growth?
Rising Consumption of Cashew Nuts in the Country; Favorable Government Initiatives.
6. What are the notable trends driving market growth?
Growing Demand for Pea Protein Consumption.
7. Are there any restraints impacting market growth?
Hazardous Climatic Condition Hinders Cashew Production; Stringent Regulations Related to Food Quality Standards.
8. Can you provide examples of recent developments in the market?
October 2022: Roquette, a global leader in plant-based ingredients and a pioneer of plant proteins, launched a new line of organic pea ingredients, organic pea starch, and organic pea protein in the North American and Europe markets to meet customer demand.
9. What pricing options are available for accessing the report?
Pricing options include single-user, multi-user, and enterprise licenses priced at USD 4750, USD 5250, and USD 8750 respectively.
10. Is the market size provided in terms of value or volume?
The market size is provided in terms of value, measured in Million and volume, measured in Kiloton.
11. Are there any specific market keywords associated with the report?
Yes, the market keyword associated with the report is "Peas Industry," which aids in identifying and referencing the specific market segment covered.
12. How do I determine which pricing option suits my needs best?
The pricing options vary based on user requirements and access needs. Individual users may opt for single-user licenses, while businesses requiring broader access may choose multi-user or enterprise licenses for cost-effective access to the report.
13. Are there any additional resources or data provided in the Peas Industry report?
While the report offers comprehensive insights, it's advisable to review the specific contents or supplementary materials provided to ascertain if additional resources or data are available.
14. How can I stay updated on further developments or reports in the Peas Industry?
To stay informed about further developments, trends, and reports in the Peas Industry, consider subscribing to industry newsletters, following relevant companies and organizations, or regularly checking reputable industry news sources and publications.
Methodology
Step 1 - Identification of Relevant Samples Size from Population Database


Step 2 - Approaches for Defining Global Market Size (Value, Volume* & Price*)

Note*: In applicable scenarios
Step 3 - Data Sources
Primary Research
- Web Analytics
- Survey Reports
- Research Institute
- Latest Research Reports
- Opinion Leaders
Secondary Research
- Annual Reports
- White Paper
- Latest Press Release
- Industry Association
- Paid Database
- Investor Presentations

Step 4 - Data Triangulation
Involves using different sources of information in order to increase the validity of a study
These sources are likely to be stakeholders in a program - participants, other researchers, program staff, other community members, and so on.
Then we put all data in single framework & apply various statistical tools to find out the dynamic on the market.
During the analysis stage, feedback from the stakeholder groups would be compared to determine areas of agreement as well as areas of divergence