

Key Insights
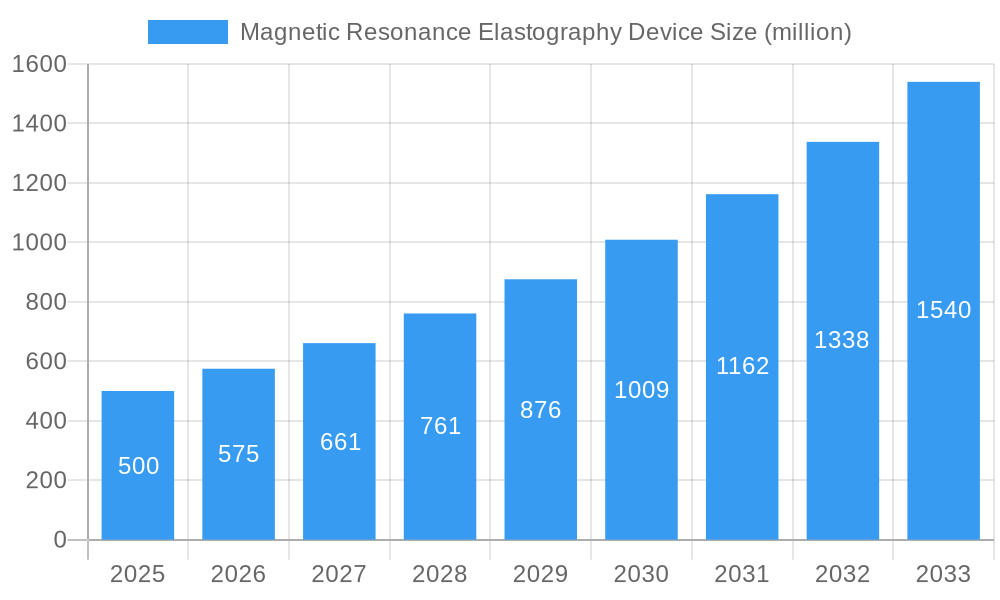
The global Magnetic Resonance Elastography (MRE) device market is experiencing robust growth, driven by the increasing prevalence of liver diseases, the rising demand for non-invasive diagnostic tools, and advancements in MRE technology leading to improved image quality and diagnostic accuracy. The market, currently estimated at $500 million in 2025, is projected to achieve a Compound Annual Growth Rate (CAGR) of 15% from 2025 to 2033, reaching a market value exceeding $1.5 billion by 2033. Key drivers include the growing geriatric population susceptible to liver fibrosis and cirrhosis, the increasing adoption of MRE in clinical settings due to its superior capabilities in detecting and staging liver diseases compared to traditional methods, and ongoing research and development efforts focused on improving the speed, affordability, and accessibility of MRE technology. Major players such as Fujifilm, Siemens, Hitachi, GE Healthcare, and others are actively investing in research and development, expanding their product portfolios, and strategically acquiring smaller companies to gain a competitive edge in this rapidly expanding market. However, the high cost of MRE equipment and procedures, the limited availability of trained professionals proficient in interpreting MRE images, and the potential for variations in image quality due to patient-specific factors remain as significant restraints.
Magnetic Resonance Elastography Device Market Size (In Million)
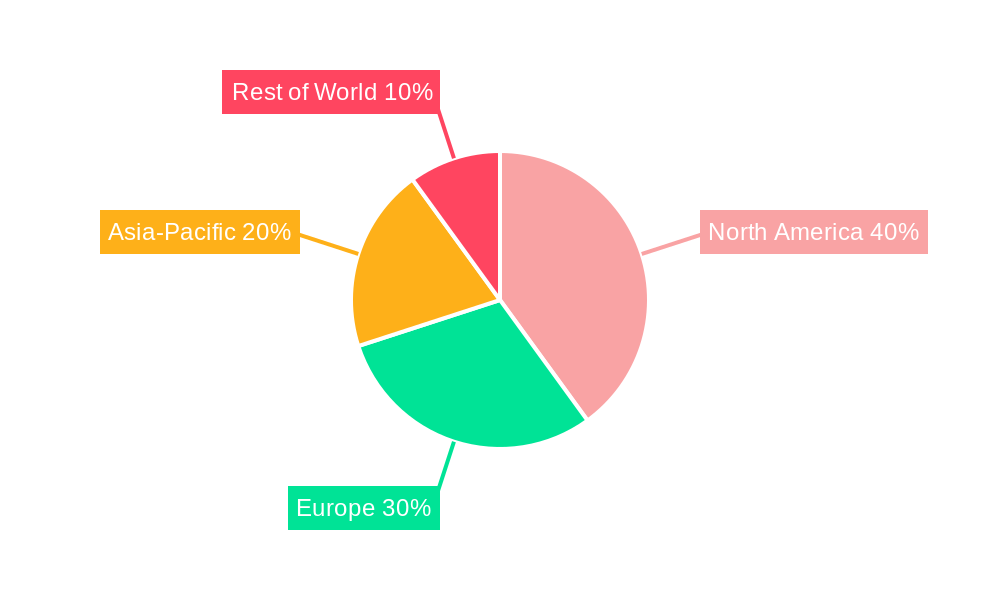
The segmentation of the MRE device market reveals strong growth across various regions, with North America and Europe currently dominating the market share due to advanced healthcare infrastructure and high adoption rates. However, the Asia-Pacific region is expected to witness significant growth in the coming years, driven by increasing healthcare spending and rising awareness of liver diseases. The market is segmented by device type (e.g., dedicated MRE systems vs. integrated systems), application (liver disease diagnosis, breast cancer detection, and others), and end-user (hospitals, clinics, and research centers). Future growth will be significantly influenced by technological advancements, including the development of faster and more accurate imaging techniques, the integration of artificial intelligence for improved image analysis, and the expansion of reimbursement policies to facilitate wider accessibility of MRE technology. This will ultimately lead to increased market penetration and adoption across various healthcare settings globally.
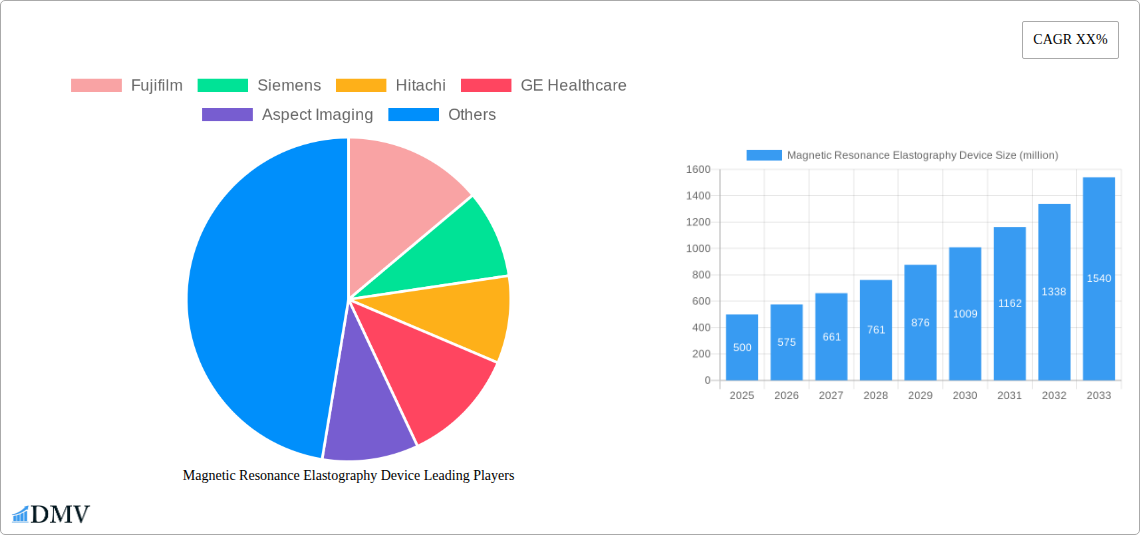
Magnetic Resonance Elastography Device Company Market Share
Magnetic Resonance Elastography (MRE) Device Market Report: 2019-2033
This comprehensive report provides a detailed analysis of the global Magnetic Resonance Elastography (MRE) Device market, offering invaluable insights for stakeholders seeking to understand market dynamics, technological advancements, and future opportunities. The report covers the period from 2019 to 2033, with a base year of 2025 and a forecast period of 2025-2033. The market is projected to reach xx million USD by 2033, demonstrating substantial growth potential.
Magnetic Resonance Elastography Device Market Composition & Trends
The global Magnetic Resonance Elastography (MRE) Device market is characterized by moderate concentration, with key players like Fujifilm, Siemens, Hitachi, GE Healthcare, Aspect Imaging, Hologic, Philips, Mindray, ESAOTE, Sanrad Medical Systems, and Anke High-tec holding significant market share. The market's evolution is driven by continuous innovation in MRE technology, coupled with increasing demand for non-invasive diagnostic tools across various medical applications. The regulatory landscape plays a crucial role, with varying approvals and reimbursement policies impacting market penetration in different regions. Substitute products, primarily conventional imaging techniques like ultrasound and CT scans, present competition. However, MRE's unique capabilities in assessing tissue stiffness, particularly in liver disease diagnosis, provide a significant advantage. End-users predominantly include hospitals, diagnostic imaging centers, and research institutions. The M&A landscape has seen moderate activity, with deal values totaling approximately xx million USD in the historical period (2019-2024), primarily focused on strengthening technological capabilities and market reach.
- Market Share Distribution (2025): Fujifilm (xx%), Siemens (xx%), GE Healthcare (xx%), Others (xx%).
- M&A Deal Value (2019-2024): Approximately xx million USD.
- Key Innovation Catalysts: Advancements in MRI technology, development of novel contrast agents, and improved software algorithms.
- Regulatory Landscape: Varying approval processes and reimbursement policies across different geographies.
Magnetic Resonance Elastography Device Industry Evolution
The MRE device market has experienced steady growth since 2019, fueled by technological advancements and increasing awareness of its clinical benefits. The historical period (2019-2024) saw a Compound Annual Growth Rate (CAGR) of xx%, driven by factors such as rising prevalence of liver diseases, increasing adoption of minimally invasive diagnostic procedures, and the launch of advanced MRE systems with enhanced image quality and faster acquisition times. The market is expected to maintain robust growth throughout the forecast period (2025-2033), with a projected CAGR of xx%. This growth is propelled by the increasing demand for accurate and non-invasive diagnostic tools for various applications like liver fibrosis assessment, breast cancer detection, and brain tumor characterization. Consumer demand shifts towards more accurate, faster, and user-friendly systems are influencing technological advancements. The adoption rate of MRE technology is increasing steadily across different healthcare settings, reflecting growing confidence in its diagnostic capabilities.
Leading Regions, Countries, or Segments in Magnetic Resonance Elastography Device
North America currently dominates the global MRE device market, driven by factors such as high healthcare expenditure, robust regulatory support, and a high prevalence of chronic liver diseases. The region's dominance is further strengthened by its strong presence of key players and advanced research infrastructure.
- Key Drivers in North America:
- High healthcare expenditure and insurance coverage
- Strong regulatory support and approvals
- High prevalence of chronic liver diseases and other target conditions
- Presence of major market players and research institutions.
- Dominance Factors: Early adoption of MRE technology, well-established healthcare infrastructure, and significant investments in medical research and development have all contributed to North America's leadership in the MRE device market. The region's strong regulatory framework and favorable reimbursement policies also play a crucial role.
Magnetic Resonance Elastography Device Product Innovations
Recent product innovations in MRE devices include advancements in MRI hardware and software, leading to improved image quality, faster acquisition times, and enhanced user-friendliness. These innovations allow for more accurate and efficient tissue characterization, expanding the range of clinical applications. Furthermore, the development of novel contrast agents and improved algorithms enable better visualization of tissue stiffness, further improving diagnostic accuracy. Key selling points for manufacturers now include high resolution imaging, reduced scan times, user-friendly interfaces, and advanced data analysis capabilities.
Propelling Factors for Magnetic Resonance Elastography Device Growth
Several key factors are driving the growth of the MRE device market. Technological advancements, including improved image quality and faster acquisition times, are significantly increasing the adoption of this technology. The growing prevalence of chronic liver diseases, a major application of MRE, is also a strong growth driver. Favorable regulatory support and increasing reimbursements in various regions facilitate market penetration. Furthermore, increasing awareness among healthcare professionals about the benefits of MRE is contributing to market expansion.
Obstacles in the Magnetic Resonance Elastography Device Market
Despite its potential, the MRE device market faces several challenges. High cost of equipment and procedures remains a barrier to widespread adoption, particularly in resource-constrained settings. The complexity of the technology and the need for specialized expertise to operate and interpret MRE scans can also limit market penetration. Competition from established imaging modalities like ultrasound and CT scans presents another challenge. Finally, variations in regulatory pathways and reimbursement policies across different geographies can hinder market expansion.
Future Opportunities in Magnetic Resonance Elastography Device
Future opportunities for the MRE device market lie in the expansion into new applications, such as the diagnosis and monitoring of other diseases beyond liver fibrosis. Technological advancements, including the development of portable and cost-effective MRE systems, will significantly expand market access. The increasing integration of MRE with other imaging modalities and AI-driven diagnostic tools holds substantial promise for enhancing clinical workflows and diagnostic accuracy. Finally, expanding market penetration in emerging economies presents considerable growth opportunities.
Major Players in the Magnetic Resonance Elastography Device Ecosystem
- Fujifilm
- Siemens
- Hitachi
- GE Healthcare
- Aspect Imaging
- Hologic
- Philips
- Mindray
- ESAOTE
- Sanrad Medical Systems
- Anke High-tec
Key Developments in Magnetic Resonance Elastography Device Industry
- 2022-Q4: Fujifilm launches a new MRE system with improved image resolution.
- 2023-Q1: Siemens announces a strategic partnership to expand MRE applications in oncology.
- 2023-Q2: GE Healthcare receives FDA approval for a new MRE contrast agent. (Further updates to be added as available)
Strategic Magnetic Resonance Elastography Device Market Forecast
The MRE device market is poised for significant growth in the coming years, driven by technological advancements, expanding clinical applications, and increasing awareness among healthcare professionals. The development of more affordable and user-friendly systems, coupled with the potential for AI-driven image analysis, will further accelerate market adoption. The market is expected to witness substantial growth, particularly in emerging markets with increasing healthcare infrastructure development and rising prevalence of chronic diseases. This robust outlook positions MRE as a promising diagnostic tool with considerable long-term market potential.
Magnetic Resonance Elastography Device Segmentation
-
1. Application
- 1.1. Hospitals
- 1.2. Diagnostic Imaging Centers
-
2. Types
- 2.1. Radiology
- 2.2. Cardiology
- 2.3. Urology
- 2.4. Obstetrics
Magnetic Resonance Elastography Device Segmentation By Geography
-
1. North America
- 1.1. United States
- 1.2. Canada
- 1.3. Mexico
-
2. South America
- 2.1. Brazil
- 2.2. Argentina
- 2.3. Rest of South America
-
3. Europe
- 3.1. United Kingdom
- 3.2. Germany
- 3.3. France
- 3.4. Italy
- 3.5. Spain
- 3.6. Russia
- 3.7. Benelux
- 3.8. Nordics
- 3.9. Rest of Europe
-
4. Middle East & Africa
- 4.1. Turkey
- 4.2. Israel
- 4.3. GCC
- 4.4. North Africa
- 4.5. South Africa
- 4.6. Rest of Middle East & Africa
-
5. Asia Pacific
- 5.1. China
- 5.2. India
- 5.3. Japan
- 5.4. South Korea
- 5.5. ASEAN
- 5.6. Oceania
- 5.7. Rest of Asia Pacific
Magnetic Resonance Elastography Device Regional Market Share
Geographic Coverage of Magnetic Resonance Elastography Device
Magnetic Resonance Elastography Device REPORT HIGHLIGHTS
| Aspects | Details |
|---|---|
| Study Period | 2020-2034 |
| Base Year | 2025 |
| Estimated Year | 2026 |
| Forecast Period | 2026-2034 |
| Historical Period | 2020-2025 |
| Growth Rate | CAGR of 6.38% from 2020-2034 |
| Segmentation |
|
Table of Contents
- 1. Introduction
- 1.1. Research Scope
- 1.2. Market Segmentation
- 1.3. Research Methodology
- 1.4. Definitions and Assumptions
- 2. Executive Summary
- 2.1. Introduction
- 3. Market Dynamics
- 3.1. Introduction
- 3.2. Market Drivers
- 3.3. Market Restrains
- 3.4. Market Trends
- 4. Market Factor Analysis
- 4.1. Porters Five Forces
- 4.2. Supply/Value Chain
- 4.3. PESTEL analysis
- 4.4. Market Entropy
- 4.5. Patent/Trademark Analysis
- 5. Global Magnetic Resonance Elastography Device Analysis, Insights and Forecast, 2020-2032
- 5.1. Market Analysis, Insights and Forecast - by Application
- 5.1.1. Hospitals
- 5.1.2. Diagnostic Imaging Centers
- 5.2. Market Analysis, Insights and Forecast - by Types
- 5.2.1. Radiology
- 5.2.2. Cardiology
- 5.2.3. Urology
- 5.2.4. Obstetrics
- 5.3. Market Analysis, Insights and Forecast - by Region
- 5.3.1. North America
- 5.3.2. South America
- 5.3.3. Europe
- 5.3.4. Middle East & Africa
- 5.3.5. Asia Pacific
- 5.1. Market Analysis, Insights and Forecast - by Application
- 6. North America Magnetic Resonance Elastography Device Analysis, Insights and Forecast, 2020-2032
- 6.1. Market Analysis, Insights and Forecast - by Application
- 6.1.1. Hospitals
- 6.1.2. Diagnostic Imaging Centers
- 6.2. Market Analysis, Insights and Forecast - by Types
- 6.2.1. Radiology
- 6.2.2. Cardiology
- 6.2.3. Urology
- 6.2.4. Obstetrics
- 6.1. Market Analysis, Insights and Forecast - by Application
- 7. South America Magnetic Resonance Elastography Device Analysis, Insights and Forecast, 2020-2032
- 7.1. Market Analysis, Insights and Forecast - by Application
- 7.1.1. Hospitals
- 7.1.2. Diagnostic Imaging Centers
- 7.2. Market Analysis, Insights and Forecast - by Types
- 7.2.1. Radiology
- 7.2.2. Cardiology
- 7.2.3. Urology
- 7.2.4. Obstetrics
- 7.1. Market Analysis, Insights and Forecast - by Application
- 8. Europe Magnetic Resonance Elastography Device Analysis, Insights and Forecast, 2020-2032
- 8.1. Market Analysis, Insights and Forecast - by Application
- 8.1.1. Hospitals
- 8.1.2. Diagnostic Imaging Centers
- 8.2. Market Analysis, Insights and Forecast - by Types
- 8.2.1. Radiology
- 8.2.2. Cardiology
- 8.2.3. Urology
- 8.2.4. Obstetrics
- 8.1. Market Analysis, Insights and Forecast - by Application
- 9. Middle East & Africa Magnetic Resonance Elastography Device Analysis, Insights and Forecast, 2020-2032
- 9.1. Market Analysis, Insights and Forecast - by Application
- 9.1.1. Hospitals
- 9.1.2. Diagnostic Imaging Centers
- 9.2. Market Analysis, Insights and Forecast - by Types
- 9.2.1. Radiology
- 9.2.2. Cardiology
- 9.2.3. Urology
- 9.2.4. Obstetrics
- 9.1. Market Analysis, Insights and Forecast - by Application
- 10. Asia Pacific Magnetic Resonance Elastography Device Analysis, Insights and Forecast, 2020-2032
- 10.1. Market Analysis, Insights and Forecast - by Application
- 10.1.1. Hospitals
- 10.1.2. Diagnostic Imaging Centers
- 10.2. Market Analysis, Insights and Forecast - by Types
- 10.2.1. Radiology
- 10.2.2. Cardiology
- 10.2.3. Urology
- 10.2.4. Obstetrics
- 10.1. Market Analysis, Insights and Forecast - by Application
- 11. Competitive Analysis
- 11.1. Global Market Share Analysis 2025
- 11.2. Company Profiles
- 11.2.1 Fujifilm
- 11.2.1.1. Overview
- 11.2.1.2. Products
- 11.2.1.3. SWOT Analysis
- 11.2.1.4. Recent Developments
- 11.2.1.5. Financials (Based on Availability)
- 11.2.2 Siemens
- 11.2.2.1. Overview
- 11.2.2.2. Products
- 11.2.2.3. SWOT Analysis
- 11.2.2.4. Recent Developments
- 11.2.2.5. Financials (Based on Availability)
- 11.2.3 Hitachi
- 11.2.3.1. Overview
- 11.2.3.2. Products
- 11.2.3.3. SWOT Analysis
- 11.2.3.4. Recent Developments
- 11.2.3.5. Financials (Based on Availability)
- 11.2.4 GE Healthcare
- 11.2.4.1. Overview
- 11.2.4.2. Products
- 11.2.4.3. SWOT Analysis
- 11.2.4.4. Recent Developments
- 11.2.4.5. Financials (Based on Availability)
- 11.2.5 Aspect Imaging
- 11.2.5.1. Overview
- 11.2.5.2. Products
- 11.2.5.3. SWOT Analysis
- 11.2.5.4. Recent Developments
- 11.2.5.5. Financials (Based on Availability)
- 11.2.6 Hologic
- 11.2.6.1. Overview
- 11.2.6.2. Products
- 11.2.6.3. SWOT Analysis
- 11.2.6.4. Recent Developments
- 11.2.6.5. Financials (Based on Availability)
- 11.2.7 Philips
- 11.2.7.1. Overview
- 11.2.7.2. Products
- 11.2.7.3. SWOT Analysis
- 11.2.7.4. Recent Developments
- 11.2.7.5. Financials (Based on Availability)
- 11.2.8 Mindray
- 11.2.8.1. Overview
- 11.2.8.2. Products
- 11.2.8.3. SWOT Analysis
- 11.2.8.4. Recent Developments
- 11.2.8.5. Financials (Based on Availability)
- 11.2.9 ESAOTE
- 11.2.9.1. Overview
- 11.2.9.2. Products
- 11.2.9.3. SWOT Analysis
- 11.2.9.4. Recent Developments
- 11.2.9.5. Financials (Based on Availability)
- 11.2.10 Sanrad Medical Systems
- 11.2.10.1. Overview
- 11.2.10.2. Products
- 11.2.10.3. SWOT Analysis
- 11.2.10.4. Recent Developments
- 11.2.10.5. Financials (Based on Availability)
- 11.2.11 Anke High-tec
- 11.2.11.1. Overview
- 11.2.11.2. Products
- 11.2.11.3. SWOT Analysis
- 11.2.11.4. Recent Developments
- 11.2.11.5. Financials (Based on Availability)
- 11.2.1 Fujifilm
List of Figures
- Figure 1: Global Magnetic Resonance Elastography Device Revenue Breakdown (undefined, %) by Region 2025 & 2033
- Figure 2: Global Magnetic Resonance Elastography Device Volume Breakdown (K, %) by Region 2025 & 2033
- Figure 3: North America Magnetic Resonance Elastography Device Revenue (undefined), by Application 2025 & 2033
- Figure 4: North America Magnetic Resonance Elastography Device Volume (K), by Application 2025 & 2033
- Figure 5: North America Magnetic Resonance Elastography Device Revenue Share (%), by Application 2025 & 2033
- Figure 6: North America Magnetic Resonance Elastography Device Volume Share (%), by Application 2025 & 2033
- Figure 7: North America Magnetic Resonance Elastography Device Revenue (undefined), by Types 2025 & 2033
- Figure 8: North America Magnetic Resonance Elastography Device Volume (K), by Types 2025 & 2033
- Figure 9: North America Magnetic Resonance Elastography Device Revenue Share (%), by Types 2025 & 2033
- Figure 10: North America Magnetic Resonance Elastography Device Volume Share (%), by Types 2025 & 2033
- Figure 11: North America Magnetic Resonance Elastography Device Revenue (undefined), by Country 2025 & 2033
- Figure 12: North America Magnetic Resonance Elastography Device Volume (K), by Country 2025 & 2033
- Figure 13: North America Magnetic Resonance Elastography Device Revenue Share (%), by Country 2025 & 2033
- Figure 14: North America Magnetic Resonance Elastography Device Volume Share (%), by Country 2025 & 2033
- Figure 15: South America Magnetic Resonance Elastography Device Revenue (undefined), by Application 2025 & 2033
- Figure 16: South America Magnetic Resonance Elastography Device Volume (K), by Application 2025 & 2033
- Figure 17: South America Magnetic Resonance Elastography Device Revenue Share (%), by Application 2025 & 2033
- Figure 18: South America Magnetic Resonance Elastography Device Volume Share (%), by Application 2025 & 2033
- Figure 19: South America Magnetic Resonance Elastography Device Revenue (undefined), by Types 2025 & 2033
- Figure 20: South America Magnetic Resonance Elastography Device Volume (K), by Types 2025 & 2033
- Figure 21: South America Magnetic Resonance Elastography Device Revenue Share (%), by Types 2025 & 2033
- Figure 22: South America Magnetic Resonance Elastography Device Volume Share (%), by Types 2025 & 2033
- Figure 23: South America Magnetic Resonance Elastography Device Revenue (undefined), by Country 2025 & 2033
- Figure 24: South America Magnetic Resonance Elastography Device Volume (K), by Country 2025 & 2033
- Figure 25: South America Magnetic Resonance Elastography Device Revenue Share (%), by Country 2025 & 2033
- Figure 26: South America Magnetic Resonance Elastography Device Volume Share (%), by Country 2025 & 2033
- Figure 27: Europe Magnetic Resonance Elastography Device Revenue (undefined), by Application 2025 & 2033
- Figure 28: Europe Magnetic Resonance Elastography Device Volume (K), by Application 2025 & 2033
- Figure 29: Europe Magnetic Resonance Elastography Device Revenue Share (%), by Application 2025 & 2033
- Figure 30: Europe Magnetic Resonance Elastography Device Volume Share (%), by Application 2025 & 2033
- Figure 31: Europe Magnetic Resonance Elastography Device Revenue (undefined), by Types 2025 & 2033
- Figure 32: Europe Magnetic Resonance Elastography Device Volume (K), by Types 2025 & 2033
- Figure 33: Europe Magnetic Resonance Elastography Device Revenue Share (%), by Types 2025 & 2033
- Figure 34: Europe Magnetic Resonance Elastography Device Volume Share (%), by Types 2025 & 2033
- Figure 35: Europe Magnetic Resonance Elastography Device Revenue (undefined), by Country 2025 & 2033
- Figure 36: Europe Magnetic Resonance Elastography Device Volume (K), by Country 2025 & 2033
- Figure 37: Europe Magnetic Resonance Elastography Device Revenue Share (%), by Country 2025 & 2033
- Figure 38: Europe Magnetic Resonance Elastography Device Volume Share (%), by Country 2025 & 2033
- Figure 39: Middle East & Africa Magnetic Resonance Elastography Device Revenue (undefined), by Application 2025 & 2033
- Figure 40: Middle East & Africa Magnetic Resonance Elastography Device Volume (K), by Application 2025 & 2033
- Figure 41: Middle East & Africa Magnetic Resonance Elastography Device Revenue Share (%), by Application 2025 & 2033
- Figure 42: Middle East & Africa Magnetic Resonance Elastography Device Volume Share (%), by Application 2025 & 2033
- Figure 43: Middle East & Africa Magnetic Resonance Elastography Device Revenue (undefined), by Types 2025 & 2033
- Figure 44: Middle East & Africa Magnetic Resonance Elastography Device Volume (K), by Types 2025 & 2033
- Figure 45: Middle East & Africa Magnetic Resonance Elastography Device Revenue Share (%), by Types 2025 & 2033
- Figure 46: Middle East & Africa Magnetic Resonance Elastography Device Volume Share (%), by Types 2025 & 2033
- Figure 47: Middle East & Africa Magnetic Resonance Elastography Device Revenue (undefined), by Country 2025 & 2033
- Figure 48: Middle East & Africa Magnetic Resonance Elastography Device Volume (K), by Country 2025 & 2033
- Figure 49: Middle East & Africa Magnetic Resonance Elastography Device Revenue Share (%), by Country 2025 & 2033
- Figure 50: Middle East & Africa Magnetic Resonance Elastography Device Volume Share (%), by Country 2025 & 2033
- Figure 51: Asia Pacific Magnetic Resonance Elastography Device Revenue (undefined), by Application 2025 & 2033
- Figure 52: Asia Pacific Magnetic Resonance Elastography Device Volume (K), by Application 2025 & 2033
- Figure 53: Asia Pacific Magnetic Resonance Elastography Device Revenue Share (%), by Application 2025 & 2033
- Figure 54: Asia Pacific Magnetic Resonance Elastography Device Volume Share (%), by Application 2025 & 2033
- Figure 55: Asia Pacific Magnetic Resonance Elastography Device Revenue (undefined), by Types 2025 & 2033
- Figure 56: Asia Pacific Magnetic Resonance Elastography Device Volume (K), by Types 2025 & 2033
- Figure 57: Asia Pacific Magnetic Resonance Elastography Device Revenue Share (%), by Types 2025 & 2033
- Figure 58: Asia Pacific Magnetic Resonance Elastography Device Volume Share (%), by Types 2025 & 2033
- Figure 59: Asia Pacific Magnetic Resonance Elastography Device Revenue (undefined), by Country 2025 & 2033
- Figure 60: Asia Pacific Magnetic Resonance Elastography Device Volume (K), by Country 2025 & 2033
- Figure 61: Asia Pacific Magnetic Resonance Elastography Device Revenue Share (%), by Country 2025 & 2033
- Figure 62: Asia Pacific Magnetic Resonance Elastography Device Volume Share (%), by Country 2025 & 2033
List of Tables
- Table 1: Global Magnetic Resonance Elastography Device Revenue undefined Forecast, by Application 2020 & 2033
- Table 2: Global Magnetic Resonance Elastography Device Volume K Forecast, by Application 2020 & 2033
- Table 3: Global Magnetic Resonance Elastography Device Revenue undefined Forecast, by Types 2020 & 2033
- Table 4: Global Magnetic Resonance Elastography Device Volume K Forecast, by Types 2020 & 2033
- Table 5: Global Magnetic Resonance Elastography Device Revenue undefined Forecast, by Region 2020 & 2033
- Table 6: Global Magnetic Resonance Elastography Device Volume K Forecast, by Region 2020 & 2033
- Table 7: Global Magnetic Resonance Elastography Device Revenue undefined Forecast, by Application 2020 & 2033
- Table 8: Global Magnetic Resonance Elastography Device Volume K Forecast, by Application 2020 & 2033
- Table 9: Global Magnetic Resonance Elastography Device Revenue undefined Forecast, by Types 2020 & 2033
- Table 10: Global Magnetic Resonance Elastography Device Volume K Forecast, by Types 2020 & 2033
- Table 11: Global Magnetic Resonance Elastography Device Revenue undefined Forecast, by Country 2020 & 2033
- Table 12: Global Magnetic Resonance Elastography Device Volume K Forecast, by Country 2020 & 2033
- Table 13: United States Magnetic Resonance Elastography Device Revenue (undefined) Forecast, by Application 2020 & 2033
- Table 14: United States Magnetic Resonance Elastography Device Volume (K) Forecast, by Application 2020 & 2033
- Table 15: Canada Magnetic Resonance Elastography Device Revenue (undefined) Forecast, by Application 2020 & 2033
- Table 16: Canada Magnetic Resonance Elastography Device Volume (K) Forecast, by Application 2020 & 2033
- Table 17: Mexico Magnetic Resonance Elastography Device Revenue (undefined) Forecast, by Application 2020 & 2033
- Table 18: Mexico Magnetic Resonance Elastography Device Volume (K) Forecast, by Application 2020 & 2033
- Table 19: Global Magnetic Resonance Elastography Device Revenue undefined Forecast, by Application 2020 & 2033
- Table 20: Global Magnetic Resonance Elastography Device Volume K Forecast, by Application 2020 & 2033
- Table 21: Global Magnetic Resonance Elastography Device Revenue undefined Forecast, by Types 2020 & 2033
- Table 22: Global Magnetic Resonance Elastography Device Volume K Forecast, by Types 2020 & 2033
- Table 23: Global Magnetic Resonance Elastography Device Revenue undefined Forecast, by Country 2020 & 2033
- Table 24: Global Magnetic Resonance Elastography Device Volume K Forecast, by Country 2020 & 2033
- Table 25: Brazil Magnetic Resonance Elastography Device Revenue (undefined) Forecast, by Application 2020 & 2033
- Table 26: Brazil Magnetic Resonance Elastography Device Volume (K) Forecast, by Application 2020 & 2033
- Table 27: Argentina Magnetic Resonance Elastography Device Revenue (undefined) Forecast, by Application 2020 & 2033
- Table 28: Argentina Magnetic Resonance Elastography Device Volume (K) Forecast, by Application 2020 & 2033
- Table 29: Rest of South America Magnetic Resonance Elastography Device Revenue (undefined) Forecast, by Application 2020 & 2033
- Table 30: Rest of South America Magnetic Resonance Elastography Device Volume (K) Forecast, by Application 2020 & 2033
- Table 31: Global Magnetic Resonance Elastography Device Revenue undefined Forecast, by Application 2020 & 2033
- Table 32: Global Magnetic Resonance Elastography Device Volume K Forecast, by Application 2020 & 2033
- Table 33: Global Magnetic Resonance Elastography Device Revenue undefined Forecast, by Types 2020 & 2033
- Table 34: Global Magnetic Resonance Elastography Device Volume K Forecast, by Types 2020 & 2033
- Table 35: Global Magnetic Resonance Elastography Device Revenue undefined Forecast, by Country 2020 & 2033
- Table 36: Global Magnetic Resonance Elastography Device Volume K Forecast, by Country 2020 & 2033
- Table 37: United Kingdom Magnetic Resonance Elastography Device Revenue (undefined) Forecast, by Application 2020 & 2033
- Table 38: United Kingdom Magnetic Resonance Elastography Device Volume (K) Forecast, by Application 2020 & 2033
- Table 39: Germany Magnetic Resonance Elastography Device Revenue (undefined) Forecast, by Application 2020 & 2033
- Table 40: Germany Magnetic Resonance Elastography Device Volume (K) Forecast, by Application 2020 & 2033
- Table 41: France Magnetic Resonance Elastography Device Revenue (undefined) Forecast, by Application 2020 & 2033
- Table 42: France Magnetic Resonance Elastography Device Volume (K) Forecast, by Application 2020 & 2033
- Table 43: Italy Magnetic Resonance Elastography Device Revenue (undefined) Forecast, by Application 2020 & 2033
- Table 44: Italy Magnetic Resonance Elastography Device Volume (K) Forecast, by Application 2020 & 2033
- Table 45: Spain Magnetic Resonance Elastography Device Revenue (undefined) Forecast, by Application 2020 & 2033
- Table 46: Spain Magnetic Resonance Elastography Device Volume (K) Forecast, by Application 2020 & 2033
- Table 47: Russia Magnetic Resonance Elastography Device Revenue (undefined) Forecast, by Application 2020 & 2033
- Table 48: Russia Magnetic Resonance Elastography Device Volume (K) Forecast, by Application 2020 & 2033
- Table 49: Benelux Magnetic Resonance Elastography Device Revenue (undefined) Forecast, by Application 2020 & 2033
- Table 50: Benelux Magnetic Resonance Elastography Device Volume (K) Forecast, by Application 2020 & 2033
- Table 51: Nordics Magnetic Resonance Elastography Device Revenue (undefined) Forecast, by Application 2020 & 2033
- Table 52: Nordics Magnetic Resonance Elastography Device Volume (K) Forecast, by Application 2020 & 2033
- Table 53: Rest of Europe Magnetic Resonance Elastography Device Revenue (undefined) Forecast, by Application 2020 & 2033
- Table 54: Rest of Europe Magnetic Resonance Elastography Device Volume (K) Forecast, by Application 2020 & 2033
- Table 55: Global Magnetic Resonance Elastography Device Revenue undefined Forecast, by Application 2020 & 2033
- Table 56: Global Magnetic Resonance Elastography Device Volume K Forecast, by Application 2020 & 2033
- Table 57: Global Magnetic Resonance Elastography Device Revenue undefined Forecast, by Types 2020 & 2033
- Table 58: Global Magnetic Resonance Elastography Device Volume K Forecast, by Types 2020 & 2033
- Table 59: Global Magnetic Resonance Elastography Device Revenue undefined Forecast, by Country 2020 & 2033
- Table 60: Global Magnetic Resonance Elastography Device Volume K Forecast, by Country 2020 & 2033
- Table 61: Turkey Magnetic Resonance Elastography Device Revenue (undefined) Forecast, by Application 2020 & 2033
- Table 62: Turkey Magnetic Resonance Elastography Device Volume (K) Forecast, by Application 2020 & 2033
- Table 63: Israel Magnetic Resonance Elastography Device Revenue (undefined) Forecast, by Application 2020 & 2033
- Table 64: Israel Magnetic Resonance Elastography Device Volume (K) Forecast, by Application 2020 & 2033
- Table 65: GCC Magnetic Resonance Elastography Device Revenue (undefined) Forecast, by Application 2020 & 2033
- Table 66: GCC Magnetic Resonance Elastography Device Volume (K) Forecast, by Application 2020 & 2033
- Table 67: North Africa Magnetic Resonance Elastography Device Revenue (undefined) Forecast, by Application 2020 & 2033
- Table 68: North Africa Magnetic Resonance Elastography Device Volume (K) Forecast, by Application 2020 & 2033
- Table 69: South Africa Magnetic Resonance Elastography Device Revenue (undefined) Forecast, by Application 2020 & 2033
- Table 70: South Africa Magnetic Resonance Elastography Device Volume (K) Forecast, by Application 2020 & 2033
- Table 71: Rest of Middle East & Africa Magnetic Resonance Elastography Device Revenue (undefined) Forecast, by Application 2020 & 2033
- Table 72: Rest of Middle East & Africa Magnetic Resonance Elastography Device Volume (K) Forecast, by Application 2020 & 2033
- Table 73: Global Magnetic Resonance Elastography Device Revenue undefined Forecast, by Application 2020 & 2033
- Table 74: Global Magnetic Resonance Elastography Device Volume K Forecast, by Application 2020 & 2033
- Table 75: Global Magnetic Resonance Elastography Device Revenue undefined Forecast, by Types 2020 & 2033
- Table 76: Global Magnetic Resonance Elastography Device Volume K Forecast, by Types 2020 & 2033
- Table 77: Global Magnetic Resonance Elastography Device Revenue undefined Forecast, by Country 2020 & 2033
- Table 78: Global Magnetic Resonance Elastography Device Volume K Forecast, by Country 2020 & 2033
- Table 79: China Magnetic Resonance Elastography Device Revenue (undefined) Forecast, by Application 2020 & 2033
- Table 80: China Magnetic Resonance Elastography Device Volume (K) Forecast, by Application 2020 & 2033
- Table 81: India Magnetic Resonance Elastography Device Revenue (undefined) Forecast, by Application 2020 & 2033
- Table 82: India Magnetic Resonance Elastography Device Volume (K) Forecast, by Application 2020 & 2033
- Table 83: Japan Magnetic Resonance Elastography Device Revenue (undefined) Forecast, by Application 2020 & 2033
- Table 84: Japan Magnetic Resonance Elastography Device Volume (K) Forecast, by Application 2020 & 2033
- Table 85: South Korea Magnetic Resonance Elastography Device Revenue (undefined) Forecast, by Application 2020 & 2033
- Table 86: South Korea Magnetic Resonance Elastography Device Volume (K) Forecast, by Application 2020 & 2033
- Table 87: ASEAN Magnetic Resonance Elastography Device Revenue (undefined) Forecast, by Application 2020 & 2033
- Table 88: ASEAN Magnetic Resonance Elastography Device Volume (K) Forecast, by Application 2020 & 2033
- Table 89: Oceania Magnetic Resonance Elastography Device Revenue (undefined) Forecast, by Application 2020 & 2033
- Table 90: Oceania Magnetic Resonance Elastography Device Volume (K) Forecast, by Application 2020 & 2033
- Table 91: Rest of Asia Pacific Magnetic Resonance Elastography Device Revenue (undefined) Forecast, by Application 2020 & 2033
- Table 92: Rest of Asia Pacific Magnetic Resonance Elastography Device Volume (K) Forecast, by Application 2020 & 2033
Frequently Asked Questions
1. What is the projected Compound Annual Growth Rate (CAGR) of the Magnetic Resonance Elastography Device?
The projected CAGR is approximately 6.38%.
2. Which companies are prominent players in the Magnetic Resonance Elastography Device?
Key companies in the market include Fujifilm, Siemens, Hitachi, GE Healthcare, Aspect Imaging, Hologic, Philips, Mindray, ESAOTE, Sanrad Medical Systems, Anke High-tec.
3. What are the main segments of the Magnetic Resonance Elastography Device?
The market segments include Application, Types.
4. Can you provide details about the market size?
The market size is estimated to be USD XXX N/A as of 2022.
5. What are some drivers contributing to market growth?
N/A
6. What are the notable trends driving market growth?
N/A
7. Are there any restraints impacting market growth?
N/A
8. Can you provide examples of recent developments in the market?
N/A
9. What pricing options are available for accessing the report?
Pricing options include single-user, multi-user, and enterprise licenses priced at USD 4350.00, USD 6525.00, and USD 8700.00 respectively.
10. Is the market size provided in terms of value or volume?
The market size is provided in terms of value, measured in N/A and volume, measured in K.
11. Are there any specific market keywords associated with the report?
Yes, the market keyword associated with the report is "Magnetic Resonance Elastography Device," which aids in identifying and referencing the specific market segment covered.
12. How do I determine which pricing option suits my needs best?
The pricing options vary based on user requirements and access needs. Individual users may opt for single-user licenses, while businesses requiring broader access may choose multi-user or enterprise licenses for cost-effective access to the report.
13. Are there any additional resources or data provided in the Magnetic Resonance Elastography Device report?
While the report offers comprehensive insights, it's advisable to review the specific contents or supplementary materials provided to ascertain if additional resources or data are available.
14. How can I stay updated on further developments or reports in the Magnetic Resonance Elastography Device?
To stay informed about further developments, trends, and reports in the Magnetic Resonance Elastography Device, consider subscribing to industry newsletters, following relevant companies and organizations, or regularly checking reputable industry news sources and publications.
Methodology
Step 1 - Identification of Relevant Samples Size from Population Database


Step 2 - Approaches for Defining Global Market Size (Value, Volume* & Price*)

Note*: In applicable scenarios
Step 3 - Data Sources
Primary Research
- Web Analytics
- Survey Reports
- Research Institute
- Latest Research Reports
- Opinion Leaders
Secondary Research
- Annual Reports
- White Paper
- Latest Press Release
- Industry Association
- Paid Database
- Investor Presentations

Step 4 - Data Triangulation
Involves using different sources of information in order to increase the validity of a study
These sources are likely to be stakeholders in a program - participants, other researchers, program staff, other community members, and so on.
Then we put all data in single framework & apply various statistical tools to find out the dynamic on the market.
During the analysis stage, feedback from the stakeholder groups would be compared to determine areas of agreement as well as areas of divergence