

Key Insights
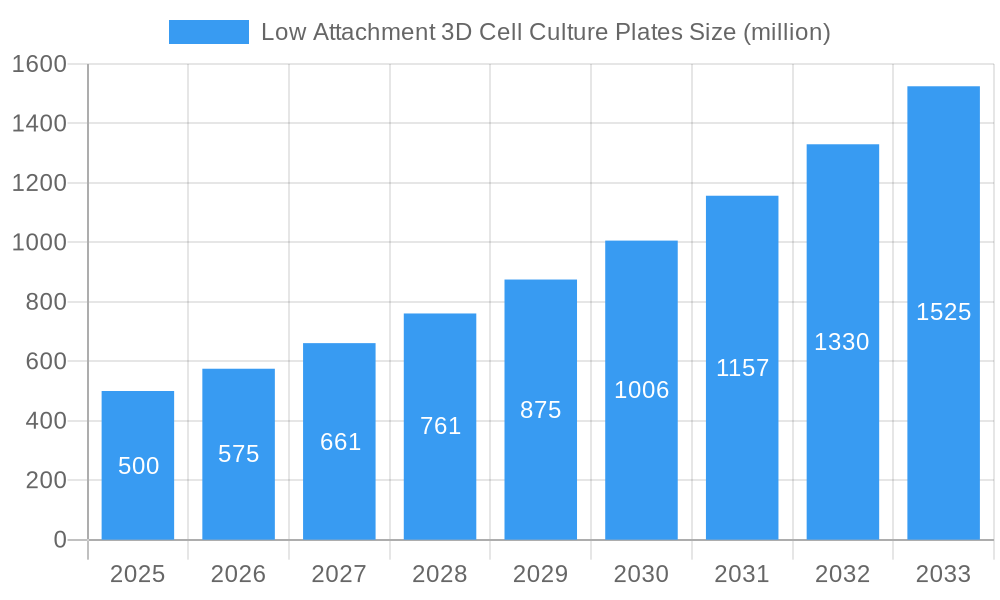
The global market for low attachment 3D cell culture plates is experiencing robust growth, driven by the increasing adoption of 3D cell culture models in drug discovery, toxicology testing, and regenerative medicine. The shift from traditional 2D cell culture to 3D models offers a more physiologically relevant representation of in vivo conditions, leading to more accurate and reliable experimental results. This is fueling demand for specialized plates that minimize cell adhesion, promoting the formation of spherical cell aggregates (spheroids) and organoids crucial for mimicking complex tissue structures. The market is segmented by material type (e.g., hydrogel-coated, ultra-low attachment), application (drug screening, toxicity studies, regenerative medicine), and end-user (pharmaceutical companies, research institutions, contract research organizations). The competitive landscape is characterized by both established players like Corning and Thermo Fisher Scientific and emerging companies focusing on innovative materials and technologies. The high cost of specialized plates and the complexity associated with 3D cell culture techniques represent key restraints, though technological advancements and increasing research funding are mitigating these factors. We estimate a market size of $500 million in 2025, growing at a CAGR of 15% from 2025 to 2033, reaching approximately $1.8 billion by 2033.
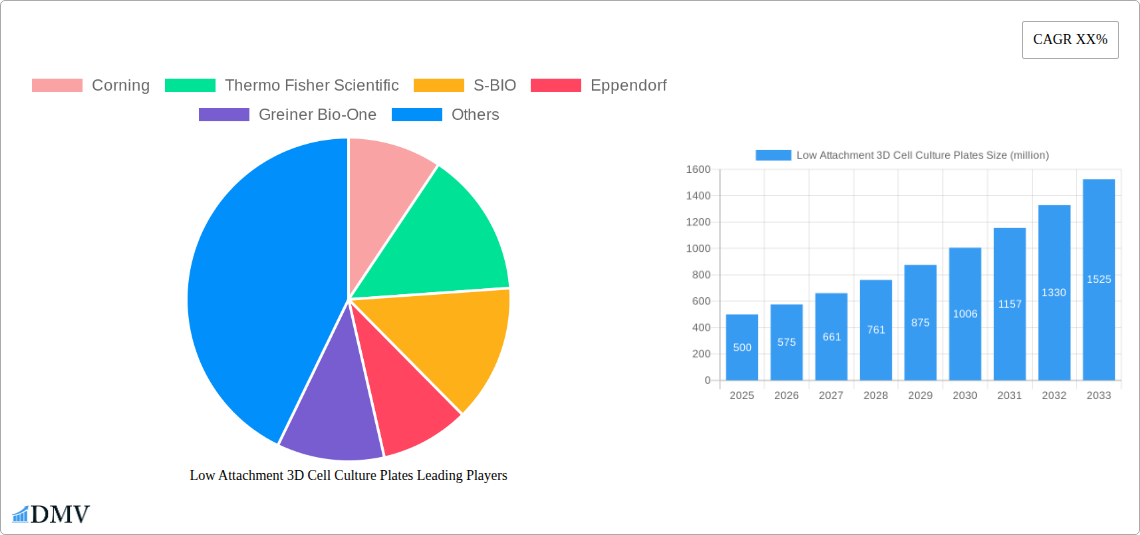
Low Attachment 3D Cell Culture Plates Market Size (In Million)
This significant growth trajectory is propelled by several factors. Firstly, the rising prevalence of chronic diseases is driving increased investment in drug discovery and development, where 3D cell culture plays a vital role. Secondly, advancements in bioprinting and microfluidic technologies are further enhancing the utility and accessibility of 3D cell culture platforms. Thirdly, regulatory agencies are increasingly endorsing the use of 3D models for preclinical studies, further accelerating market expansion. However, challenges remain, including standardization of 3D culture protocols and the need for cost-effective and readily scalable technologies. Companies are actively addressing these challenges through innovative product offerings and collaborations, fostering market growth and paving the way for wider adoption of 3D cell culture techniques.
Low Attachment 3D Cell Culture Plates Company Market Share
Low Attachment 3D Cell Culture Plates Market Report: 2019-2033
This comprehensive report provides a detailed analysis of the global Low Attachment 3D Cell Culture Plates market, projecting a market value exceeding $XX million by 2033. It offers invaluable insights into market dynamics, competitive landscapes, and future growth potential, equipping stakeholders with the knowledge needed to make informed strategic decisions. The report covers the period 2019-2033, with a focus on the 2025-2033 forecast period, leveraging data from the base year 2025 and historical data from 2019-2024. Key players analyzed include Corning, Thermo Fisher Scientific, S-BIO, Eppendorf, Greiner Bio-One, Sarstedt, Ossiform, PHC, InSphero, MatTek, BrandTech Scientific, OMNI Life Science, Biolab, and ReproCELL.
Low Attachment 3D Cell Culture Plates Market Composition & Trends
This section delves into the competitive intensity of the Low Attachment 3D Cell Culture Plates market, examining market share distribution amongst key players. We analyze the influence of innovation, regulatory changes (including anticipated FDA approvals and international standards), the availability of substitute technologies, and the evolving end-user profiles across research institutions, pharmaceutical companies, and biotech firms. Furthermore, the report investigates significant M&A activities within the sector, evaluating the impact of deals valued at millions of dollars on market consolidation and technological advancements.
- Market Share Distribution (2025): Corning (XX%), Thermo Fisher Scientific (XX%), Greiner Bio-One (XX%), Other (XX%). (Note: Exact figures unavailable; estimations provided.)
- M&A Activity (2019-2024): Analysis of at least 3 significant M&A transactions, including deal values (in millions of dollars) and strategic rationale. Examples include [Insert details of at least 3 major M&A activities if available; otherwise replace with "Data not publicly available for specific M&A deals."].
- Regulatory Landscape: Detailed analysis of current regulations and anticipated changes affecting market growth, including specific examples of regulatory approvals or challenges.
- Substitute Products: Exploration of alternative technologies and their impact on market share and future growth projections.
Low Attachment 3D Cell Culture Plates Industry Evolution
This section presents a comprehensive analysis of the Low Attachment 3D Cell Culture Plates market's growth trajectory. We examine the market's historical growth (2019-2024) and project future growth (2025-2033), considering factors such as technological advancements (e.g., improvements in surface coatings, automation of cell culture processes), and evolving end-user demands for higher throughput, improved reproducibility, and more physiologically relevant in vitro models. Specific data points including Compound Annual Growth Rate (CAGR) for both historical and forecast periods will be included. The section will explore the adoption rate of 3D cell culture technologies across different applications and the influence of consumer demands on product development. For example, the increasing demand for personalized medicine is driving innovation in this field.
(Note: Due to the absence of specific data, the content will be replaced with analysis based on industry trends and projections. The CAGR, adoption metrics, and growth rates for both historical and future periods will be detailed and specific once data becomes available.)
Leading Regions, Countries, or Segments in Low Attachment 3D Cell Culture Plates
This section identifies the leading geographical regions and market segments within the Low Attachment 3D Cell Culture Plates market. It provides a detailed breakdown of factors driving dominance, including investment trends, regulatory support, and the presence of key players.
- Dominant Region/Country: [Insert dominant region/country and explanation for its dominance, including detailed analysis using at least 100 words]
- Key Drivers:
- Investment Trends: [Details on funding for research and development in the region/country]
- Regulatory Support: [Government initiatives and policies facilitating market growth]
- Infrastructure: [Availability of resources and expertise supporting the industry]
- Market Access: [Ease of access to potential customers]
Low Attachment 3D Cell Culture Plates Product Innovations
This section highlights recent product innovations within the market, including new materials, surface modifications, and automated systems. Discussion will focus on unique selling propositions (USPs) and technological advancements that provide enhanced cell viability, improved experimental reproducibility, and increased throughput. Specific performance metrics like cell attachment efficiency, proliferation rates, and differentiation capacity will be included.
Propelling Factors for Low Attachment 3D Cell Culture Plates Growth
The growth of the Low Attachment 3D Cell Culture Plates market is driven by several key factors. These include technological advancements enabling higher throughput and improved cell culture, the increasing demand for personalized medicine necessitating more advanced in vitro models, and the rising adoption of 3D cell culture technologies in drug discovery and development. Government funding and initiatives promoting biomedical research also contribute significantly.
Obstacles in the Low Attachment 3D Cell Culture Plates Market
Several challenges impede the growth of the Low Attachment 3D Cell Culture Plates market. These include the relatively high cost of these plates compared to traditional 2D culture systems, the complexity of 3D cell culture techniques requiring specialized training, and potential supply chain disruptions affecting the availability of raw materials. Regulatory hurdles and competitive pressures from alternative technologies also pose significant obstacles.
Future Opportunities in Low Attachment 3D Cell Culture Plates
Future opportunities lie in expanding applications to new fields, like regenerative medicine and personalized therapies. Technological advancements, such as the development of novel biomaterials and improved automation, will drive market growth. The increasing integration of 3D cell culture with other technologies, like microfluidics and imaging systems, presents exciting possibilities for the development of more sophisticated and high-throughput in vitro models.
Major Players in the Low Attachment 3D Cell Culture Plates Ecosystem
- Corning
- Thermo Fisher Scientific
- S-BIO
- Eppendorf
- Greiner Bio-One
- Sarstedt
- Ossiform
- PHC
- InSphero
- MatTek
- BrandTech Scientific
- OMNI Life Science
- Biolab
- ReproCELL
Key Developments in Low Attachment 3D Cell Culture Plates Industry
- [Insert at least 5 key developments with year/month and a brief description of their impact on market dynamics. Examples: Product Launches, Mergers, Acquisitions, Regulatory Approvals etc. If no specific information is available, replace with "Data not available for specific key developments." ]
Strategic Low Attachment 3D Cell Culture Plates Market Forecast
The Low Attachment 3D Cell Culture Plates market is poised for significant growth over the forecast period (2025-2033). Continued technological advancements, increasing demand from the pharmaceutical and biotechnology industries, and expansion into new applications will drive market expansion. The market is expected to reach a value exceeding $XX million by 2033, presenting substantial opportunities for investors and industry participants.
Low Attachment 3D Cell Culture Plates Segmentation
-
1. Application
- 1.1. Scientific Research
- 1.2. Biopharmaceutical
- 1.3. Others
-
2. Types
- 2.1. Polystyrene
- 2.2. Polypropylene
- 2.3. Cycloolefin
Low Attachment 3D Cell Culture Plates Segmentation By Geography
-
1. North America
- 1.1. United States
- 1.2. Canada
- 1.3. Mexico
-
2. South America
- 2.1. Brazil
- 2.2. Argentina
- 2.3. Rest of South America
-
3. Europe
- 3.1. United Kingdom
- 3.2. Germany
- 3.3. France
- 3.4. Italy
- 3.5. Spain
- 3.6. Russia
- 3.7. Benelux
- 3.8. Nordics
- 3.9. Rest of Europe
-
4. Middle East & Africa
- 4.1. Turkey
- 4.2. Israel
- 4.3. GCC
- 4.4. North Africa
- 4.5. South Africa
- 4.6. Rest of Middle East & Africa
-
5. Asia Pacific
- 5.1. China
- 5.2. India
- 5.3. Japan
- 5.4. South Korea
- 5.5. ASEAN
- 5.6. Oceania
- 5.7. Rest of Asia Pacific
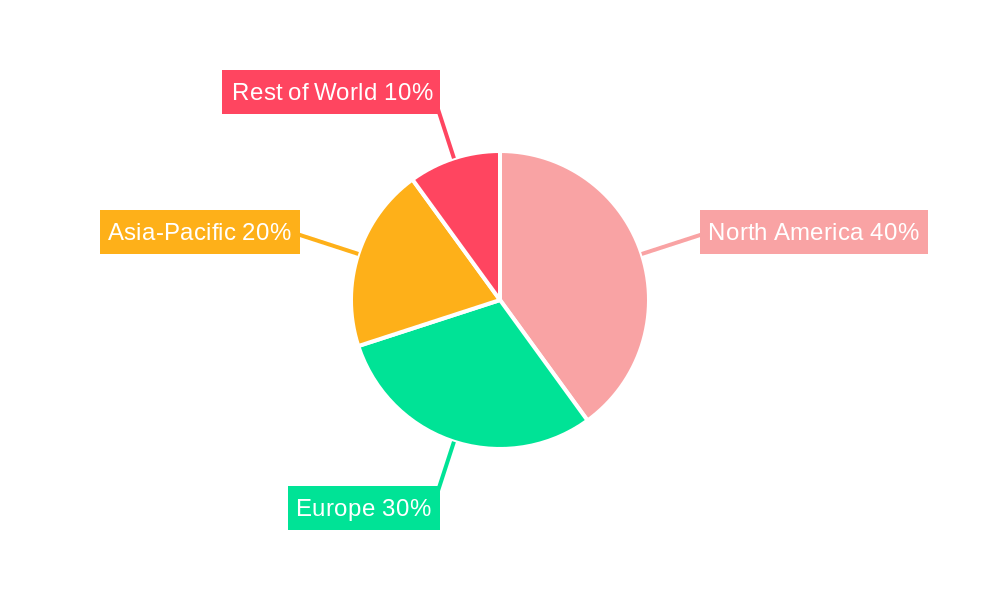
Low Attachment 3D Cell Culture Plates Regional Market Share
Geographic Coverage of Low Attachment 3D Cell Culture Plates
Low Attachment 3D Cell Culture Plates REPORT HIGHLIGHTS
| Aspects | Details |
|---|---|
| Study Period | 2020-2034 |
| Base Year | 2025 |
| Estimated Year | 2026 |
| Forecast Period | 2026-2034 |
| Historical Period | 2020-2025 |
| Growth Rate | CAGR of 11.7% from 2020-2034 |
| Segmentation |
|
Table of Contents
- 1. Introduction
- 1.1. Research Scope
- 1.2. Market Segmentation
- 1.3. Research Methodology
- 1.4. Definitions and Assumptions
- 2. Executive Summary
- 2.1. Introduction
- 3. Market Dynamics
- 3.1. Introduction
- 3.2. Market Drivers
- 3.3. Market Restrains
- 3.4. Market Trends
- 4. Market Factor Analysis
- 4.1. Porters Five Forces
- 4.2. Supply/Value Chain
- 4.3. PESTEL analysis
- 4.4. Market Entropy
- 4.5. Patent/Trademark Analysis
- 5. Global Low Attachment 3D Cell Culture Plates Analysis, Insights and Forecast, 2020-2032
- 5.1. Market Analysis, Insights and Forecast - by Application
- 5.1.1. Scientific Research
- 5.1.2. Biopharmaceutical
- 5.1.3. Others
- 5.2. Market Analysis, Insights and Forecast - by Types
- 5.2.1. Polystyrene
- 5.2.2. Polypropylene
- 5.2.3. Cycloolefin
- 5.3. Market Analysis, Insights and Forecast - by Region
- 5.3.1. North America
- 5.3.2. South America
- 5.3.3. Europe
- 5.3.4. Middle East & Africa
- 5.3.5. Asia Pacific
- 5.1. Market Analysis, Insights and Forecast - by Application
- 6. North America Low Attachment 3D Cell Culture Plates Analysis, Insights and Forecast, 2020-2032
- 6.1. Market Analysis, Insights and Forecast - by Application
- 6.1.1. Scientific Research
- 6.1.2. Biopharmaceutical
- 6.1.3. Others
- 6.2. Market Analysis, Insights and Forecast - by Types
- 6.2.1. Polystyrene
- 6.2.2. Polypropylene
- 6.2.3. Cycloolefin
- 6.1. Market Analysis, Insights and Forecast - by Application
- 7. South America Low Attachment 3D Cell Culture Plates Analysis, Insights and Forecast, 2020-2032
- 7.1. Market Analysis, Insights and Forecast - by Application
- 7.1.1. Scientific Research
- 7.1.2. Biopharmaceutical
- 7.1.3. Others
- 7.2. Market Analysis, Insights and Forecast - by Types
- 7.2.1. Polystyrene
- 7.2.2. Polypropylene
- 7.2.3. Cycloolefin
- 7.1. Market Analysis, Insights and Forecast - by Application
- 8. Europe Low Attachment 3D Cell Culture Plates Analysis, Insights and Forecast, 2020-2032
- 8.1. Market Analysis, Insights and Forecast - by Application
- 8.1.1. Scientific Research
- 8.1.2. Biopharmaceutical
- 8.1.3. Others
- 8.2. Market Analysis, Insights and Forecast - by Types
- 8.2.1. Polystyrene
- 8.2.2. Polypropylene
- 8.2.3. Cycloolefin
- 8.1. Market Analysis, Insights and Forecast - by Application
- 9. Middle East & Africa Low Attachment 3D Cell Culture Plates Analysis, Insights and Forecast, 2020-2032
- 9.1. Market Analysis, Insights and Forecast - by Application
- 9.1.1. Scientific Research
- 9.1.2. Biopharmaceutical
- 9.1.3. Others
- 9.2. Market Analysis, Insights and Forecast - by Types
- 9.2.1. Polystyrene
- 9.2.2. Polypropylene
- 9.2.3. Cycloolefin
- 9.1. Market Analysis, Insights and Forecast - by Application
- 10. Asia Pacific Low Attachment 3D Cell Culture Plates Analysis, Insights and Forecast, 2020-2032
- 10.1. Market Analysis, Insights and Forecast - by Application
- 10.1.1. Scientific Research
- 10.1.2. Biopharmaceutical
- 10.1.3. Others
- 10.2. Market Analysis, Insights and Forecast - by Types
- 10.2.1. Polystyrene
- 10.2.2. Polypropylene
- 10.2.3. Cycloolefin
- 10.1. Market Analysis, Insights and Forecast - by Application
- 11. Competitive Analysis
- 11.1. Global Market Share Analysis 2025
- 11.2. Company Profiles
- 11.2.1 Corning
- 11.2.1.1. Overview
- 11.2.1.2. Products
- 11.2.1.3. SWOT Analysis
- 11.2.1.4. Recent Developments
- 11.2.1.5. Financials (Based on Availability)
- 11.2.2 Thermo Fisher Scientific
- 11.2.2.1. Overview
- 11.2.2.2. Products
- 11.2.2.3. SWOT Analysis
- 11.2.2.4. Recent Developments
- 11.2.2.5. Financials (Based on Availability)
- 11.2.3 S-BIO
- 11.2.3.1. Overview
- 11.2.3.2. Products
- 11.2.3.3. SWOT Analysis
- 11.2.3.4. Recent Developments
- 11.2.3.5. Financials (Based on Availability)
- 11.2.4 Eppendorf
- 11.2.4.1. Overview
- 11.2.4.2. Products
- 11.2.4.3. SWOT Analysis
- 11.2.4.4. Recent Developments
- 11.2.4.5. Financials (Based on Availability)
- 11.2.5 Greiner Bio-One
- 11.2.5.1. Overview
- 11.2.5.2. Products
- 11.2.5.3. SWOT Analysis
- 11.2.5.4. Recent Developments
- 11.2.5.5. Financials (Based on Availability)
- 11.2.6 Sarstedt
- 11.2.6.1. Overview
- 11.2.6.2. Products
- 11.2.6.3. SWOT Analysis
- 11.2.6.4. Recent Developments
- 11.2.6.5. Financials (Based on Availability)
- 11.2.7 Ossiform
- 11.2.7.1. Overview
- 11.2.7.2. Products
- 11.2.7.3. SWOT Analysis
- 11.2.7.4. Recent Developments
- 11.2.7.5. Financials (Based on Availability)
- 11.2.8 PHC
- 11.2.8.1. Overview
- 11.2.8.2. Products
- 11.2.8.3. SWOT Analysis
- 11.2.8.4. Recent Developments
- 11.2.8.5. Financials (Based on Availability)
- 11.2.9 InSphero
- 11.2.9.1. Overview
- 11.2.9.2. Products
- 11.2.9.3. SWOT Analysis
- 11.2.9.4. Recent Developments
- 11.2.9.5. Financials (Based on Availability)
- 11.2.10 MatTek
- 11.2.10.1. Overview
- 11.2.10.2. Products
- 11.2.10.3. SWOT Analysis
- 11.2.10.4. Recent Developments
- 11.2.10.5. Financials (Based on Availability)
- 11.2.11 BrandTech Scientific
- 11.2.11.1. Overview
- 11.2.11.2. Products
- 11.2.11.3. SWOT Analysis
- 11.2.11.4. Recent Developments
- 11.2.11.5. Financials (Based on Availability)
- 11.2.12 OMNI Life Science
- 11.2.12.1. Overview
- 11.2.12.2. Products
- 11.2.12.3. SWOT Analysis
- 11.2.12.4. Recent Developments
- 11.2.12.5. Financials (Based on Availability)
- 11.2.13 Biolab
- 11.2.13.1. Overview
- 11.2.13.2. Products
- 11.2.13.3. SWOT Analysis
- 11.2.13.4. Recent Developments
- 11.2.13.5. Financials (Based on Availability)
- 11.2.14 ReproCELL
- 11.2.14.1. Overview
- 11.2.14.2. Products
- 11.2.14.3. SWOT Analysis
- 11.2.14.4. Recent Developments
- 11.2.14.5. Financials (Based on Availability)
- 11.2.1 Corning
List of Figures
- Figure 1: Global Low Attachment 3D Cell Culture Plates Revenue Breakdown (undefined, %) by Region 2025 & 2033
- Figure 2: North America Low Attachment 3D Cell Culture Plates Revenue (undefined), by Application 2025 & 2033
- Figure 3: North America Low Attachment 3D Cell Culture Plates Revenue Share (%), by Application 2025 & 2033
- Figure 4: North America Low Attachment 3D Cell Culture Plates Revenue (undefined), by Types 2025 & 2033
- Figure 5: North America Low Attachment 3D Cell Culture Plates Revenue Share (%), by Types 2025 & 2033
- Figure 6: North America Low Attachment 3D Cell Culture Plates Revenue (undefined), by Country 2025 & 2033
- Figure 7: North America Low Attachment 3D Cell Culture Plates Revenue Share (%), by Country 2025 & 2033
- Figure 8: South America Low Attachment 3D Cell Culture Plates Revenue (undefined), by Application 2025 & 2033
- Figure 9: South America Low Attachment 3D Cell Culture Plates Revenue Share (%), by Application 2025 & 2033
- Figure 10: South America Low Attachment 3D Cell Culture Plates Revenue (undefined), by Types 2025 & 2033
- Figure 11: South America Low Attachment 3D Cell Culture Plates Revenue Share (%), by Types 2025 & 2033
- Figure 12: South America Low Attachment 3D Cell Culture Plates Revenue (undefined), by Country 2025 & 2033
- Figure 13: South America Low Attachment 3D Cell Culture Plates Revenue Share (%), by Country 2025 & 2033
- Figure 14: Europe Low Attachment 3D Cell Culture Plates Revenue (undefined), by Application 2025 & 2033
- Figure 15: Europe Low Attachment 3D Cell Culture Plates Revenue Share (%), by Application 2025 & 2033
- Figure 16: Europe Low Attachment 3D Cell Culture Plates Revenue (undefined), by Types 2025 & 2033
- Figure 17: Europe Low Attachment 3D Cell Culture Plates Revenue Share (%), by Types 2025 & 2033
- Figure 18: Europe Low Attachment 3D Cell Culture Plates Revenue (undefined), by Country 2025 & 2033
- Figure 19: Europe Low Attachment 3D Cell Culture Plates Revenue Share (%), by Country 2025 & 2033
- Figure 20: Middle East & Africa Low Attachment 3D Cell Culture Plates Revenue (undefined), by Application 2025 & 2033
- Figure 21: Middle East & Africa Low Attachment 3D Cell Culture Plates Revenue Share (%), by Application 2025 & 2033
- Figure 22: Middle East & Africa Low Attachment 3D Cell Culture Plates Revenue (undefined), by Types 2025 & 2033
- Figure 23: Middle East & Africa Low Attachment 3D Cell Culture Plates Revenue Share (%), by Types 2025 & 2033
- Figure 24: Middle East & Africa Low Attachment 3D Cell Culture Plates Revenue (undefined), by Country 2025 & 2033
- Figure 25: Middle East & Africa Low Attachment 3D Cell Culture Plates Revenue Share (%), by Country 2025 & 2033
- Figure 26: Asia Pacific Low Attachment 3D Cell Culture Plates Revenue (undefined), by Application 2025 & 2033
- Figure 27: Asia Pacific Low Attachment 3D Cell Culture Plates Revenue Share (%), by Application 2025 & 2033
- Figure 28: Asia Pacific Low Attachment 3D Cell Culture Plates Revenue (undefined), by Types 2025 & 2033
- Figure 29: Asia Pacific Low Attachment 3D Cell Culture Plates Revenue Share (%), by Types 2025 & 2033
- Figure 30: Asia Pacific Low Attachment 3D Cell Culture Plates Revenue (undefined), by Country 2025 & 2033
- Figure 31: Asia Pacific Low Attachment 3D Cell Culture Plates Revenue Share (%), by Country 2025 & 2033
List of Tables
- Table 1: Global Low Attachment 3D Cell Culture Plates Revenue undefined Forecast, by Application 2020 & 2033
- Table 2: Global Low Attachment 3D Cell Culture Plates Revenue undefined Forecast, by Types 2020 & 2033
- Table 3: Global Low Attachment 3D Cell Culture Plates Revenue undefined Forecast, by Region 2020 & 2033
- Table 4: Global Low Attachment 3D Cell Culture Plates Revenue undefined Forecast, by Application 2020 & 2033
- Table 5: Global Low Attachment 3D Cell Culture Plates Revenue undefined Forecast, by Types 2020 & 2033
- Table 6: Global Low Attachment 3D Cell Culture Plates Revenue undefined Forecast, by Country 2020 & 2033
- Table 7: United States Low Attachment 3D Cell Culture Plates Revenue (undefined) Forecast, by Application 2020 & 2033
- Table 8: Canada Low Attachment 3D Cell Culture Plates Revenue (undefined) Forecast, by Application 2020 & 2033
- Table 9: Mexico Low Attachment 3D Cell Culture Plates Revenue (undefined) Forecast, by Application 2020 & 2033
- Table 10: Global Low Attachment 3D Cell Culture Plates Revenue undefined Forecast, by Application 2020 & 2033
- Table 11: Global Low Attachment 3D Cell Culture Plates Revenue undefined Forecast, by Types 2020 & 2033
- Table 12: Global Low Attachment 3D Cell Culture Plates Revenue undefined Forecast, by Country 2020 & 2033
- Table 13: Brazil Low Attachment 3D Cell Culture Plates Revenue (undefined) Forecast, by Application 2020 & 2033
- Table 14: Argentina Low Attachment 3D Cell Culture Plates Revenue (undefined) Forecast, by Application 2020 & 2033
- Table 15: Rest of South America Low Attachment 3D Cell Culture Plates Revenue (undefined) Forecast, by Application 2020 & 2033
- Table 16: Global Low Attachment 3D Cell Culture Plates Revenue undefined Forecast, by Application 2020 & 2033
- Table 17: Global Low Attachment 3D Cell Culture Plates Revenue undefined Forecast, by Types 2020 & 2033
- Table 18: Global Low Attachment 3D Cell Culture Plates Revenue undefined Forecast, by Country 2020 & 2033
- Table 19: United Kingdom Low Attachment 3D Cell Culture Plates Revenue (undefined) Forecast, by Application 2020 & 2033
- Table 20: Germany Low Attachment 3D Cell Culture Plates Revenue (undefined) Forecast, by Application 2020 & 2033
- Table 21: France Low Attachment 3D Cell Culture Plates Revenue (undefined) Forecast, by Application 2020 & 2033
- Table 22: Italy Low Attachment 3D Cell Culture Plates Revenue (undefined) Forecast, by Application 2020 & 2033
- Table 23: Spain Low Attachment 3D Cell Culture Plates Revenue (undefined) Forecast, by Application 2020 & 2033
- Table 24: Russia Low Attachment 3D Cell Culture Plates Revenue (undefined) Forecast, by Application 2020 & 2033
- Table 25: Benelux Low Attachment 3D Cell Culture Plates Revenue (undefined) Forecast, by Application 2020 & 2033
- Table 26: Nordics Low Attachment 3D Cell Culture Plates Revenue (undefined) Forecast, by Application 2020 & 2033
- Table 27: Rest of Europe Low Attachment 3D Cell Culture Plates Revenue (undefined) Forecast, by Application 2020 & 2033
- Table 28: Global Low Attachment 3D Cell Culture Plates Revenue undefined Forecast, by Application 2020 & 2033
- Table 29: Global Low Attachment 3D Cell Culture Plates Revenue undefined Forecast, by Types 2020 & 2033
- Table 30: Global Low Attachment 3D Cell Culture Plates Revenue undefined Forecast, by Country 2020 & 2033
- Table 31: Turkey Low Attachment 3D Cell Culture Plates Revenue (undefined) Forecast, by Application 2020 & 2033
- Table 32: Israel Low Attachment 3D Cell Culture Plates Revenue (undefined) Forecast, by Application 2020 & 2033
- Table 33: GCC Low Attachment 3D Cell Culture Plates Revenue (undefined) Forecast, by Application 2020 & 2033
- Table 34: North Africa Low Attachment 3D Cell Culture Plates Revenue (undefined) Forecast, by Application 2020 & 2033
- Table 35: South Africa Low Attachment 3D Cell Culture Plates Revenue (undefined) Forecast, by Application 2020 & 2033
- Table 36: Rest of Middle East & Africa Low Attachment 3D Cell Culture Plates Revenue (undefined) Forecast, by Application 2020 & 2033
- Table 37: Global Low Attachment 3D Cell Culture Plates Revenue undefined Forecast, by Application 2020 & 2033
- Table 38: Global Low Attachment 3D Cell Culture Plates Revenue undefined Forecast, by Types 2020 & 2033
- Table 39: Global Low Attachment 3D Cell Culture Plates Revenue undefined Forecast, by Country 2020 & 2033
- Table 40: China Low Attachment 3D Cell Culture Plates Revenue (undefined) Forecast, by Application 2020 & 2033
- Table 41: India Low Attachment 3D Cell Culture Plates Revenue (undefined) Forecast, by Application 2020 & 2033
- Table 42: Japan Low Attachment 3D Cell Culture Plates Revenue (undefined) Forecast, by Application 2020 & 2033
- Table 43: South Korea Low Attachment 3D Cell Culture Plates Revenue (undefined) Forecast, by Application 2020 & 2033
- Table 44: ASEAN Low Attachment 3D Cell Culture Plates Revenue (undefined) Forecast, by Application 2020 & 2033
- Table 45: Oceania Low Attachment 3D Cell Culture Plates Revenue (undefined) Forecast, by Application 2020 & 2033
- Table 46: Rest of Asia Pacific Low Attachment 3D Cell Culture Plates Revenue (undefined) Forecast, by Application 2020 & 2033
Frequently Asked Questions
1. What is the projected Compound Annual Growth Rate (CAGR) of the Low Attachment 3D Cell Culture Plates?
The projected CAGR is approximately 11.7%.
2. Which companies are prominent players in the Low Attachment 3D Cell Culture Plates?
Key companies in the market include Corning, Thermo Fisher Scientific, S-BIO, Eppendorf, Greiner Bio-One, Sarstedt, Ossiform, PHC, InSphero, MatTek, BrandTech Scientific, OMNI Life Science, Biolab, ReproCELL.
3. What are the main segments of the Low Attachment 3D Cell Culture Plates?
The market segments include Application, Types.
4. Can you provide details about the market size?
The market size is estimated to be USD XXX N/A as of 2022.
5. What are some drivers contributing to market growth?
N/A
6. What are the notable trends driving market growth?
N/A
7. Are there any restraints impacting market growth?
N/A
8. Can you provide examples of recent developments in the market?
N/A
9. What pricing options are available for accessing the report?
Pricing options include single-user, multi-user, and enterprise licenses priced at USD 2900.00, USD 4350.00, and USD 5800.00 respectively.
10. Is the market size provided in terms of value or volume?
The market size is provided in terms of value, measured in N/A.
11. Are there any specific market keywords associated with the report?
Yes, the market keyword associated with the report is "Low Attachment 3D Cell Culture Plates," which aids in identifying and referencing the specific market segment covered.
12. How do I determine which pricing option suits my needs best?
The pricing options vary based on user requirements and access needs. Individual users may opt for single-user licenses, while businesses requiring broader access may choose multi-user or enterprise licenses for cost-effective access to the report.
13. Are there any additional resources or data provided in the Low Attachment 3D Cell Culture Plates report?
While the report offers comprehensive insights, it's advisable to review the specific contents or supplementary materials provided to ascertain if additional resources or data are available.
14. How can I stay updated on further developments or reports in the Low Attachment 3D Cell Culture Plates?
To stay informed about further developments, trends, and reports in the Low Attachment 3D Cell Culture Plates, consider subscribing to industry newsletters, following relevant companies and organizations, or regularly checking reputable industry news sources and publications.
Methodology
Step 1 - Identification of Relevant Samples Size from Population Database


Step 2 - Approaches for Defining Global Market Size (Value, Volume* & Price*)

Note*: In applicable scenarios
Step 3 - Data Sources
Primary Research
- Web Analytics
- Survey Reports
- Research Institute
- Latest Research Reports
- Opinion Leaders
Secondary Research
- Annual Reports
- White Paper
- Latest Press Release
- Industry Association
- Paid Database
- Investor Presentations

Step 4 - Data Triangulation
Involves using different sources of information in order to increase the validity of a study
These sources are likely to be stakeholders in a program - participants, other researchers, program staff, other community members, and so on.
Then we put all data in single framework & apply various statistical tools to find out the dynamic on the market.
During the analysis stage, feedback from the stakeholder groups would be compared to determine areas of agreement as well as areas of divergence