

Key Insights
The hydroponics nutrients market is experiencing robust growth, projected to reach a substantial size, driven by increasing demand for fresh produce, advancements in hydroponic technology, and rising consumer awareness of sustainable and efficient agricultural practices. The market's 8.80% CAGR indicates a significant expansion over the forecast period (2025-2033). Key drivers include the need for enhanced crop yields in controlled environments, particularly in regions with limited arable land and water scarcity. The rising popularity of indoor farming and vertical agriculture further fuels market expansion. While synthetic nutrients currently dominate the market due to their cost-effectiveness and efficacy, the organic segment is witnessing substantial growth driven by the increasing consumer preference for organically grown produce and concerns about environmental sustainability. Market segmentation by crop type reveals significant demand from high-value crops such as tomatoes, cucumbers, leafy greens, peppers, and strawberries, representing lucrative segments for nutrient manufacturers. Leading companies like General Hydroponics, LushGro, and American Hydroponics are capitalizing on these trends by offering specialized nutrient solutions tailored to specific crop requirements. Geographic analysis shows strong growth potential in North America and Europe, followed by Asia Pacific, reflecting increasing adoption of hydroponics in these regions. However, high initial investment costs and a lack of awareness in certain regions pose potential restraints. The future will likely see increased innovation in nutrient formulations, including the development of more efficient and sustainable products to cater to the evolving needs of hydroponic growers.
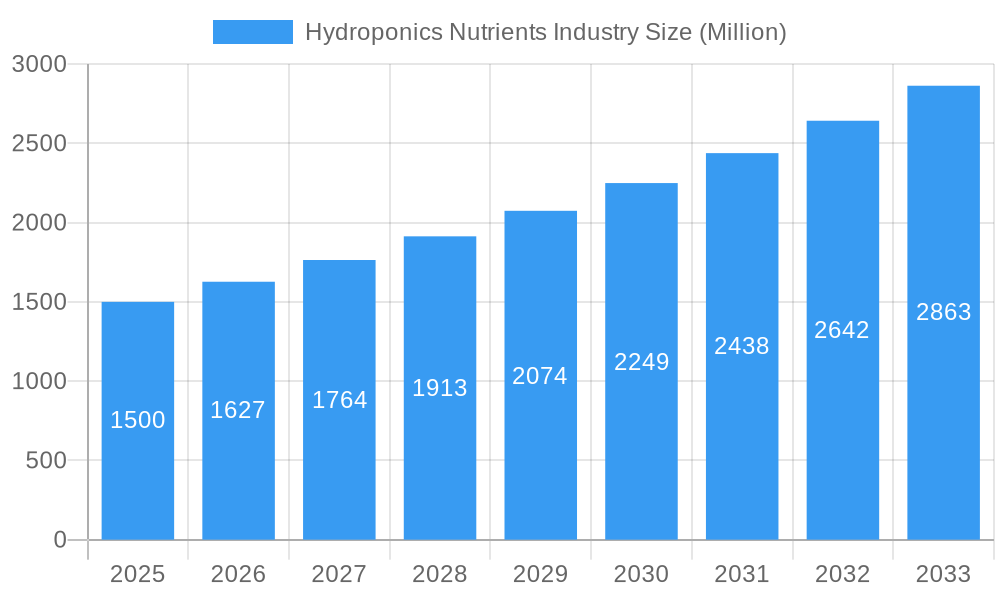
Hydroponics Nutrients Industry Market Size (In Billion)
The competitive landscape is characterized by both established players and emerging companies. While major companies dominate market share through their established distribution networks and brand recognition, smaller companies are gaining traction by offering niche products and innovative solutions. Successful companies will focus on R&D to develop customized nutrient blends tailored to specific crop needs and environmental conditions. Strategic partnerships and collaborations will play a key role in expanding market reach and driving adoption. The continued trend toward automation and precision agriculture will shape the industry, leading to increased demand for data-driven nutrient management solutions. Governments are also promoting sustainable agricultural practices, furthering the expansion of the hydroponics sector and consequently, the market for hydroponics nutrients.
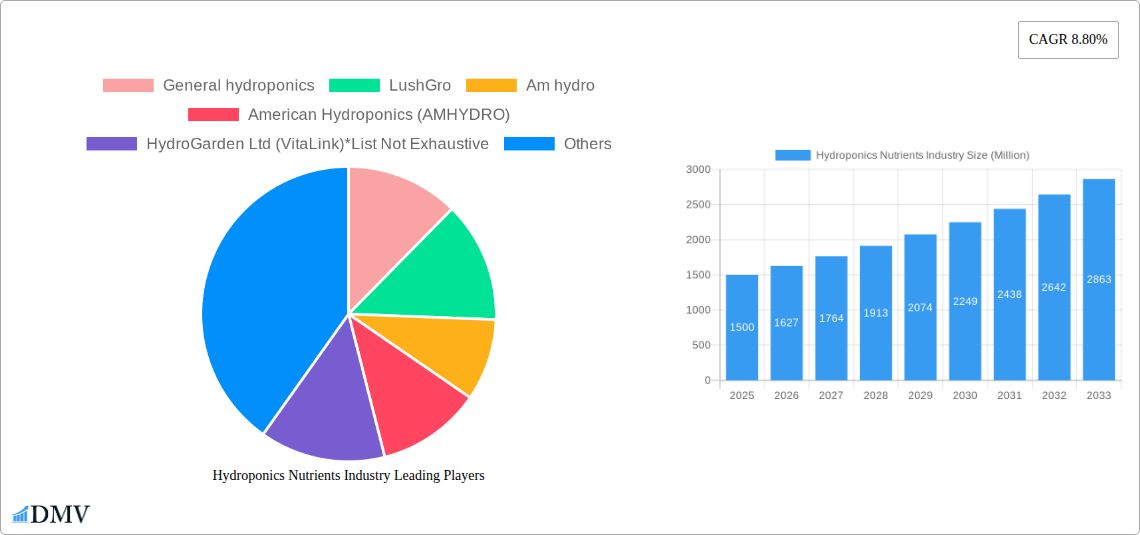
Hydroponics Nutrients Industry Company Market Share
Hydroponics Nutrients Industry: A Comprehensive Market Report (2019-2033)
This insightful report provides a detailed analysis of the global hydroponics nutrients market, encompassing market size, trends, leading players, and future projections. Valued at $XX Million in 2025, the market is poised for significant growth, reaching $XX Million by 2033, exhibiting a CAGR of XX% during the forecast period (2025-2033). This comprehensive study covers the historical period (2019-2024), with 2025 serving as the base year and estimated year. The report is crucial for stakeholders seeking to understand the dynamics of this rapidly evolving industry.
Hydroponics Nutrients Industry Market Composition & Trends
The hydroponics nutrients market is characterized by a moderately concentrated landscape with key players such as General Hydroponics, LushGro, Am hydro, American Hydroponics (AMHYDRO), HydroGarden Ltd (VitaLink), Advanced Hydroponics of Holland, Nutrifield, Emerald Harvest, Watercircle hydroponics pte ltd, and X Nutrients holding significant market share. The distribution of market share is dynamic, with ongoing mergers and acquisitions (M&A) influencing the competitive landscape. In the last 5 years, M&A deal values have totaled approximately $XX Million, reflecting a consolidation trend within the industry.
Innovation is driven by the need for sustainable and efficient nutrient solutions, prompting the development of organic and specialized nutrient blends tailored to specific crops. The regulatory landscape varies across regions, impacting product formulations and labeling requirements. Substitute products, such as traditional soil-based agriculture, face increasing competition due to the advantages of hydroponics in terms of yield, resource efficiency, and environmental impact. End-users primarily include commercial hydroponic farms, greenhouse operators, and increasingly, home growers.
- Market Concentration: Moderately concentrated, with top players holding XX% market share.
- Innovation Catalysts: Demand for sustainable and efficient solutions, technological advancements in nutrient formulation.
- Regulatory Landscape: Varies significantly across regions, impacting product approvals and labeling.
- Substitute Products: Traditional soil-based agriculture; however, hydroponics is gaining significant traction.
- End-User Profiles: Commercial hydroponic farms, greenhouse operators, home growers.
- M&A Activity: Significant activity in the past five years, with total deal values exceeding $XX Million.
Hydroponics Nutrients Industry Evolution
The hydroponics nutrients market has witnessed robust growth, fueled by several factors. From 2019 to 2024, the market expanded at a CAGR of XX%, driven by increasing consumer demand for fresh produce, rising adoption of hydroponic farming techniques across diverse regions, and ongoing technological innovations that increase efficiency and yield. Technological advancements, such as precision fertigation systems and sensor-based nutrient monitoring, have enhanced crop management and optimized nutrient delivery, improving yields and reducing waste. Consumer demand is shifting toward organically produced food, driving the growth of the organic hydroponic nutrients segment. This growth is particularly notable in regions with favorable government policies promoting sustainable agriculture and technological advancements.
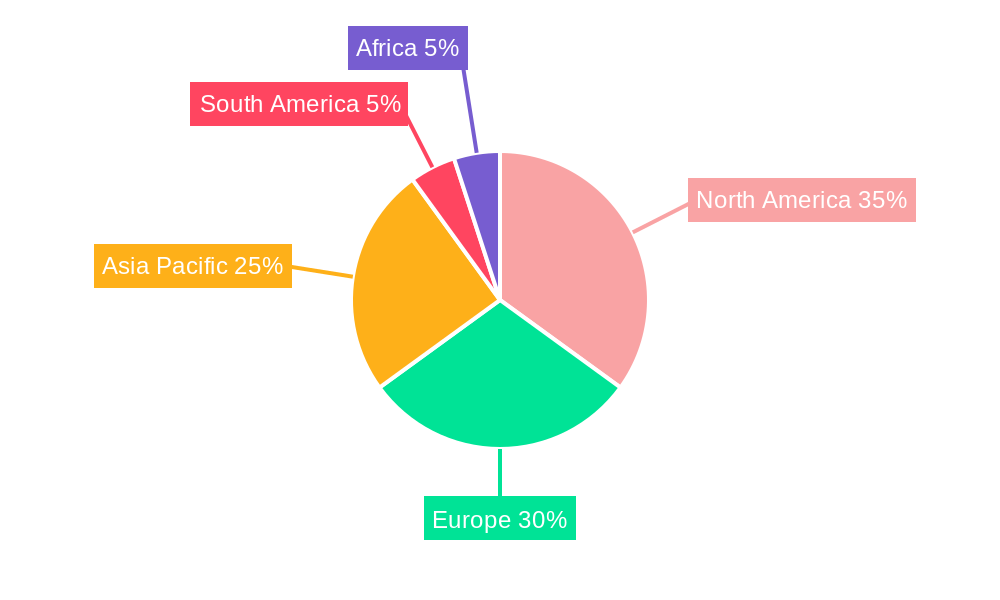
Leading Regions, Countries, or Segments in Hydroponics Nutrients Industry
The North American region currently dominates the hydroponics nutrients market, accounting for XX% of global revenue in 2025. This dominance is attributed to factors such as high consumer demand for fresh produce, increased adoption of hydroponic farming, and substantial investments in agricultural technology. Within the segments, the demand for Nitrogenous nutrients is highest, followed by Phosphatic and Potassic, driven by the high demand for leafy greens and tomato production. The synthetic nutrient segment continues to hold a larger market share compared to the organic segment.
Key Drivers for North American Dominance:
- High consumer demand for fresh produce.
- Increased adoption of hydroponic farming techniques.
- Significant investments in agricultural technology.
- Favorable regulatory environment.
Leading Crop Segments: Tomato, Leafy Greens, and Cucumber account for XX% of total market demand.
Leading Nutrient Type: Synthetic nutrients dominate the market due to their affordability and efficacy.
Hydroponics Nutrients Industry Product Innovations
Recent innovations focus on developing nutrient solutions with enhanced bioavailability, tailored nutrient profiles for specific crops, and environmentally friendly formulations. These advancements include slow-release fertilizers, biostimulants to enhance plant growth and resilience, and advanced water-soluble nutrient blends. Unique selling propositions include improved yield, reduced nutrient waste, and enhanced crop quality. The integration of smart sensors and automated systems for nutrient management represents a major technological shift in the industry, leading to precision agriculture and optimized resource utilization.
Propelling Factors for Hydroponics Nutrients Industry Growth
Several factors propel the growth of the hydroponics nutrients market. Technological advancements, like automation and data analytics, enhance efficiency and productivity. The rising demand for fresh produce, driven by changing consumer preferences and growing urban populations, creates increased demand for high-quality crops. Moreover, supportive government policies, subsidies, and initiatives promoting sustainable agriculture further stimulate market growth. The growing adoption of hydroponics in developing countries, driven by the need for improved food security and higher crop yields per unit area, also contributes significantly.
Obstacles in the Hydroponics Nutrients Industry Market
The hydroponics nutrients market faces challenges such as fluctuating raw material prices, which impact production costs and profitability. Supply chain disruptions can hinder production and distribution, while intense competition among established and emerging players creates pricing pressures. Regulatory hurdles related to product approval and labeling requirements vary across regions, creating complexities for manufacturers seeking global market access. These factors constrain the market's overall growth rate and profitability.
Future Opportunities in Hydroponics Nutrients Industry
Future opportunities lie in the expansion into new markets, especially in developing countries with high agricultural potential. Further technological advancements in nutrient formulation, automated delivery systems, and data analytics hold immense promise. The growing consumer preference for organic and sustainable products offers significant potential for growth in the organic hydroponic nutrients segment. Developing specialized nutrient blends tailored to specific crop varieties and targeted consumer needs will further drive innovation and market expansion.
Major Players in the Hydroponics Nutrients Industry Ecosystem
- General hydroponics
- LushGro
- Am hydro
- American Hydroponics (AMHYDRO)
- HydroGarden Ltd (VitaLink)
- Advanced Hydroponics of Holland
- Nutrifield
- Emerald Harvest
- Watercircle hydroponics pte ltd
- X Nutrients
Key Developments in Hydroponics Nutrients Industry Industry
- 2022 Q3: General Hydroponics launched a new line of organic hydroponic nutrients.
- 2023 Q1: American Hydroponics acquired a smaller competitor, expanding its market share.
- 2024 Q2: A new regulatory framework for hydroponic nutrient production was implemented in the EU.
- 2025 Q1: Significant investments in research and development of sustainable nutrient formulations were announced by several major players.
Strategic Hydroponics Nutrients Industry Market Forecast
The hydroponics nutrients market is poised for continued robust growth, driven by technological advancements, increasing consumer demand for fresh produce, and favorable government policies supporting sustainable agriculture. The market's expansion will be particularly notable in developing countries adopting hydroponic farming techniques. The organic segment will experience significant growth due to rising consumer preference for sustainable and environmentally friendly products. Overall, the market is expected to exhibit strong growth, exceeding $XX Million by 2033.
Hydroponics Nutrients Industry Segmentation
- 1. Production Analysis
- 2. Consumption Analysis
- 3. Import Market Analysis (Value & Volume)
- 4. Export Market Analysis (Value & Volume)
- 5. Price Trend Analysis
Hydroponics Nutrients Industry Segmentation By Geography
-
1. North America
- 1.1. United States
- 1.2. Canada
- 1.3. Mexico
-
2. South America
- 2.1. Brazil
- 2.2. Argentina
- 2.3. Rest of South America
-
3. Europe
- 3.1. United Kingdom
- 3.2. Germany
- 3.3. France
- 3.4. Italy
- 3.5. Spain
- 3.6. Russia
- 3.7. Benelux
- 3.8. Nordics
- 3.9. Rest of Europe
-
4. Middle East & Africa
- 4.1. Turkey
- 4.2. Israel
- 4.3. GCC
- 4.4. North Africa
- 4.5. South Africa
- 4.6. Rest of Middle East & Africa
-
5. Asia Pacific
- 5.1. China
- 5.2. India
- 5.3. Japan
- 5.4. South Korea
- 5.5. ASEAN
- 5.6. Oceania
- 5.7. Rest of Asia Pacific
Hydroponics Nutrients Industry Regional Market Share
Geographic Coverage of Hydroponics Nutrients Industry
Hydroponics Nutrients Industry REPORT HIGHLIGHTS
| Aspects | Details |
|---|---|
| Study Period | 2020-2034 |
| Base Year | 2025 |
| Estimated Year | 2026 |
| Forecast Period | 2026-2034 |
| Historical Period | 2020-2025 |
| Growth Rate | CAGR of 8.80% from 2020-2034 |
| Segmentation |
|
Table of Contents
- 1. Introduction
- 1.1. Research Scope
- 1.2. Market Segmentation
- 1.3. Research Objective
- 1.4. Definitions and Assumptions
- 2. Executive Summary
- 2.1. Market Snapshot
- 3. Market Dynamics
- 3.1. Market Drivers
- 3.2. Market Restrains
- 3.3. Market Trends
- 3.4. Market Opportunities
- 4. Market Factor Analysis
- 4.1. Porters Five Forces
- 4.1.1. Bargaining Power of Suppliers
- 4.1.2. Bargaining Power of Buyers
- 4.1.3. Threat of New Entrants
- 4.1.4. Threat of Substitutes
- 4.1.5. Competitive Rivalry
- 4.2. PESTEL analysis
- 4.3. BCG Analysis
- 4.3.1. Stars (High Growth, High Market Share)
- 4.3.2. Cash Cows (Low Growth, High Market Share)
- 4.3.3. Question Mark (High Growth, Low Market Share)
- 4.3.4. Dogs (Low Growth, Low Market Share)
- 4.4. Ansoff Matrix Analysis
- 4.5. Supply Chain Analysis
- 4.6. Regulatory Landscape
- 4.7. Current Market Potential and Opportunity Assessment (TAM–SAM–SOM Framework)
- 4.8. DMV Analyst Note
- 4.1. Porters Five Forces
- 5. Market Analysis, Insights and Forecast 2021-2033
- 5.1. Market Analysis, Insights and Forecast - by Production Analysis
- 5.2. Market Analysis, Insights and Forecast - by Consumption Analysis
- 5.3. Market Analysis, Insights and Forecast - by Import Market Analysis (Value & Volume)
- 5.4. Market Analysis, Insights and Forecast - by Export Market Analysis (Value & Volume)
- 5.5. Market Analysis, Insights and Forecast - by Price Trend Analysis
- 5.6. Market Analysis, Insights and Forecast - by Region
- 5.6.1. North America
- 5.6.2. South America
- 5.6.3. Europe
- 5.6.4. Middle East & Africa
- 5.6.5. Asia Pacific
- 6. Global Hydroponics Nutrients Industry Analysis, Insights and Forecast, 2021-2033
- 6.1. Market Analysis, Insights and Forecast - by Production Analysis
- 6.2. Market Analysis, Insights and Forecast - by Consumption Analysis
- 6.3. Market Analysis, Insights and Forecast - by Import Market Analysis (Value & Volume)
- 6.4. Market Analysis, Insights and Forecast - by Export Market Analysis (Value & Volume)
- 6.5. Market Analysis, Insights and Forecast - by Price Trend Analysis
- 7. North America Hydroponics Nutrients Industry Analysis, Insights and Forecast, 2020-2032
- 7.1. Market Analysis, Insights and Forecast - by Production Analysis
- 7.2. Market Analysis, Insights and Forecast - by Consumption Analysis
- 7.3. Market Analysis, Insights and Forecast - by Import Market Analysis (Value & Volume)
- 7.4. Market Analysis, Insights and Forecast - by Export Market Analysis (Value & Volume)
- 7.5. Market Analysis, Insights and Forecast - by Price Trend Analysis
- 8. South America Hydroponics Nutrients Industry Analysis, Insights and Forecast, 2020-2032
- 8.1. Market Analysis, Insights and Forecast - by Production Analysis
- 8.2. Market Analysis, Insights and Forecast - by Consumption Analysis
- 8.3. Market Analysis, Insights and Forecast - by Import Market Analysis (Value & Volume)
- 8.4. Market Analysis, Insights and Forecast - by Export Market Analysis (Value & Volume)
- 8.5. Market Analysis, Insights and Forecast - by Price Trend Analysis
- 9. Europe Hydroponics Nutrients Industry Analysis, Insights and Forecast, 2020-2032
- 9.1. Market Analysis, Insights and Forecast - by Production Analysis
- 9.2. Market Analysis, Insights and Forecast - by Consumption Analysis
- 9.3. Market Analysis, Insights and Forecast - by Import Market Analysis (Value & Volume)
- 9.4. Market Analysis, Insights and Forecast - by Export Market Analysis (Value & Volume)
- 9.5. Market Analysis, Insights and Forecast - by Price Trend Analysis
- 10. Middle East & Africa Hydroponics Nutrients Industry Analysis, Insights and Forecast, 2020-2032
- 10.1. Market Analysis, Insights and Forecast - by Production Analysis
- 10.2. Market Analysis, Insights and Forecast - by Consumption Analysis
- 10.3. Market Analysis, Insights and Forecast - by Import Market Analysis (Value & Volume)
- 10.4. Market Analysis, Insights and Forecast - by Export Market Analysis (Value & Volume)
- 10.5. Market Analysis, Insights and Forecast - by Price Trend Analysis
- 11. Asia Pacific Hydroponics Nutrients Industry Analysis, Insights and Forecast, 2020-2032
- 11.1. Market Analysis, Insights and Forecast - by Production Analysis
- 11.2. Market Analysis, Insights and Forecast - by Consumption Analysis
- 11.3. Market Analysis, Insights and Forecast - by Import Market Analysis (Value & Volume)
- 11.4. Market Analysis, Insights and Forecast - by Export Market Analysis (Value & Volume)
- 11.5. Market Analysis, Insights and Forecast - by Price Trend Analysis
- 12. Competitive Analysis
- 12.1. Company Profiles
- 12.1.1 General hydroponics
- 12.1.1.1. Company Overview
- 12.1.1.2. Products
- 12.1.1.3. Company Financials
- 12.1.1.4. SWOT Analysis
- 12.1.2 LushGro
- 12.1.2.1. Company Overview
- 12.1.2.2. Products
- 12.1.2.3. Company Financials
- 12.1.2.4. SWOT Analysis
- 12.1.3 Am hydro
- 12.1.3.1. Company Overview
- 12.1.3.2. Products
- 12.1.3.3. Company Financials
- 12.1.3.4. SWOT Analysis
- 12.1.4 American Hydroponics (AMHYDRO)
- 12.1.4.1. Company Overview
- 12.1.4.2. Products
- 12.1.4.3. Company Financials
- 12.1.4.4. SWOT Analysis
- 12.1.5 HydroGarden Ltd (VitaLink)*List Not Exhaustive
- 12.1.5.1. Company Overview
- 12.1.5.2. Products
- 12.1.5.3. Company Financials
- 12.1.5.4. SWOT Analysis
- 12.1.6 Advanced Hydroponics of Holland
- 12.1.6.1. Company Overview
- 12.1.6.2. Products
- 12.1.6.3. Company Financials
- 12.1.6.4. SWOT Analysis
- 12.1.7 Nutrifield
- 12.1.7.1. Company Overview
- 12.1.7.2. Products
- 12.1.7.3. Company Financials
- 12.1.7.4. SWOT Analysis
- 12.1.8 Emerald Harvest
- 12.1.8.1. Company Overview
- 12.1.8.2. Products
- 12.1.8.3. Company Financials
- 12.1.8.4. SWOT Analysis
- 12.1.9 Watercircle hydroponics pte ltd
- 12.1.9.1. Company Overview
- 12.1.9.2. Products
- 12.1.9.3. Company Financials
- 12.1.9.4. SWOT Analysis
- 12.1.10 X Nutrients
- 12.1.10.1. Company Overview
- 12.1.10.2. Products
- 12.1.10.3. Company Financials
- 12.1.10.4. SWOT Analysis
- 12.1.1 General hydroponics
- 12.2. Market Entropy
- 12.2.1 Company's Key Areas Served
- 12.2.2 Recent Developments
- 12.3. Company Market Share Analysis 2025
- 12.3.1 Top 5 Companies Market Share Analysis
- 12.3.2 Top 3 Companies Market Share Analysis
- 12.4. List of Potential Customers
- 13. Research Methodology
List of Figures
- Figure 1: Global Hydroponics Nutrients Industry Revenue Breakdown (Million, %) by Region 2025 & 2033
- Figure 2: North America Hydroponics Nutrients Industry Revenue (Million), by Production Analysis 2025 & 2033
- Figure 3: North America Hydroponics Nutrients Industry Revenue Share (%), by Production Analysis 2025 & 2033
- Figure 4: North America Hydroponics Nutrients Industry Revenue (Million), by Consumption Analysis 2025 & 2033
- Figure 5: North America Hydroponics Nutrients Industry Revenue Share (%), by Consumption Analysis 2025 & 2033
- Figure 6: North America Hydroponics Nutrients Industry Revenue (Million), by Import Market Analysis (Value & Volume) 2025 & 2033
- Figure 7: North America Hydroponics Nutrients Industry Revenue Share (%), by Import Market Analysis (Value & Volume) 2025 & 2033
- Figure 8: North America Hydroponics Nutrients Industry Revenue (Million), by Export Market Analysis (Value & Volume) 2025 & 2033
- Figure 9: North America Hydroponics Nutrients Industry Revenue Share (%), by Export Market Analysis (Value & Volume) 2025 & 2033
- Figure 10: North America Hydroponics Nutrients Industry Revenue (Million), by Price Trend Analysis 2025 & 2033
- Figure 11: North America Hydroponics Nutrients Industry Revenue Share (%), by Price Trend Analysis 2025 & 2033
- Figure 12: North America Hydroponics Nutrients Industry Revenue (Million), by Country 2025 & 2033
- Figure 13: North America Hydroponics Nutrients Industry Revenue Share (%), by Country 2025 & 2033
- Figure 14: South America Hydroponics Nutrients Industry Revenue (Million), by Production Analysis 2025 & 2033
- Figure 15: South America Hydroponics Nutrients Industry Revenue Share (%), by Production Analysis 2025 & 2033
- Figure 16: South America Hydroponics Nutrients Industry Revenue (Million), by Consumption Analysis 2025 & 2033
- Figure 17: South America Hydroponics Nutrients Industry Revenue Share (%), by Consumption Analysis 2025 & 2033
- Figure 18: South America Hydroponics Nutrients Industry Revenue (Million), by Import Market Analysis (Value & Volume) 2025 & 2033
- Figure 19: South America Hydroponics Nutrients Industry Revenue Share (%), by Import Market Analysis (Value & Volume) 2025 & 2033
- Figure 20: South America Hydroponics Nutrients Industry Revenue (Million), by Export Market Analysis (Value & Volume) 2025 & 2033
- Figure 21: South America Hydroponics Nutrients Industry Revenue Share (%), by Export Market Analysis (Value & Volume) 2025 & 2033
- Figure 22: South America Hydroponics Nutrients Industry Revenue (Million), by Price Trend Analysis 2025 & 2033
- Figure 23: South America Hydroponics Nutrients Industry Revenue Share (%), by Price Trend Analysis 2025 & 2033
- Figure 24: South America Hydroponics Nutrients Industry Revenue (Million), by Country 2025 & 2033
- Figure 25: South America Hydroponics Nutrients Industry Revenue Share (%), by Country 2025 & 2033
- Figure 26: Europe Hydroponics Nutrients Industry Revenue (Million), by Production Analysis 2025 & 2033
- Figure 27: Europe Hydroponics Nutrients Industry Revenue Share (%), by Production Analysis 2025 & 2033
- Figure 28: Europe Hydroponics Nutrients Industry Revenue (Million), by Consumption Analysis 2025 & 2033
- Figure 29: Europe Hydroponics Nutrients Industry Revenue Share (%), by Consumption Analysis 2025 & 2033
- Figure 30: Europe Hydroponics Nutrients Industry Revenue (Million), by Import Market Analysis (Value & Volume) 2025 & 2033
- Figure 31: Europe Hydroponics Nutrients Industry Revenue Share (%), by Import Market Analysis (Value & Volume) 2025 & 2033
- Figure 32: Europe Hydroponics Nutrients Industry Revenue (Million), by Export Market Analysis (Value & Volume) 2025 & 2033
- Figure 33: Europe Hydroponics Nutrients Industry Revenue Share (%), by Export Market Analysis (Value & Volume) 2025 & 2033
- Figure 34: Europe Hydroponics Nutrients Industry Revenue (Million), by Price Trend Analysis 2025 & 2033
- Figure 35: Europe Hydroponics Nutrients Industry Revenue Share (%), by Price Trend Analysis 2025 & 2033
- Figure 36: Europe Hydroponics Nutrients Industry Revenue (Million), by Country 2025 & 2033
- Figure 37: Europe Hydroponics Nutrients Industry Revenue Share (%), by Country 2025 & 2033
- Figure 38: Middle East & Africa Hydroponics Nutrients Industry Revenue (Million), by Production Analysis 2025 & 2033
- Figure 39: Middle East & Africa Hydroponics Nutrients Industry Revenue Share (%), by Production Analysis 2025 & 2033
- Figure 40: Middle East & Africa Hydroponics Nutrients Industry Revenue (Million), by Consumption Analysis 2025 & 2033
- Figure 41: Middle East & Africa Hydroponics Nutrients Industry Revenue Share (%), by Consumption Analysis 2025 & 2033
- Figure 42: Middle East & Africa Hydroponics Nutrients Industry Revenue (Million), by Import Market Analysis (Value & Volume) 2025 & 2033
- Figure 43: Middle East & Africa Hydroponics Nutrients Industry Revenue Share (%), by Import Market Analysis (Value & Volume) 2025 & 2033
- Figure 44: Middle East & Africa Hydroponics Nutrients Industry Revenue (Million), by Export Market Analysis (Value & Volume) 2025 & 2033
- Figure 45: Middle East & Africa Hydroponics Nutrients Industry Revenue Share (%), by Export Market Analysis (Value & Volume) 2025 & 2033
- Figure 46: Middle East & Africa Hydroponics Nutrients Industry Revenue (Million), by Price Trend Analysis 2025 & 2033
- Figure 47: Middle East & Africa Hydroponics Nutrients Industry Revenue Share (%), by Price Trend Analysis 2025 & 2033
- Figure 48: Middle East & Africa Hydroponics Nutrients Industry Revenue (Million), by Country 2025 & 2033
- Figure 49: Middle East & Africa Hydroponics Nutrients Industry Revenue Share (%), by Country 2025 & 2033
- Figure 50: Asia Pacific Hydroponics Nutrients Industry Revenue (Million), by Production Analysis 2025 & 2033
- Figure 51: Asia Pacific Hydroponics Nutrients Industry Revenue Share (%), by Production Analysis 2025 & 2033
- Figure 52: Asia Pacific Hydroponics Nutrients Industry Revenue (Million), by Consumption Analysis 2025 & 2033
- Figure 53: Asia Pacific Hydroponics Nutrients Industry Revenue Share (%), by Consumption Analysis 2025 & 2033
- Figure 54: Asia Pacific Hydroponics Nutrients Industry Revenue (Million), by Import Market Analysis (Value & Volume) 2025 & 2033
- Figure 55: Asia Pacific Hydroponics Nutrients Industry Revenue Share (%), by Import Market Analysis (Value & Volume) 2025 & 2033
- Figure 56: Asia Pacific Hydroponics Nutrients Industry Revenue (Million), by Export Market Analysis (Value & Volume) 2025 & 2033
- Figure 57: Asia Pacific Hydroponics Nutrients Industry Revenue Share (%), by Export Market Analysis (Value & Volume) 2025 & 2033
- Figure 58: Asia Pacific Hydroponics Nutrients Industry Revenue (Million), by Price Trend Analysis 2025 & 2033
- Figure 59: Asia Pacific Hydroponics Nutrients Industry Revenue Share (%), by Price Trend Analysis 2025 & 2033
- Figure 60: Asia Pacific Hydroponics Nutrients Industry Revenue (Million), by Country 2025 & 2033
- Figure 61: Asia Pacific Hydroponics Nutrients Industry Revenue Share (%), by Country 2025 & 2033
List of Tables
- Table 1: Global Hydroponics Nutrients Industry Revenue Million Forecast, by Production Analysis 2020 & 2033
- Table 2: Global Hydroponics Nutrients Industry Revenue Million Forecast, by Consumption Analysis 2020 & 2033
- Table 3: Global Hydroponics Nutrients Industry Revenue Million Forecast, by Import Market Analysis (Value & Volume) 2020 & 2033
- Table 4: Global Hydroponics Nutrients Industry Revenue Million Forecast, by Export Market Analysis (Value & Volume) 2020 & 2033
- Table 5: Global Hydroponics Nutrients Industry Revenue Million Forecast, by Price Trend Analysis 2020 & 2033
- Table 6: Global Hydroponics Nutrients Industry Revenue Million Forecast, by Region 2020 & 2033
- Table 7: Global Hydroponics Nutrients Industry Revenue Million Forecast, by Production Analysis 2020 & 2033
- Table 8: Global Hydroponics Nutrients Industry Revenue Million Forecast, by Consumption Analysis 2020 & 2033
- Table 9: Global Hydroponics Nutrients Industry Revenue Million Forecast, by Import Market Analysis (Value & Volume) 2020 & 2033
- Table 10: Global Hydroponics Nutrients Industry Revenue Million Forecast, by Export Market Analysis (Value & Volume) 2020 & 2033
- Table 11: Global Hydroponics Nutrients Industry Revenue Million Forecast, by Price Trend Analysis 2020 & 2033
- Table 12: Global Hydroponics Nutrients Industry Revenue Million Forecast, by Country 2020 & 2033
- Table 13: United States Hydroponics Nutrients Industry Revenue (Million) Forecast, by Application 2020 & 2033
- Table 14: Canada Hydroponics Nutrients Industry Revenue (Million) Forecast, by Application 2020 & 2033
- Table 15: Mexico Hydroponics Nutrients Industry Revenue (Million) Forecast, by Application 2020 & 2033
- Table 16: Global Hydroponics Nutrients Industry Revenue Million Forecast, by Production Analysis 2020 & 2033
- Table 17: Global Hydroponics Nutrients Industry Revenue Million Forecast, by Consumption Analysis 2020 & 2033
- Table 18: Global Hydroponics Nutrients Industry Revenue Million Forecast, by Import Market Analysis (Value & Volume) 2020 & 2033
- Table 19: Global Hydroponics Nutrients Industry Revenue Million Forecast, by Export Market Analysis (Value & Volume) 2020 & 2033
- Table 20: Global Hydroponics Nutrients Industry Revenue Million Forecast, by Price Trend Analysis 2020 & 2033
- Table 21: Global Hydroponics Nutrients Industry Revenue Million Forecast, by Country 2020 & 2033
- Table 22: Brazil Hydroponics Nutrients Industry Revenue (Million) Forecast, by Application 2020 & 2033
- Table 23: Argentina Hydroponics Nutrients Industry Revenue (Million) Forecast, by Application 2020 & 2033
- Table 24: Rest of South America Hydroponics Nutrients Industry Revenue (Million) Forecast, by Application 2020 & 2033
- Table 25: Global Hydroponics Nutrients Industry Revenue Million Forecast, by Production Analysis 2020 & 2033
- Table 26: Global Hydroponics Nutrients Industry Revenue Million Forecast, by Consumption Analysis 2020 & 2033
- Table 27: Global Hydroponics Nutrients Industry Revenue Million Forecast, by Import Market Analysis (Value & Volume) 2020 & 2033
- Table 28: Global Hydroponics Nutrients Industry Revenue Million Forecast, by Export Market Analysis (Value & Volume) 2020 & 2033
- Table 29: Global Hydroponics Nutrients Industry Revenue Million Forecast, by Price Trend Analysis 2020 & 2033
- Table 30: Global Hydroponics Nutrients Industry Revenue Million Forecast, by Country 2020 & 2033
- Table 31: United Kingdom Hydroponics Nutrients Industry Revenue (Million) Forecast, by Application 2020 & 2033
- Table 32: Germany Hydroponics Nutrients Industry Revenue (Million) Forecast, by Application 2020 & 2033
- Table 33: France Hydroponics Nutrients Industry Revenue (Million) Forecast, by Application 2020 & 2033
- Table 34: Italy Hydroponics Nutrients Industry Revenue (Million) Forecast, by Application 2020 & 2033
- Table 35: Spain Hydroponics Nutrients Industry Revenue (Million) Forecast, by Application 2020 & 2033
- Table 36: Russia Hydroponics Nutrients Industry Revenue (Million) Forecast, by Application 2020 & 2033
- Table 37: Benelux Hydroponics Nutrients Industry Revenue (Million) Forecast, by Application 2020 & 2033
- Table 38: Nordics Hydroponics Nutrients Industry Revenue (Million) Forecast, by Application 2020 & 2033
- Table 39: Rest of Europe Hydroponics Nutrients Industry Revenue (Million) Forecast, by Application 2020 & 2033
- Table 40: Global Hydroponics Nutrients Industry Revenue Million Forecast, by Production Analysis 2020 & 2033
- Table 41: Global Hydroponics Nutrients Industry Revenue Million Forecast, by Consumption Analysis 2020 & 2033
- Table 42: Global Hydroponics Nutrients Industry Revenue Million Forecast, by Import Market Analysis (Value & Volume) 2020 & 2033
- Table 43: Global Hydroponics Nutrients Industry Revenue Million Forecast, by Export Market Analysis (Value & Volume) 2020 & 2033
- Table 44: Global Hydroponics Nutrients Industry Revenue Million Forecast, by Price Trend Analysis 2020 & 2033
- Table 45: Global Hydroponics Nutrients Industry Revenue Million Forecast, by Country 2020 & 2033
- Table 46: Turkey Hydroponics Nutrients Industry Revenue (Million) Forecast, by Application 2020 & 2033
- Table 47: Israel Hydroponics Nutrients Industry Revenue (Million) Forecast, by Application 2020 & 2033
- Table 48: GCC Hydroponics Nutrients Industry Revenue (Million) Forecast, by Application 2020 & 2033
- Table 49: North Africa Hydroponics Nutrients Industry Revenue (Million) Forecast, by Application 2020 & 2033
- Table 50: South Africa Hydroponics Nutrients Industry Revenue (Million) Forecast, by Application 2020 & 2033
- Table 51: Rest of Middle East & Africa Hydroponics Nutrients Industry Revenue (Million) Forecast, by Application 2020 & 2033
- Table 52: Global Hydroponics Nutrients Industry Revenue Million Forecast, by Production Analysis 2020 & 2033
- Table 53: Global Hydroponics Nutrients Industry Revenue Million Forecast, by Consumption Analysis 2020 & 2033
- Table 54: Global Hydroponics Nutrients Industry Revenue Million Forecast, by Import Market Analysis (Value & Volume) 2020 & 2033
- Table 55: Global Hydroponics Nutrients Industry Revenue Million Forecast, by Export Market Analysis (Value & Volume) 2020 & 2033
- Table 56: Global Hydroponics Nutrients Industry Revenue Million Forecast, by Price Trend Analysis 2020 & 2033
- Table 57: Global Hydroponics Nutrients Industry Revenue Million Forecast, by Country 2020 & 2033
- Table 58: China Hydroponics Nutrients Industry Revenue (Million) Forecast, by Application 2020 & 2033
- Table 59: India Hydroponics Nutrients Industry Revenue (Million) Forecast, by Application 2020 & 2033
- Table 60: Japan Hydroponics Nutrients Industry Revenue (Million) Forecast, by Application 2020 & 2033
- Table 61: South Korea Hydroponics Nutrients Industry Revenue (Million) Forecast, by Application 2020 & 2033
- Table 62: ASEAN Hydroponics Nutrients Industry Revenue (Million) Forecast, by Application 2020 & 2033
- Table 63: Oceania Hydroponics Nutrients Industry Revenue (Million) Forecast, by Application 2020 & 2033
- Table 64: Rest of Asia Pacific Hydroponics Nutrients Industry Revenue (Million) Forecast, by Application 2020 & 2033
Frequently Asked Questions
1. What is the projected Compound Annual Growth Rate (CAGR) of the Hydroponics Nutrients Industry?
The projected CAGR is approximately 8.80%.
2. Which companies are prominent players in the Hydroponics Nutrients Industry?
Key companies in the market include General hydroponics, LushGro, Am hydro, American Hydroponics (AMHYDRO), HydroGarden Ltd (VitaLink)*List Not Exhaustive, Advanced Hydroponics of Holland, Nutrifield, Emerald Harvest, Watercircle hydroponics pte ltd, X Nutrients.
3. What are the main segments of the Hydroponics Nutrients Industry?
The market segments include Production Analysis, Consumption Analysis, Import Market Analysis (Value & Volume), Export Market Analysis (Value & Volume), Price Trend Analysis.
4. Can you provide details about the market size?
The market size is estimated to be USD XX Million as of 2022.
5. What are some drivers contributing to market growth?
Increasing Demand for Tomato; Adoption of Greenhouse Technology in Tomato Cultivation; Government support.
6. What are the notable trends driving market growth?
Hydroponics holds major share among various indoor farming systems..
7. Are there any restraints impacting market growth?
Increasing Loses due to Physiological Disorder. Pest and Disease; Unfavourable Climatic Condition.
8. Can you provide examples of recent developments in the market?
N/A
9. What pricing options are available for accessing the report?
Pricing options include single-user, multi-user, and enterprise licenses priced at USD 4750, USD 5250, and USD 8750 respectively.
10. Is the market size provided in terms of value or volume?
The market size is provided in terms of value, measured in Million.
11. Are there any specific market keywords associated with the report?
Yes, the market keyword associated with the report is "Hydroponics Nutrients Industry," which aids in identifying and referencing the specific market segment covered.
12. How do I determine which pricing option suits my needs best?
The pricing options vary based on user requirements and access needs. Individual users may opt for single-user licenses, while businesses requiring broader access may choose multi-user or enterprise licenses for cost-effective access to the report.
13. Are there any additional resources or data provided in the Hydroponics Nutrients Industry report?
While the report offers comprehensive insights, it's advisable to review the specific contents or supplementary materials provided to ascertain if additional resources or data are available.
14. How can I stay updated on further developments or reports in the Hydroponics Nutrients Industry?
To stay informed about further developments, trends, and reports in the Hydroponics Nutrients Industry, consider subscribing to industry newsletters, following relevant companies and organizations, or regularly checking reputable industry news sources and publications.
Methodology
Step 1 - Identification of Relevant Samples Size from Population Database


Step 2 - Approaches for Defining Global Market Size (Value, Volume* & Price*)

Note*: In applicable scenarios
Step 3 - Data Sources
Primary Research
- Web Analytics
- Survey Reports
- Research Institute
- Latest Research Reports
- Opinion Leaders
Secondary Research
- Annual Reports
- White Paper
- Latest Press Release
- Industry Association
- Paid Database
- Investor Presentations

Step 4 - Data Triangulation
Involves using different sources of information in order to increase the validity of a study
These sources are likely to be stakeholders in a program - participants, other researchers, program staff, other community members, and so on.
Then we put all data in single framework & apply various statistical tools to find out the dynamic on the market.
During the analysis stage, feedback from the stakeholder groups would be compared to determine areas of agreement as well as areas of divergence