

Key Insights
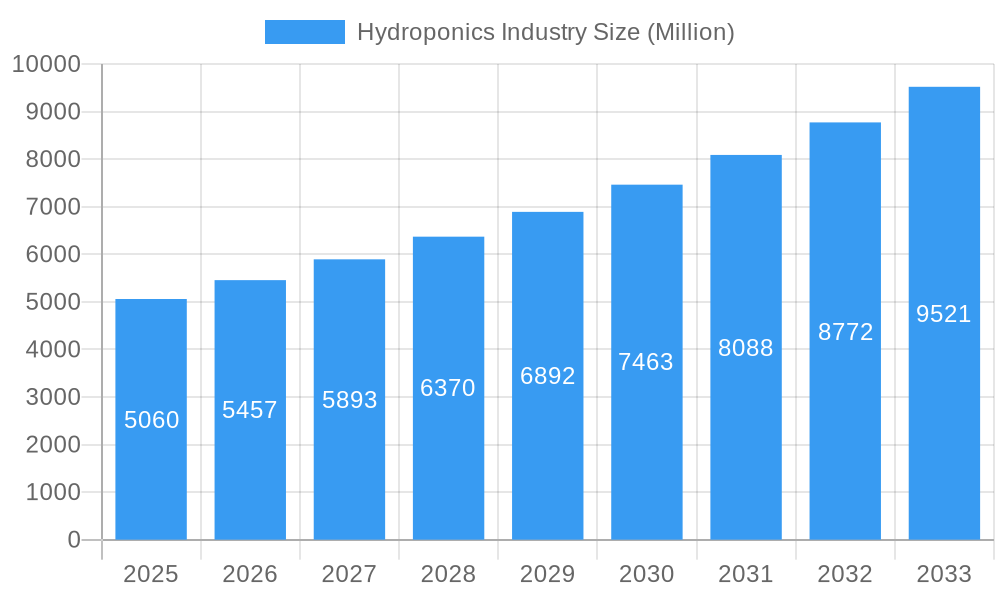
The global hydroponics market, valued at $5.06 billion in 2025, is projected to experience robust growth, driven by a Compound Annual Growth Rate (CAGR) of 7.80% from 2025 to 2033. This expansion is fueled by several key factors. Increasing urbanization and shrinking arable land are forcing a shift towards more efficient and sustainable food production methods. Hydroponics offers a solution, allowing for higher yields in smaller spaces and reduced water consumption compared to traditional agriculture. Consumer demand for fresh, locally sourced produce is also boosting the market, as hydroponic systems enable year-round cultivation, minimizing transportation costs and preserving freshness. Technological advancements in hydroponic systems, such as automated nutrient delivery and environmental control, are further enhancing efficiency and productivity, attracting both large-scale commercial operations and small-scale urban farmers. The segment encompassing leafy greens (lettuce, microgreens) and tomatoes currently dominates the market, reflecting consumer preference and the suitability of these crops for hydroponic cultivation. However, growing adoption across diverse crops like peppers and cucumbers signifies market diversification and future expansion. While initial investment costs can be a restraint for some, the long-term benefits in terms of yield, resource efficiency, and market access are driving significant investment and growth in the industry.

Hydroponics Industry Market Size (In Billion)
The geographical distribution of the hydroponics market reflects varying levels of adoption and technological advancement across regions. North America, particularly the United States, is currently a significant market leader due to early adoption and a strong focus on technological innovation. However, Asia-Pacific is anticipated to witness rapid growth over the forecast period, driven by increasing population density, rising disposable incomes, and government initiatives promoting sustainable agriculture. Europe, with its established agricultural sector and focus on environmentally friendly practices, also represents a substantial and growing market segment. The competitive landscape is characterized by a mix of established multinational corporations like Village Farms International Inc. and smaller, innovative companies focusing on specific niche markets. This competition fosters innovation and drives down costs, making hydroponic solutions more accessible to a wider range of users. Future growth will depend on continuous technological innovation, addressing challenges related to energy consumption, and overcoming the initial capital investment barrier for smaller-scale operators.
Hydroponics Industry Company Market Share
Hydroponics Industry Market Report: 2019-2033
This comprehensive report provides an in-depth analysis of the global hydroponics industry, encompassing market trends, leading players, technological advancements, and future growth projections. With a study period spanning 2019-2033, a base year of 2025, and a forecast period of 2025-2033, this report offers invaluable insights for stakeholders seeking to navigate this dynamic and rapidly evolving sector. The market is projected to reach $XX Billion by 2033, fueled by increasing demand for sustainable and efficient food production solutions.
Hydroponics Industry Market Composition & Trends
The hydroponics industry is characterized by a moderately concentrated market with several key players vying for market share. The market share distribution is currently estimated as follows: Village Farms International Inc. (20%), 4 FreshBox Farms (15%), Bright Farms (12%), Pegasus Agritech (10%), Thanet Eart (8%), and others (35%). Innovation is a key catalyst, with ongoing advancements in system technology, nutrient solutions, and automation driving market growth. The regulatory landscape varies across geographies, impacting market entry and expansion strategies. Substitute products, such as traditional agriculture, face increasing competitive pressure due to the efficiency and sustainability advantages of hydroponics. End-users encompass large-scale commercial producers, small-scale farmers, and even home growers. M&A activity in the sector is robust, with deal values exceeding $XX Billion in the last five years, indicating a consolidation trend amongst major players.
- Market Concentration: Moderately concentrated, with a few dominant players and numerous smaller participants.
- Innovation Catalysts: Advancements in automation, precision nutrient delivery, and LED lighting.
- Regulatory Landscape: Varies significantly by region, impacting market access and investment.
- Substitute Products: Traditional agriculture faces growing competition due to hydroponics' efficiency.
- End-User Profiles: Commercial growers, small-scale farmers, and home growers.
- M&A Activity: Significant activity in recent years, with deal values exceeding $XX Billion.
Hydroponics Industry Evolution
The hydroponics industry has experienced substantial growth over the historical period (2019-2024), driven by increasing consumer demand for fresh, locally sourced produce, coupled with growing concerns about water scarcity and the environmental impact of conventional agriculture. Technological advancements, including automation, improved sensor technology, and data analytics, are boosting efficiency and yield. Consumers are increasingly seeking out sustainably produced food, further fueling market expansion. The compound annual growth rate (CAGR) during the historical period is estimated at XX%, and the forecast period (2025-2033) projects a CAGR of XX%. Adoption of hydroponic systems is increasing across different segments, with commercial growers leading the way, followed by small-scale farmers and eventually home users.
Leading Regions, Countries, or Segments in Hydroponics Industry
North America and Europe currently dominate the hydroponics market, driven by high consumer demand, favorable regulatory environments, and significant investments in research and development. Within these regions, the United States and the Netherlands are leading countries in terms of both production and technological innovation. Among crop types, lettuce and leafy greens are currently the dominant segments, followed by tomatoes, peppers, and cucumbers. The increasing demand for microgreens and other specialty crops is driving further growth in niche segments.
- Key Drivers (North America & Europe):
- High consumer demand for fresh produce.
- Favorable regulatory environments supporting sustainable agriculture.
- Significant investment in research and development.
- Growing consumer preference for locally sourced and sustainably produced food.
- Dominance Factors: High disposable income, technological infrastructure, and supportive government policies.
Hydroponics Industry Product Innovations
Recent innovations focus on enhancing efficiency, yield, and scalability. These include advanced nutrient delivery systems, improved lighting technologies (e.g., LED lighting), sophisticated climate control systems, and automated harvesting solutions. The integration of data analytics and IoT (Internet of Things) technology is revolutionizing farm management, enabling precise control over environmental parameters and optimizing resource allocation. Unique selling propositions often center on yield improvement, water conservation, and reduced pesticide use.
Propelling Factors for Hydroponics Industry Growth
Several factors are driving the growth of the hydroponics industry. Technological advancements are significantly improving efficiency, yield, and overall sustainability. Economic incentives such as government subsidies and tax breaks for sustainable agriculture are fostering market expansion. Regulatory support, in some regions, is promoting the adoption of sustainable farming practices, including hydroponics. Examples include the expansion of vertical farming initiatives in urban areas to address food security and reduce transportation costs.
Obstacles in the Hydroponics Industry Market
High initial investment costs for setting up hydroponic systems can be a significant barrier to entry, particularly for small-scale farmers. Supply chain disruptions, especially concerning specialized equipment and nutrient solutions, can impact production. Competitive pressures from established agricultural businesses and other alternative farming methods present challenges for market penetration. Regulatory hurdles and permitting processes in certain regions can also hamper industry growth. The quantified impact of these barriers is currently estimated at $XX Billion annually in lost potential revenue.
Future Opportunities in Hydroponics Industry
The hydroponics industry presents substantial future growth opportunities. Expansion into new markets, particularly in developing countries facing water scarcity and food security issues, presents a significant potential. Technological breakthroughs, such as AI-driven automation and advanced sensor technologies, will further enhance efficiency and productivity. Emerging consumer trends, such as the increasing preference for healthier and more sustainable food options, provide a robust foundation for long-term growth.
Major Players in the Hydroponics Industry Ecosystem
- 4 FreshBox Farms
- Bright Farms
- Pegasus Agritech
- Hydroponic Crop Producers
- Thanet Eart
- Village Farms International Inc
Key Developments in Hydroponics Industry
- July 2022: Bustanica unveils the world's largest hydroponic farm, receiving a USD 40 million investment.
- October 2022: GrowGeneration Corp expands its retail presence to 17 states.
- January 2024: Bright Farms expands its greenhouse operations to three new locations.
- March 2024: INSONGREEN expands hydroponic production in the Middle East and Africa.
Strategic Hydroponics Industry Market Forecast
The hydroponics industry is poised for significant growth in the coming years, driven by technological innovations, increasing consumer demand for sustainably produced food, and supportive government policies. The forecast period (2025-2033) indicates substantial market expansion, with opportunities in emerging markets and technological advancements providing key growth catalysts. The overall market potential is significant, promising substantial returns for investors and stakeholders in this rapidly evolving sector.
Hydroponics Industry Segmentation
- 1. Production Analysis
- 2. Consumption Analysis
- 3. Import Market Analysis (Value & Volume)
- 4. Export Market Analysis (Value & Volume)
- 5. Price Trend Analysis
Hydroponics Industry Segmentation By Geography
-
1. North America
- 1.1. United States
- 1.2. Canada
- 1.3. Mexico
-
2. South America
- 2.1. Brazil
- 2.2. Argentina
- 2.3. Rest of South America
-
3. Europe
- 3.1. United Kingdom
- 3.2. Germany
- 3.3. France
- 3.4. Italy
- 3.5. Spain
- 3.6. Russia
- 3.7. Benelux
- 3.8. Nordics
- 3.9. Rest of Europe
-
4. Middle East & Africa
- 4.1. Turkey
- 4.2. Israel
- 4.3. GCC
- 4.4. North Africa
- 4.5. South Africa
- 4.6. Rest of Middle East & Africa
-
5. Asia Pacific
- 5.1. China
- 5.2. India
- 5.3. Japan
- 5.4. South Korea
- 5.5. ASEAN
- 5.6. Oceania
- 5.7. Rest of Asia Pacific

Hydroponics Industry Regional Market Share
Geographic Coverage of Hydroponics Industry
Hydroponics Industry REPORT HIGHLIGHTS
| Aspects | Details |
|---|---|
| Study Period | 2020-2034 |
| Base Year | 2025 |
| Estimated Year | 2026 |
| Forecast Period | 2026-2034 |
| Historical Period | 2020-2025 |
| Growth Rate | CAGR of 7.80% from 2020-2034 |
| Segmentation |
|
Table of Contents
- 1. Introduction
- 1.1. Research Scope
- 1.2. Market Segmentation
- 1.3. Research Objective
- 1.4. Definitions and Assumptions
- 2. Executive Summary
- 2.1. Market Snapshot
- 3. Market Dynamics
- 3.1. Market Drivers
- 3.2. Market Restrains
- 3.3. Market Trends
- 3.4. Market Opportunities
- 4. Market Factor Analysis
- 4.1. Porters Five Forces
- 4.1.1. Bargaining Power of Suppliers
- 4.1.2. Bargaining Power of Buyers
- 4.1.3. Threat of New Entrants
- 4.1.4. Threat of Substitutes
- 4.1.5. Competitive Rivalry
- 4.2. PESTEL analysis
- 4.3. BCG Analysis
- 4.3.1. Stars (High Growth, High Market Share)
- 4.3.2. Cash Cows (Low Growth, High Market Share)
- 4.3.3. Question Mark (High Growth, Low Market Share)
- 4.3.4. Dogs (Low Growth, Low Market Share)
- 4.4. Ansoff Matrix Analysis
- 4.5. Supply Chain Analysis
- 4.6. Regulatory Landscape
- 4.7. Current Market Potential and Opportunity Assessment (TAM–SAM–SOM Framework)
- 4.8. DMV Analyst Note
- 4.1. Porters Five Forces
- 5. Market Analysis, Insights and Forecast 2021-2033
- 5.1. Market Analysis, Insights and Forecast - by Production Analysis
- 5.2. Market Analysis, Insights and Forecast - by Consumption Analysis
- 5.3. Market Analysis, Insights and Forecast - by Import Market Analysis (Value & Volume)
- 5.4. Market Analysis, Insights and Forecast - by Export Market Analysis (Value & Volume)
- 5.5. Market Analysis, Insights and Forecast - by Price Trend Analysis
- 5.6. Market Analysis, Insights and Forecast - by Region
- 5.6.1. North America
- 5.6.2. South America
- 5.6.3. Europe
- 5.6.4. Middle East & Africa
- 5.6.5. Asia Pacific
- 6. Global Hydroponics Industry Analysis, Insights and Forecast, 2021-2033
- 6.1. Market Analysis, Insights and Forecast - by Production Analysis
- 6.2. Market Analysis, Insights and Forecast - by Consumption Analysis
- 6.3. Market Analysis, Insights and Forecast - by Import Market Analysis (Value & Volume)
- 6.4. Market Analysis, Insights and Forecast - by Export Market Analysis (Value & Volume)
- 6.5. Market Analysis, Insights and Forecast - by Price Trend Analysis
- 7. North America Hydroponics Industry Analysis, Insights and Forecast, 2020-2032
- 7.1. Market Analysis, Insights and Forecast - by Production Analysis
- 7.2. Market Analysis, Insights and Forecast - by Consumption Analysis
- 7.3. Market Analysis, Insights and Forecast - by Import Market Analysis (Value & Volume)
- 7.4. Market Analysis, Insights and Forecast - by Export Market Analysis (Value & Volume)
- 7.5. Market Analysis, Insights and Forecast - by Price Trend Analysis
- 8. South America Hydroponics Industry Analysis, Insights and Forecast, 2020-2032
- 8.1. Market Analysis, Insights and Forecast - by Production Analysis
- 8.2. Market Analysis, Insights and Forecast - by Consumption Analysis
- 8.3. Market Analysis, Insights and Forecast - by Import Market Analysis (Value & Volume)
- 8.4. Market Analysis, Insights and Forecast - by Export Market Analysis (Value & Volume)
- 8.5. Market Analysis, Insights and Forecast - by Price Trend Analysis
- 9. Europe Hydroponics Industry Analysis, Insights and Forecast, 2020-2032
- 9.1. Market Analysis, Insights and Forecast - by Production Analysis
- 9.2. Market Analysis, Insights and Forecast - by Consumption Analysis
- 9.3. Market Analysis, Insights and Forecast - by Import Market Analysis (Value & Volume)
- 9.4. Market Analysis, Insights and Forecast - by Export Market Analysis (Value & Volume)
- 9.5. Market Analysis, Insights and Forecast - by Price Trend Analysis
- 10. Middle East & Africa Hydroponics Industry Analysis, Insights and Forecast, 2020-2032
- 10.1. Market Analysis, Insights and Forecast - by Production Analysis
- 10.2. Market Analysis, Insights and Forecast - by Consumption Analysis
- 10.3. Market Analysis, Insights and Forecast - by Import Market Analysis (Value & Volume)
- 10.4. Market Analysis, Insights and Forecast - by Export Market Analysis (Value & Volume)
- 10.5. Market Analysis, Insights and Forecast - by Price Trend Analysis
- 11. Asia Pacific Hydroponics Industry Analysis, Insights and Forecast, 2020-2032
- 11.1. Market Analysis, Insights and Forecast - by Production Analysis
- 11.2. Market Analysis, Insights and Forecast - by Consumption Analysis
- 11.3. Market Analysis, Insights and Forecast - by Import Market Analysis (Value & Volume)
- 11.4. Market Analysis, Insights and Forecast - by Export Market Analysis (Value & Volume)
- 11.5. Market Analysis, Insights and Forecast - by Price Trend Analysis
- 12. Competitive Analysis
- 12.1. Company Profiles
- 12.1.1 4 FreshBox Farms
- 12.1.1.1. Company Overview
- 12.1.1.2. Products
- 12.1.1.3. Company Financials
- 12.1.1.4. SWOT Analysis
- 12.1.2 1 Bright Farms
- 12.1.2.1. Company Overview
- 12.1.2.2. Products
- 12.1.2.3. Company Financials
- 12.1.2.4. SWOT Analysis
- 12.1.3 3 Pegasus Agritech
- 12.1.3.1. Company Overview
- 12.1.3.2. Products
- 12.1.3.3. Company Financials
- 12.1.3.4. SWOT Analysis
- 12.1.4 Hydroponic Crop Producers
- 12.1.4.1. Company Overview
- 12.1.4.2. Products
- 12.1.4.3. Company Financials
- 12.1.4.4. SWOT Analysis
- 12.1.5 5 Thanet Eart
- 12.1.5.1. Company Overview
- 12.1.5.2. Products
- 12.1.5.3. Company Financials
- 12.1.5.4. SWOT Analysis
- 12.1.6 2 Village Farms International Inc
- 12.1.6.1. Company Overview
- 12.1.6.2. Products
- 12.1.6.3. Company Financials
- 12.1.6.4. SWOT Analysis
- 12.1.1 4 FreshBox Farms
- 12.2. Market Entropy
- 12.2.1 Company's Key Areas Served
- 12.2.2 Recent Developments
- 12.3. Company Market Share Analysis 2025
- 12.3.1 Top 5 Companies Market Share Analysis
- 12.3.2 Top 3 Companies Market Share Analysis
- 12.4. List of Potential Customers
- 13. Research Methodology
List of Figures
- Figure 1: Global Hydroponics Industry Revenue Breakdown (Million, %) by Region 2025 & 2033
- Figure 2: North America Hydroponics Industry Revenue (Million), by Production Analysis 2025 & 2033
- Figure 3: North America Hydroponics Industry Revenue Share (%), by Production Analysis 2025 & 2033
- Figure 4: North America Hydroponics Industry Revenue (Million), by Consumption Analysis 2025 & 2033
- Figure 5: North America Hydroponics Industry Revenue Share (%), by Consumption Analysis 2025 & 2033
- Figure 6: North America Hydroponics Industry Revenue (Million), by Import Market Analysis (Value & Volume) 2025 & 2033
- Figure 7: North America Hydroponics Industry Revenue Share (%), by Import Market Analysis (Value & Volume) 2025 & 2033
- Figure 8: North America Hydroponics Industry Revenue (Million), by Export Market Analysis (Value & Volume) 2025 & 2033
- Figure 9: North America Hydroponics Industry Revenue Share (%), by Export Market Analysis (Value & Volume) 2025 & 2033
- Figure 10: North America Hydroponics Industry Revenue (Million), by Price Trend Analysis 2025 & 2033
- Figure 11: North America Hydroponics Industry Revenue Share (%), by Price Trend Analysis 2025 & 2033
- Figure 12: North America Hydroponics Industry Revenue (Million), by Country 2025 & 2033
- Figure 13: North America Hydroponics Industry Revenue Share (%), by Country 2025 & 2033
- Figure 14: South America Hydroponics Industry Revenue (Million), by Production Analysis 2025 & 2033
- Figure 15: South America Hydroponics Industry Revenue Share (%), by Production Analysis 2025 & 2033
- Figure 16: South America Hydroponics Industry Revenue (Million), by Consumption Analysis 2025 & 2033
- Figure 17: South America Hydroponics Industry Revenue Share (%), by Consumption Analysis 2025 & 2033
- Figure 18: South America Hydroponics Industry Revenue (Million), by Import Market Analysis (Value & Volume) 2025 & 2033
- Figure 19: South America Hydroponics Industry Revenue Share (%), by Import Market Analysis (Value & Volume) 2025 & 2033
- Figure 20: South America Hydroponics Industry Revenue (Million), by Export Market Analysis (Value & Volume) 2025 & 2033
- Figure 21: South America Hydroponics Industry Revenue Share (%), by Export Market Analysis (Value & Volume) 2025 & 2033
- Figure 22: South America Hydroponics Industry Revenue (Million), by Price Trend Analysis 2025 & 2033
- Figure 23: South America Hydroponics Industry Revenue Share (%), by Price Trend Analysis 2025 & 2033
- Figure 24: South America Hydroponics Industry Revenue (Million), by Country 2025 & 2033
- Figure 25: South America Hydroponics Industry Revenue Share (%), by Country 2025 & 2033
- Figure 26: Europe Hydroponics Industry Revenue (Million), by Production Analysis 2025 & 2033
- Figure 27: Europe Hydroponics Industry Revenue Share (%), by Production Analysis 2025 & 2033
- Figure 28: Europe Hydroponics Industry Revenue (Million), by Consumption Analysis 2025 & 2033
- Figure 29: Europe Hydroponics Industry Revenue Share (%), by Consumption Analysis 2025 & 2033
- Figure 30: Europe Hydroponics Industry Revenue (Million), by Import Market Analysis (Value & Volume) 2025 & 2033
- Figure 31: Europe Hydroponics Industry Revenue Share (%), by Import Market Analysis (Value & Volume) 2025 & 2033
- Figure 32: Europe Hydroponics Industry Revenue (Million), by Export Market Analysis (Value & Volume) 2025 & 2033
- Figure 33: Europe Hydroponics Industry Revenue Share (%), by Export Market Analysis (Value & Volume) 2025 & 2033
- Figure 34: Europe Hydroponics Industry Revenue (Million), by Price Trend Analysis 2025 & 2033
- Figure 35: Europe Hydroponics Industry Revenue Share (%), by Price Trend Analysis 2025 & 2033
- Figure 36: Europe Hydroponics Industry Revenue (Million), by Country 2025 & 2033
- Figure 37: Europe Hydroponics Industry Revenue Share (%), by Country 2025 & 2033
- Figure 38: Middle East & Africa Hydroponics Industry Revenue (Million), by Production Analysis 2025 & 2033
- Figure 39: Middle East & Africa Hydroponics Industry Revenue Share (%), by Production Analysis 2025 & 2033
- Figure 40: Middle East & Africa Hydroponics Industry Revenue (Million), by Consumption Analysis 2025 & 2033
- Figure 41: Middle East & Africa Hydroponics Industry Revenue Share (%), by Consumption Analysis 2025 & 2033
- Figure 42: Middle East & Africa Hydroponics Industry Revenue (Million), by Import Market Analysis (Value & Volume) 2025 & 2033
- Figure 43: Middle East & Africa Hydroponics Industry Revenue Share (%), by Import Market Analysis (Value & Volume) 2025 & 2033
- Figure 44: Middle East & Africa Hydroponics Industry Revenue (Million), by Export Market Analysis (Value & Volume) 2025 & 2033
- Figure 45: Middle East & Africa Hydroponics Industry Revenue Share (%), by Export Market Analysis (Value & Volume) 2025 & 2033
- Figure 46: Middle East & Africa Hydroponics Industry Revenue (Million), by Price Trend Analysis 2025 & 2033
- Figure 47: Middle East & Africa Hydroponics Industry Revenue Share (%), by Price Trend Analysis 2025 & 2033
- Figure 48: Middle East & Africa Hydroponics Industry Revenue (Million), by Country 2025 & 2033
- Figure 49: Middle East & Africa Hydroponics Industry Revenue Share (%), by Country 2025 & 2033
- Figure 50: Asia Pacific Hydroponics Industry Revenue (Million), by Production Analysis 2025 & 2033
- Figure 51: Asia Pacific Hydroponics Industry Revenue Share (%), by Production Analysis 2025 & 2033
- Figure 52: Asia Pacific Hydroponics Industry Revenue (Million), by Consumption Analysis 2025 & 2033
- Figure 53: Asia Pacific Hydroponics Industry Revenue Share (%), by Consumption Analysis 2025 & 2033
- Figure 54: Asia Pacific Hydroponics Industry Revenue (Million), by Import Market Analysis (Value & Volume) 2025 & 2033
- Figure 55: Asia Pacific Hydroponics Industry Revenue Share (%), by Import Market Analysis (Value & Volume) 2025 & 2033
- Figure 56: Asia Pacific Hydroponics Industry Revenue (Million), by Export Market Analysis (Value & Volume) 2025 & 2033
- Figure 57: Asia Pacific Hydroponics Industry Revenue Share (%), by Export Market Analysis (Value & Volume) 2025 & 2033
- Figure 58: Asia Pacific Hydroponics Industry Revenue (Million), by Price Trend Analysis 2025 & 2033
- Figure 59: Asia Pacific Hydroponics Industry Revenue Share (%), by Price Trend Analysis 2025 & 2033
- Figure 60: Asia Pacific Hydroponics Industry Revenue (Million), by Country 2025 & 2033
- Figure 61: Asia Pacific Hydroponics Industry Revenue Share (%), by Country 2025 & 2033
List of Tables
- Table 1: Global Hydroponics Industry Revenue Million Forecast, by Production Analysis 2020 & 2033
- Table 2: Global Hydroponics Industry Revenue Million Forecast, by Consumption Analysis 2020 & 2033
- Table 3: Global Hydroponics Industry Revenue Million Forecast, by Import Market Analysis (Value & Volume) 2020 & 2033
- Table 4: Global Hydroponics Industry Revenue Million Forecast, by Export Market Analysis (Value & Volume) 2020 & 2033
- Table 5: Global Hydroponics Industry Revenue Million Forecast, by Price Trend Analysis 2020 & 2033
- Table 6: Global Hydroponics Industry Revenue Million Forecast, by Region 2020 & 2033
- Table 7: Global Hydroponics Industry Revenue Million Forecast, by Production Analysis 2020 & 2033
- Table 8: Global Hydroponics Industry Revenue Million Forecast, by Consumption Analysis 2020 & 2033
- Table 9: Global Hydroponics Industry Revenue Million Forecast, by Import Market Analysis (Value & Volume) 2020 & 2033
- Table 10: Global Hydroponics Industry Revenue Million Forecast, by Export Market Analysis (Value & Volume) 2020 & 2033
- Table 11: Global Hydroponics Industry Revenue Million Forecast, by Price Trend Analysis 2020 & 2033
- Table 12: Global Hydroponics Industry Revenue Million Forecast, by Country 2020 & 2033
- Table 13: United States Hydroponics Industry Revenue (Million) Forecast, by Application 2020 & 2033
- Table 14: Canada Hydroponics Industry Revenue (Million) Forecast, by Application 2020 & 2033
- Table 15: Mexico Hydroponics Industry Revenue (Million) Forecast, by Application 2020 & 2033
- Table 16: Global Hydroponics Industry Revenue Million Forecast, by Production Analysis 2020 & 2033
- Table 17: Global Hydroponics Industry Revenue Million Forecast, by Consumption Analysis 2020 & 2033
- Table 18: Global Hydroponics Industry Revenue Million Forecast, by Import Market Analysis (Value & Volume) 2020 & 2033
- Table 19: Global Hydroponics Industry Revenue Million Forecast, by Export Market Analysis (Value & Volume) 2020 & 2033
- Table 20: Global Hydroponics Industry Revenue Million Forecast, by Price Trend Analysis 2020 & 2033
- Table 21: Global Hydroponics Industry Revenue Million Forecast, by Country 2020 & 2033
- Table 22: Brazil Hydroponics Industry Revenue (Million) Forecast, by Application 2020 & 2033
- Table 23: Argentina Hydroponics Industry Revenue (Million) Forecast, by Application 2020 & 2033
- Table 24: Rest of South America Hydroponics Industry Revenue (Million) Forecast, by Application 2020 & 2033
- Table 25: Global Hydroponics Industry Revenue Million Forecast, by Production Analysis 2020 & 2033
- Table 26: Global Hydroponics Industry Revenue Million Forecast, by Consumption Analysis 2020 & 2033
- Table 27: Global Hydroponics Industry Revenue Million Forecast, by Import Market Analysis (Value & Volume) 2020 & 2033
- Table 28: Global Hydroponics Industry Revenue Million Forecast, by Export Market Analysis (Value & Volume) 2020 & 2033
- Table 29: Global Hydroponics Industry Revenue Million Forecast, by Price Trend Analysis 2020 & 2033
- Table 30: Global Hydroponics Industry Revenue Million Forecast, by Country 2020 & 2033
- Table 31: United Kingdom Hydroponics Industry Revenue (Million) Forecast, by Application 2020 & 2033
- Table 32: Germany Hydroponics Industry Revenue (Million) Forecast, by Application 2020 & 2033
- Table 33: France Hydroponics Industry Revenue (Million) Forecast, by Application 2020 & 2033
- Table 34: Italy Hydroponics Industry Revenue (Million) Forecast, by Application 2020 & 2033
- Table 35: Spain Hydroponics Industry Revenue (Million) Forecast, by Application 2020 & 2033
- Table 36: Russia Hydroponics Industry Revenue (Million) Forecast, by Application 2020 & 2033
- Table 37: Benelux Hydroponics Industry Revenue (Million) Forecast, by Application 2020 & 2033
- Table 38: Nordics Hydroponics Industry Revenue (Million) Forecast, by Application 2020 & 2033
- Table 39: Rest of Europe Hydroponics Industry Revenue (Million) Forecast, by Application 2020 & 2033
- Table 40: Global Hydroponics Industry Revenue Million Forecast, by Production Analysis 2020 & 2033
- Table 41: Global Hydroponics Industry Revenue Million Forecast, by Consumption Analysis 2020 & 2033
- Table 42: Global Hydroponics Industry Revenue Million Forecast, by Import Market Analysis (Value & Volume) 2020 & 2033
- Table 43: Global Hydroponics Industry Revenue Million Forecast, by Export Market Analysis (Value & Volume) 2020 & 2033
- Table 44: Global Hydroponics Industry Revenue Million Forecast, by Price Trend Analysis 2020 & 2033
- Table 45: Global Hydroponics Industry Revenue Million Forecast, by Country 2020 & 2033
- Table 46: Turkey Hydroponics Industry Revenue (Million) Forecast, by Application 2020 & 2033
- Table 47: Israel Hydroponics Industry Revenue (Million) Forecast, by Application 2020 & 2033
- Table 48: GCC Hydroponics Industry Revenue (Million) Forecast, by Application 2020 & 2033
- Table 49: North Africa Hydroponics Industry Revenue (Million) Forecast, by Application 2020 & 2033
- Table 50: South Africa Hydroponics Industry Revenue (Million) Forecast, by Application 2020 & 2033
- Table 51: Rest of Middle East & Africa Hydroponics Industry Revenue (Million) Forecast, by Application 2020 & 2033
- Table 52: Global Hydroponics Industry Revenue Million Forecast, by Production Analysis 2020 & 2033
- Table 53: Global Hydroponics Industry Revenue Million Forecast, by Consumption Analysis 2020 & 2033
- Table 54: Global Hydroponics Industry Revenue Million Forecast, by Import Market Analysis (Value & Volume) 2020 & 2033
- Table 55: Global Hydroponics Industry Revenue Million Forecast, by Export Market Analysis (Value & Volume) 2020 & 2033
- Table 56: Global Hydroponics Industry Revenue Million Forecast, by Price Trend Analysis 2020 & 2033
- Table 57: Global Hydroponics Industry Revenue Million Forecast, by Country 2020 & 2033
- Table 58: China Hydroponics Industry Revenue (Million) Forecast, by Application 2020 & 2033
- Table 59: India Hydroponics Industry Revenue (Million) Forecast, by Application 2020 & 2033
- Table 60: Japan Hydroponics Industry Revenue (Million) Forecast, by Application 2020 & 2033
- Table 61: South Korea Hydroponics Industry Revenue (Million) Forecast, by Application 2020 & 2033
- Table 62: ASEAN Hydroponics Industry Revenue (Million) Forecast, by Application 2020 & 2033
- Table 63: Oceania Hydroponics Industry Revenue (Million) Forecast, by Application 2020 & 2033
- Table 64: Rest of Asia Pacific Hydroponics Industry Revenue (Million) Forecast, by Application 2020 & 2033
Frequently Asked Questions
1. What is the projected Compound Annual Growth Rate (CAGR) of the Hydroponics Industry?
The projected CAGR is approximately 7.80%.
2. Which companies are prominent players in the Hydroponics Industry?
Key companies in the market include 4 FreshBox Farms, 1 Bright Farms, 3 Pegasus Agritech, Hydroponic Crop Producers, 5 Thanet Eart, 2 Village Farms International Inc.
3. What are the main segments of the Hydroponics Industry?
The market segments include Production Analysis, Consumption Analysis, Import Market Analysis (Value & Volume), Export Market Analysis (Value & Volume), Price Trend Analysis.
4. Can you provide details about the market size?
The market size is estimated to be USD 5.06 Million as of 2022.
5. What are some drivers contributing to market growth?
Need for Custom Product Development; Use of CROs for Regulatory Services.
6. What are the notable trends driving market growth?
Higher Consumption of Salads and Exotic Vegetables.
7. Are there any restraints impacting market growth?
Data and Cyber Security Concerns; Lack of Experts and Professionals in this Industry.
8. Can you provide examples of recent developments in the market?
March 2024: INSONGREEN announced a significant expansion of its hydroponic and vertical greenhouse production in the Middle East and Africa. This initiative aims to tackle regional water scarcity and food security challenges by utilizing advanced agricultural technologies for sustainable development.
9. What pricing options are available for accessing the report?
Pricing options include single-user, multi-user, and enterprise licenses priced at USD 4750, USD 5250, and USD 8750 respectively.
10. Is the market size provided in terms of value or volume?
The market size is provided in terms of value, measured in Million.
11. Are there any specific market keywords associated with the report?
Yes, the market keyword associated with the report is "Hydroponics Industry," which aids in identifying and referencing the specific market segment covered.
12. How do I determine which pricing option suits my needs best?
The pricing options vary based on user requirements and access needs. Individual users may opt for single-user licenses, while businesses requiring broader access may choose multi-user or enterprise licenses for cost-effective access to the report.
13. Are there any additional resources or data provided in the Hydroponics Industry report?
While the report offers comprehensive insights, it's advisable to review the specific contents or supplementary materials provided to ascertain if additional resources or data are available.
14. How can I stay updated on further developments or reports in the Hydroponics Industry?
To stay informed about further developments, trends, and reports in the Hydroponics Industry, consider subscribing to industry newsletters, following relevant companies and organizations, or regularly checking reputable industry news sources and publications.
Methodology
Step 1 - Identification of Relevant Samples Size from Population Database


Step 2 - Approaches for Defining Global Market Size (Value, Volume* & Price*)

Note*: In applicable scenarios
Step 3 - Data Sources
Primary Research
- Web Analytics
- Survey Reports
- Research Institute
- Latest Research Reports
- Opinion Leaders
Secondary Research
- Annual Reports
- White Paper
- Latest Press Release
- Industry Association
- Paid Database
- Investor Presentations

Step 4 - Data Triangulation
Involves using different sources of information in order to increase the validity of a study
These sources are likely to be stakeholders in a program - participants, other researchers, program staff, other community members, and so on.
Then we put all data in single framework & apply various statistical tools to find out the dynamic on the market.
During the analysis stage, feedback from the stakeholder groups would be compared to determine areas of agreement as well as areas of divergence