

Key Insights
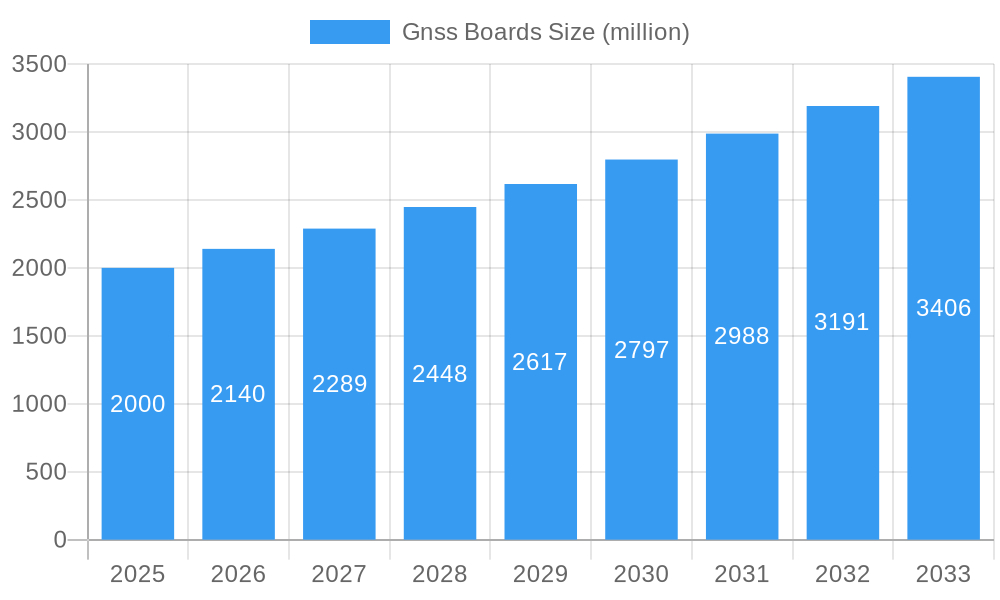
The GNSS Boards market is experiencing robust growth, driven by increasing demand across various sectors. The market, estimated at $2 billion in 2025, is projected to witness a Compound Annual Growth Rate (CAGR) of 7% from 2025 to 2033, reaching approximately $3.5 billion by 2033. This expansion is fueled by several key factors, including the proliferation of smart devices, autonomous vehicles, precision agriculture applications, and the growing adoption of location-based services. The integration of GNSS technology into diverse applications necessitates high-performance, reliable, and cost-effective boards, driving innovation and competition within the market. Emerging trends like the development of multi-constellation GNSS receivers and the increasing integration of advanced features like inertial measurement units (IMUs) are further bolstering market growth. However, challenges such as the cost of advanced GNSS technology, potential signal interference, and the need for sophisticated data processing capabilities act as restraints to some degree. Key players like Trimble, NovAtel, and u-blox are leveraging their expertise in technology and market positioning to maintain their competitive edge. The market is segmented geographically, with North America and Europe currently holding significant shares, but emerging economies in Asia-Pacific and Latin America are expected to show considerable growth in the forecast period.
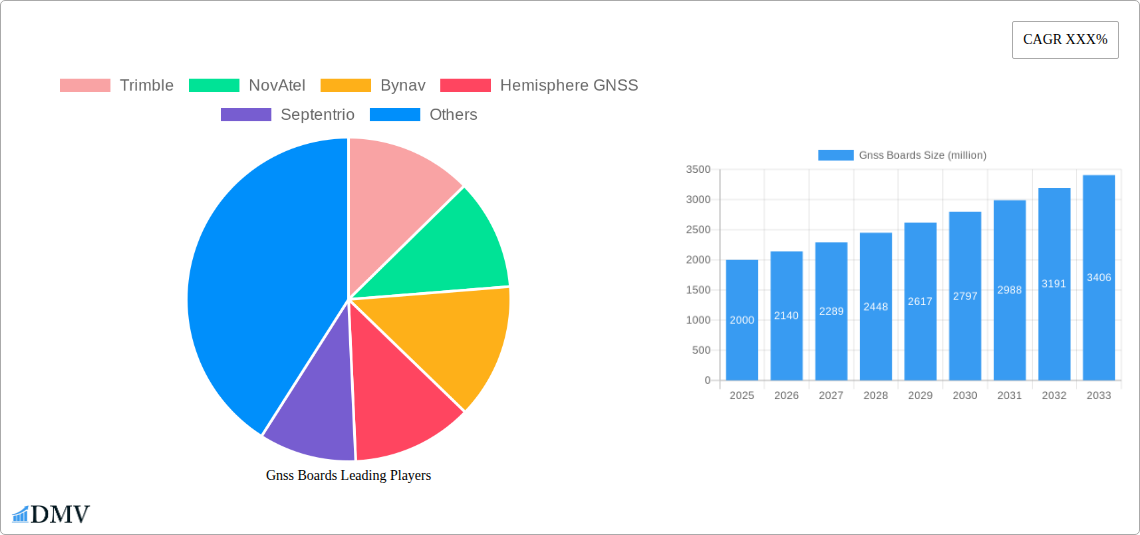
Gnss Boards Market Size (In Billion)
The competitive landscape is characterized by both established industry giants and innovative startups. Trimble, NovAtel, and Hemisphere GNSS maintain strong market positions due to their extensive experience and comprehensive product portfolios. However, emerging companies such as Swift Navigation and ComNav Technology are challenging the incumbents through the introduction of cutting-edge technologies and competitive pricing strategies. The market is witnessing a trend towards modular and customizable GNSS boards, allowing manufacturers to tailor solutions to specific application requirements. This trend, along with the rising demand for high-precision positioning and robust signal processing, will likely shape the future trajectory of the GNSS boards market. Continuous advancements in GNSS technology, including the adoption of new satellite constellations and improved signal processing algorithms, will further propel market growth.
Gnss Boards Company Market Share
Unlocking the Potential of the Multi-Million Dollar GNSS Boards Market: A Comprehensive Report (2019-2033)
This insightful report provides a comprehensive analysis of the global GNSS Boards market, projecting a multi-million dollar valuation by 2033. Spanning the historical period (2019-2024), base year (2025), and forecast period (2025-2033), this study offers critical insights for stakeholders seeking to navigate this dynamic landscape. The report meticulously examines market composition, technological advancements, regional dominance, and key players, delivering actionable intelligence for strategic decision-making. The estimated market value in 2025 is projected to be $XX million.
Gnss Boards Market Composition & Trends
This section delves into the intricate dynamics of the GNSS Boards market, evaluating its competitive intensity, innovation drivers, regulatory environment, substitute technologies, and end-user landscape. The study period (2019-2024) reveals significant shifts in market share distribution, with a detailed breakdown provided for key players such as Trimble, NovAtel, and u-blox. The report also analyzes M&A activities, quantifying deal values in millions of dollars and assessing their impact on market consolidation.
- Market Concentration: The market exhibits a moderately concentrated structure with a few dominant players holding significant market share. Specific market share distribution data for 2024 will be detailed in the full report.
- Innovation Catalysts: Technological advancements in chipsets, increased integration of AI capabilities, and miniaturization are driving innovation.
- Regulatory Landscape: Compliance with international standards and regulations influences market growth trajectories and shapes technology adoption.
- Substitute Products: Competition from alternative positioning technologies is examined, analyzing potential market share erosion and technological disruptions.
- End-User Profiles: This section profiles key end-users in various segments, highlighting their specific demands and adoption patterns.
- M&A Activities: An in-depth analysis of mergers and acquisitions in the industry, including deal values (in millions of dollars) and their impact on the competitive landscape, is presented.
Gnss Boards Industry Evolution
This section offers a detailed chronological analysis of the GNSS Boards market evolution from 2019 to 2033, revealing growth trajectories, technological leaps, and evolving consumer demands. The report includes specific data points such as compound annual growth rates (CAGR) for various segments and adoption rates of cutting-edge technologies like multi-constellation GNSS. The market is projected to experience substantial growth over the forecast period, driven by increasing demand from various applications. A deep dive into the technological advancements influencing market growth includes the rise of multi-frequency GNSS, improved accuracy, and integration with other technologies. The evolution of consumer demands from higher precision and reliability will be carefully examined.
Leading Regions, Countries, or Segments in Gnss Boards
This section identifies the dominant regions and segments within the GNSS Boards market. The report provides a comprehensive analysis of the factors driving this dominance, including investment trends, regulatory support, and market size. Specific regional and segmental market sizes are provided in millions of dollars.
- Dominant Region: [Specify dominant region, e.g., North America]
- Key Drivers for Dominance:
- High levels of government funding in R&D for GNSS technology.
- Strong presence of major GNSS board manufacturers.
- Large demand from key industry segments.
- Favorable regulatory environment.
Gnss Boards Product Innovations
This section showcases recent product innovations in GNSS boards, emphasizing unique selling propositions (USPs) and technological advancements. We will detail performance metrics, highlighting improvements in accuracy, power consumption, and integration capabilities. The analysis emphasizes the crucial role of innovation in driving market expansion and shaping competitive dynamics.
Propelling Factors for Gnss Boards Growth
Several factors are fueling the growth of the GNSS Boards market. These include increasing adoption of location-based services, advancements in GNSS technology, and supportive government initiatives. For example, the rising demand for precise positioning in autonomous vehicles significantly boosts market growth. Furthermore, stricter regulations in specific industries mandating GNSS usage drive market expansion.
Obstacles in the Gnss Boards Market
Despite the substantial growth potential, the GNSS Boards market faces certain challenges. These include supply chain vulnerabilities leading to potential production delays and price volatility. Moreover, intense competition from existing and emerging players necessitates constant innovation and efficient cost management to maintain profitability.
Future Opportunities in Gnss Boards
The GNSS Boards market presents several lucrative opportunities in emerging sectors like precision agriculture, smart infrastructure, and unmanned aerial vehicles (UAVs). Furthermore, the integration of GNSS with other technologies such as 5G and IoT offers significant expansion potential. The development of new, more resilient GNSS boards capable of overcoming jamming and spoofing techniques is also a significant growth opportunity.
Major Players in the Gnss Boards Ecosystem
- Trimble
- NovAtel
- Bynav
- Hemisphere GNSS
- Septentrio
- Topcon
- Saphyrion
- ComNav Technology Ltd
- u-blox
- Swift Navigation, Inc
- Unicore Communications, Inc
Key Developments in Gnss Boards Industry
- [Month, Year]: [Company Name] launches a new GNSS board with enhanced accuracy and power efficiency.
- [Month, Year]: Significant M&A activity involving [Company A] and [Company B], impacting market share distribution.
- [Month, Year]: A new industry standard is adopted, impacting product development and manufacturing.
Strategic Gnss Boards Market Forecast
The GNSS Boards market is poised for sustained growth over the forecast period, driven by continuous technological advancements, expanding applications in diverse sectors, and supportive government policies. The increasing demand for precision positioning in autonomous vehicles, robotics, and infrastructure development will significantly fuel market expansion. The market is expected to achieve significant value in millions of dollars by 2033.
Gnss Boards Segmentation
-
1. Application
- 1.1. Autopilot
- 1.2. Precision Agriculture
- 1.3. Surveying and Mapping
- 1.4. Drone
- 1.5. Traffic
- 1.6. Others
-
2. Type
- 2.1. Single Frequency
- 2.2. Multi-frequency
Gnss Boards Segmentation By Geography
-
1. North America
- 1.1. United States
- 1.2. Canada
- 1.3. Mexico
-
2. South America
- 2.1. Brazil
- 2.2. Argentina
- 2.3. Rest of South America
-
3. Europe
- 3.1. United Kingdom
- 3.2. Germany
- 3.3. France
- 3.4. Italy
- 3.5. Spain
- 3.6. Russia
- 3.7. Benelux
- 3.8. Nordics
- 3.9. Rest of Europe
-
4. Middle East & Africa
- 4.1. Turkey
- 4.2. Israel
- 4.3. GCC
- 4.4. North Africa
- 4.5. South Africa
- 4.6. Rest of Middle East & Africa
-
5. Asia Pacific
- 5.1. China
- 5.2. India
- 5.3. Japan
- 5.4. South Korea
- 5.5. ASEAN
- 5.6. Oceania
- 5.7. Rest of Asia Pacific

Gnss Boards Regional Market Share
Geographic Coverage of Gnss Boards
Gnss Boards REPORT HIGHLIGHTS
| Aspects | Details |
|---|---|
| Study Period | 2020-2034 |
| Base Year | 2025 |
| Estimated Year | 2026 |
| Forecast Period | 2026-2034 |
| Historical Period | 2020-2025 |
| Growth Rate | CAGR of XXX% from 2020-2034 |
| Segmentation |
|
Table of Contents
- 1. Introduction
- 1.1. Research Scope
- 1.2. Market Segmentation
- 1.3. Research Methodology
- 1.4. Definitions and Assumptions
- 2. Executive Summary
- 2.1. Introduction
- 3. Market Dynamics
- 3.1. Introduction
- 3.2. Market Drivers
- 3.3. Market Restrains
- 3.4. Market Trends
- 4. Market Factor Analysis
- 4.1. Porters Five Forces
- 4.2. Supply/Value Chain
- 4.3. PESTEL analysis
- 4.4. Market Entropy
- 4.5. Patent/Trademark Analysis
- 5. Global Gnss Boards Analysis, Insights and Forecast, 2020-2032
- 5.1. Market Analysis, Insights and Forecast - by Application
- 5.1.1. Autopilot
- 5.1.2. Precision Agriculture
- 5.1.3. Surveying and Mapping
- 5.1.4. Drone
- 5.1.5. Traffic
- 5.1.6. Others
- 5.2. Market Analysis, Insights and Forecast - by Type
- 5.2.1. Single Frequency
- 5.2.2. Multi-frequency
- 5.3. Market Analysis, Insights and Forecast - by Region
- 5.3.1. North America
- 5.3.2. South America
- 5.3.3. Europe
- 5.3.4. Middle East & Africa
- 5.3.5. Asia Pacific
- 5.1. Market Analysis, Insights and Forecast - by Application
- 6. North America Gnss Boards Analysis, Insights and Forecast, 2020-2032
- 6.1. Market Analysis, Insights and Forecast - by Application
- 6.1.1. Autopilot
- 6.1.2. Precision Agriculture
- 6.1.3. Surveying and Mapping
- 6.1.4. Drone
- 6.1.5. Traffic
- 6.1.6. Others
- 6.2. Market Analysis, Insights and Forecast - by Type
- 6.2.1. Single Frequency
- 6.2.2. Multi-frequency
- 6.1. Market Analysis, Insights and Forecast - by Application
- 7. South America Gnss Boards Analysis, Insights and Forecast, 2020-2032
- 7.1. Market Analysis, Insights and Forecast - by Application
- 7.1.1. Autopilot
- 7.1.2. Precision Agriculture
- 7.1.3. Surveying and Mapping
- 7.1.4. Drone
- 7.1.5. Traffic
- 7.1.6. Others
- 7.2. Market Analysis, Insights and Forecast - by Type
- 7.2.1. Single Frequency
- 7.2.2. Multi-frequency
- 7.1. Market Analysis, Insights and Forecast - by Application
- 8. Europe Gnss Boards Analysis, Insights and Forecast, 2020-2032
- 8.1. Market Analysis, Insights and Forecast - by Application
- 8.1.1. Autopilot
- 8.1.2. Precision Agriculture
- 8.1.3. Surveying and Mapping
- 8.1.4. Drone
- 8.1.5. Traffic
- 8.1.6. Others
- 8.2. Market Analysis, Insights and Forecast - by Type
- 8.2.1. Single Frequency
- 8.2.2. Multi-frequency
- 8.1. Market Analysis, Insights and Forecast - by Application
- 9. Middle East & Africa Gnss Boards Analysis, Insights and Forecast, 2020-2032
- 9.1. Market Analysis, Insights and Forecast - by Application
- 9.1.1. Autopilot
- 9.1.2. Precision Agriculture
- 9.1.3. Surveying and Mapping
- 9.1.4. Drone
- 9.1.5. Traffic
- 9.1.6. Others
- 9.2. Market Analysis, Insights and Forecast - by Type
- 9.2.1. Single Frequency
- 9.2.2. Multi-frequency
- 9.1. Market Analysis, Insights and Forecast - by Application
- 10. Asia Pacific Gnss Boards Analysis, Insights and Forecast, 2020-2032
- 10.1. Market Analysis, Insights and Forecast - by Application
- 10.1.1. Autopilot
- 10.1.2. Precision Agriculture
- 10.1.3. Surveying and Mapping
- 10.1.4. Drone
- 10.1.5. Traffic
- 10.1.6. Others
- 10.2. Market Analysis, Insights and Forecast - by Type
- 10.2.1. Single Frequency
- 10.2.2. Multi-frequency
- 10.1. Market Analysis, Insights and Forecast - by Application
- 11. Competitive Analysis
- 11.1. Global Market Share Analysis 2025
- 11.2. Company Profiles
- 11.2.1 Trimble
- 11.2.1.1. Overview
- 11.2.1.2. Products
- 11.2.1.3. SWOT Analysis
- 11.2.1.4. Recent Developments
- 11.2.1.5. Financials (Based on Availability)
- 11.2.2 NovAtel
- 11.2.2.1. Overview
- 11.2.2.2. Products
- 11.2.2.3. SWOT Analysis
- 11.2.2.4. Recent Developments
- 11.2.2.5. Financials (Based on Availability)
- 11.2.3 Bynav
- 11.2.3.1. Overview
- 11.2.3.2. Products
- 11.2.3.3. SWOT Analysis
- 11.2.3.4. Recent Developments
- 11.2.3.5. Financials (Based on Availability)
- 11.2.4 Hemisphere GNSS
- 11.2.4.1. Overview
- 11.2.4.2. Products
- 11.2.4.3. SWOT Analysis
- 11.2.4.4. Recent Developments
- 11.2.4.5. Financials (Based on Availability)
- 11.2.5 Septentrio
- 11.2.5.1. Overview
- 11.2.5.2. Products
- 11.2.5.3. SWOT Analysis
- 11.2.5.4. Recent Developments
- 11.2.5.5. Financials (Based on Availability)
- 11.2.6 Topcon
- 11.2.6.1. Overview
- 11.2.6.2. Products
- 11.2.6.3. SWOT Analysis
- 11.2.6.4. Recent Developments
- 11.2.6.5. Financials (Based on Availability)
- 11.2.7 Saphyrion
- 11.2.7.1. Overview
- 11.2.7.2. Products
- 11.2.7.3. SWOT Analysis
- 11.2.7.4. Recent Developments
- 11.2.7.5. Financials (Based on Availability)
- 11.2.8 ComNav Technology Ltd
- 11.2.8.1. Overview
- 11.2.8.2. Products
- 11.2.8.3. SWOT Analysis
- 11.2.8.4. Recent Developments
- 11.2.8.5. Financials (Based on Availability)
- 11.2.9 u-blox
- 11.2.9.1. Overview
- 11.2.9.2. Products
- 11.2.9.3. SWOT Analysis
- 11.2.9.4. Recent Developments
- 11.2.9.5. Financials (Based on Availability)
- 11.2.10 Swift Navigation Inc
- 11.2.10.1. Overview
- 11.2.10.2. Products
- 11.2.10.3. SWOT Analysis
- 11.2.10.4. Recent Developments
- 11.2.10.5. Financials (Based on Availability)
- 11.2.11 Unicore Communications Inc
- 11.2.11.1. Overview
- 11.2.11.2. Products
- 11.2.11.3. SWOT Analysis
- 11.2.11.4. Recent Developments
- 11.2.11.5. Financials (Based on Availability)
- 11.2.1 Trimble
List of Figures
- Figure 1: Global Gnss Boards Revenue Breakdown (million, %) by Region 2025 & 2033
- Figure 2: Global Gnss Boards Volume Breakdown (K, %) by Region 2025 & 2033
- Figure 3: North America Gnss Boards Revenue (million), by Application 2025 & 2033
- Figure 4: North America Gnss Boards Volume (K), by Application 2025 & 2033
- Figure 5: North America Gnss Boards Revenue Share (%), by Application 2025 & 2033
- Figure 6: North America Gnss Boards Volume Share (%), by Application 2025 & 2033
- Figure 7: North America Gnss Boards Revenue (million), by Type 2025 & 2033
- Figure 8: North America Gnss Boards Volume (K), by Type 2025 & 2033
- Figure 9: North America Gnss Boards Revenue Share (%), by Type 2025 & 2033
- Figure 10: North America Gnss Boards Volume Share (%), by Type 2025 & 2033
- Figure 11: North America Gnss Boards Revenue (million), by Country 2025 & 2033
- Figure 12: North America Gnss Boards Volume (K), by Country 2025 & 2033
- Figure 13: North America Gnss Boards Revenue Share (%), by Country 2025 & 2033
- Figure 14: North America Gnss Boards Volume Share (%), by Country 2025 & 2033
- Figure 15: South America Gnss Boards Revenue (million), by Application 2025 & 2033
- Figure 16: South America Gnss Boards Volume (K), by Application 2025 & 2033
- Figure 17: South America Gnss Boards Revenue Share (%), by Application 2025 & 2033
- Figure 18: South America Gnss Boards Volume Share (%), by Application 2025 & 2033
- Figure 19: South America Gnss Boards Revenue (million), by Type 2025 & 2033
- Figure 20: South America Gnss Boards Volume (K), by Type 2025 & 2033
- Figure 21: South America Gnss Boards Revenue Share (%), by Type 2025 & 2033
- Figure 22: South America Gnss Boards Volume Share (%), by Type 2025 & 2033
- Figure 23: South America Gnss Boards Revenue (million), by Country 2025 & 2033
- Figure 24: South America Gnss Boards Volume (K), by Country 2025 & 2033
- Figure 25: South America Gnss Boards Revenue Share (%), by Country 2025 & 2033
- Figure 26: South America Gnss Boards Volume Share (%), by Country 2025 & 2033
- Figure 27: Europe Gnss Boards Revenue (million), by Application 2025 & 2033
- Figure 28: Europe Gnss Boards Volume (K), by Application 2025 & 2033
- Figure 29: Europe Gnss Boards Revenue Share (%), by Application 2025 & 2033
- Figure 30: Europe Gnss Boards Volume Share (%), by Application 2025 & 2033
- Figure 31: Europe Gnss Boards Revenue (million), by Type 2025 & 2033
- Figure 32: Europe Gnss Boards Volume (K), by Type 2025 & 2033
- Figure 33: Europe Gnss Boards Revenue Share (%), by Type 2025 & 2033
- Figure 34: Europe Gnss Boards Volume Share (%), by Type 2025 & 2033
- Figure 35: Europe Gnss Boards Revenue (million), by Country 2025 & 2033
- Figure 36: Europe Gnss Boards Volume (K), by Country 2025 & 2033
- Figure 37: Europe Gnss Boards Revenue Share (%), by Country 2025 & 2033
- Figure 38: Europe Gnss Boards Volume Share (%), by Country 2025 & 2033
- Figure 39: Middle East & Africa Gnss Boards Revenue (million), by Application 2025 & 2033
- Figure 40: Middle East & Africa Gnss Boards Volume (K), by Application 2025 & 2033
- Figure 41: Middle East & Africa Gnss Boards Revenue Share (%), by Application 2025 & 2033
- Figure 42: Middle East & Africa Gnss Boards Volume Share (%), by Application 2025 & 2033
- Figure 43: Middle East & Africa Gnss Boards Revenue (million), by Type 2025 & 2033
- Figure 44: Middle East & Africa Gnss Boards Volume (K), by Type 2025 & 2033
- Figure 45: Middle East & Africa Gnss Boards Revenue Share (%), by Type 2025 & 2033
- Figure 46: Middle East & Africa Gnss Boards Volume Share (%), by Type 2025 & 2033
- Figure 47: Middle East & Africa Gnss Boards Revenue (million), by Country 2025 & 2033
- Figure 48: Middle East & Africa Gnss Boards Volume (K), by Country 2025 & 2033
- Figure 49: Middle East & Africa Gnss Boards Revenue Share (%), by Country 2025 & 2033
- Figure 50: Middle East & Africa Gnss Boards Volume Share (%), by Country 2025 & 2033
- Figure 51: Asia Pacific Gnss Boards Revenue (million), by Application 2025 & 2033
- Figure 52: Asia Pacific Gnss Boards Volume (K), by Application 2025 & 2033
- Figure 53: Asia Pacific Gnss Boards Revenue Share (%), by Application 2025 & 2033
- Figure 54: Asia Pacific Gnss Boards Volume Share (%), by Application 2025 & 2033
- Figure 55: Asia Pacific Gnss Boards Revenue (million), by Type 2025 & 2033
- Figure 56: Asia Pacific Gnss Boards Volume (K), by Type 2025 & 2033
- Figure 57: Asia Pacific Gnss Boards Revenue Share (%), by Type 2025 & 2033
- Figure 58: Asia Pacific Gnss Boards Volume Share (%), by Type 2025 & 2033
- Figure 59: Asia Pacific Gnss Boards Revenue (million), by Country 2025 & 2033
- Figure 60: Asia Pacific Gnss Boards Volume (K), by Country 2025 & 2033
- Figure 61: Asia Pacific Gnss Boards Revenue Share (%), by Country 2025 & 2033
- Figure 62: Asia Pacific Gnss Boards Volume Share (%), by Country 2025 & 2033
List of Tables
- Table 1: Global Gnss Boards Revenue million Forecast, by Application 2020 & 2033
- Table 2: Global Gnss Boards Volume K Forecast, by Application 2020 & 2033
- Table 3: Global Gnss Boards Revenue million Forecast, by Type 2020 & 2033
- Table 4: Global Gnss Boards Volume K Forecast, by Type 2020 & 2033
- Table 5: Global Gnss Boards Revenue million Forecast, by Region 2020 & 2033
- Table 6: Global Gnss Boards Volume K Forecast, by Region 2020 & 2033
- Table 7: Global Gnss Boards Revenue million Forecast, by Application 2020 & 2033
- Table 8: Global Gnss Boards Volume K Forecast, by Application 2020 & 2033
- Table 9: Global Gnss Boards Revenue million Forecast, by Type 2020 & 2033
- Table 10: Global Gnss Boards Volume K Forecast, by Type 2020 & 2033
- Table 11: Global Gnss Boards Revenue million Forecast, by Country 2020 & 2033
- Table 12: Global Gnss Boards Volume K Forecast, by Country 2020 & 2033
- Table 13: United States Gnss Boards Revenue (million) Forecast, by Application 2020 & 2033
- Table 14: United States Gnss Boards Volume (K) Forecast, by Application 2020 & 2033
- Table 15: Canada Gnss Boards Revenue (million) Forecast, by Application 2020 & 2033
- Table 16: Canada Gnss Boards Volume (K) Forecast, by Application 2020 & 2033
- Table 17: Mexico Gnss Boards Revenue (million) Forecast, by Application 2020 & 2033
- Table 18: Mexico Gnss Boards Volume (K) Forecast, by Application 2020 & 2033
- Table 19: Global Gnss Boards Revenue million Forecast, by Application 2020 & 2033
- Table 20: Global Gnss Boards Volume K Forecast, by Application 2020 & 2033
- Table 21: Global Gnss Boards Revenue million Forecast, by Type 2020 & 2033
- Table 22: Global Gnss Boards Volume K Forecast, by Type 2020 & 2033
- Table 23: Global Gnss Boards Revenue million Forecast, by Country 2020 & 2033
- Table 24: Global Gnss Boards Volume K Forecast, by Country 2020 & 2033
- Table 25: Brazil Gnss Boards Revenue (million) Forecast, by Application 2020 & 2033
- Table 26: Brazil Gnss Boards Volume (K) Forecast, by Application 2020 & 2033
- Table 27: Argentina Gnss Boards Revenue (million) Forecast, by Application 2020 & 2033
- Table 28: Argentina Gnss Boards Volume (K) Forecast, by Application 2020 & 2033
- Table 29: Rest of South America Gnss Boards Revenue (million) Forecast, by Application 2020 & 2033
- Table 30: Rest of South America Gnss Boards Volume (K) Forecast, by Application 2020 & 2033
- Table 31: Global Gnss Boards Revenue million Forecast, by Application 2020 & 2033
- Table 32: Global Gnss Boards Volume K Forecast, by Application 2020 & 2033
- Table 33: Global Gnss Boards Revenue million Forecast, by Type 2020 & 2033
- Table 34: Global Gnss Boards Volume K Forecast, by Type 2020 & 2033
- Table 35: Global Gnss Boards Revenue million Forecast, by Country 2020 & 2033
- Table 36: Global Gnss Boards Volume K Forecast, by Country 2020 & 2033
- Table 37: United Kingdom Gnss Boards Revenue (million) Forecast, by Application 2020 & 2033
- Table 38: United Kingdom Gnss Boards Volume (K) Forecast, by Application 2020 & 2033
- Table 39: Germany Gnss Boards Revenue (million) Forecast, by Application 2020 & 2033
- Table 40: Germany Gnss Boards Volume (K) Forecast, by Application 2020 & 2033
- Table 41: France Gnss Boards Revenue (million) Forecast, by Application 2020 & 2033
- Table 42: France Gnss Boards Volume (K) Forecast, by Application 2020 & 2033
- Table 43: Italy Gnss Boards Revenue (million) Forecast, by Application 2020 & 2033
- Table 44: Italy Gnss Boards Volume (K) Forecast, by Application 2020 & 2033
- Table 45: Spain Gnss Boards Revenue (million) Forecast, by Application 2020 & 2033
- Table 46: Spain Gnss Boards Volume (K) Forecast, by Application 2020 & 2033
- Table 47: Russia Gnss Boards Revenue (million) Forecast, by Application 2020 & 2033
- Table 48: Russia Gnss Boards Volume (K) Forecast, by Application 2020 & 2033
- Table 49: Benelux Gnss Boards Revenue (million) Forecast, by Application 2020 & 2033
- Table 50: Benelux Gnss Boards Volume (K) Forecast, by Application 2020 & 2033
- Table 51: Nordics Gnss Boards Revenue (million) Forecast, by Application 2020 & 2033
- Table 52: Nordics Gnss Boards Volume (K) Forecast, by Application 2020 & 2033
- Table 53: Rest of Europe Gnss Boards Revenue (million) Forecast, by Application 2020 & 2033
- Table 54: Rest of Europe Gnss Boards Volume (K) Forecast, by Application 2020 & 2033
- Table 55: Global Gnss Boards Revenue million Forecast, by Application 2020 & 2033
- Table 56: Global Gnss Boards Volume K Forecast, by Application 2020 & 2033
- Table 57: Global Gnss Boards Revenue million Forecast, by Type 2020 & 2033
- Table 58: Global Gnss Boards Volume K Forecast, by Type 2020 & 2033
- Table 59: Global Gnss Boards Revenue million Forecast, by Country 2020 & 2033
- Table 60: Global Gnss Boards Volume K Forecast, by Country 2020 & 2033
- Table 61: Turkey Gnss Boards Revenue (million) Forecast, by Application 2020 & 2033
- Table 62: Turkey Gnss Boards Volume (K) Forecast, by Application 2020 & 2033
- Table 63: Israel Gnss Boards Revenue (million) Forecast, by Application 2020 & 2033
- Table 64: Israel Gnss Boards Volume (K) Forecast, by Application 2020 & 2033
- Table 65: GCC Gnss Boards Revenue (million) Forecast, by Application 2020 & 2033
- Table 66: GCC Gnss Boards Volume (K) Forecast, by Application 2020 & 2033
- Table 67: North Africa Gnss Boards Revenue (million) Forecast, by Application 2020 & 2033
- Table 68: North Africa Gnss Boards Volume (K) Forecast, by Application 2020 & 2033
- Table 69: South Africa Gnss Boards Revenue (million) Forecast, by Application 2020 & 2033
- Table 70: South Africa Gnss Boards Volume (K) Forecast, by Application 2020 & 2033
- Table 71: Rest of Middle East & Africa Gnss Boards Revenue (million) Forecast, by Application 2020 & 2033
- Table 72: Rest of Middle East & Africa Gnss Boards Volume (K) Forecast, by Application 2020 & 2033
- Table 73: Global Gnss Boards Revenue million Forecast, by Application 2020 & 2033
- Table 74: Global Gnss Boards Volume K Forecast, by Application 2020 & 2033
- Table 75: Global Gnss Boards Revenue million Forecast, by Type 2020 & 2033
- Table 76: Global Gnss Boards Volume K Forecast, by Type 2020 & 2033
- Table 77: Global Gnss Boards Revenue million Forecast, by Country 2020 & 2033
- Table 78: Global Gnss Boards Volume K Forecast, by Country 2020 & 2033
- Table 79: China Gnss Boards Revenue (million) Forecast, by Application 2020 & 2033
- Table 80: China Gnss Boards Volume (K) Forecast, by Application 2020 & 2033
- Table 81: India Gnss Boards Revenue (million) Forecast, by Application 2020 & 2033
- Table 82: India Gnss Boards Volume (K) Forecast, by Application 2020 & 2033
- Table 83: Japan Gnss Boards Revenue (million) Forecast, by Application 2020 & 2033
- Table 84: Japan Gnss Boards Volume (K) Forecast, by Application 2020 & 2033
- Table 85: South Korea Gnss Boards Revenue (million) Forecast, by Application 2020 & 2033
- Table 86: South Korea Gnss Boards Volume (K) Forecast, by Application 2020 & 2033
- Table 87: ASEAN Gnss Boards Revenue (million) Forecast, by Application 2020 & 2033
- Table 88: ASEAN Gnss Boards Volume (K) Forecast, by Application 2020 & 2033
- Table 89: Oceania Gnss Boards Revenue (million) Forecast, by Application 2020 & 2033
- Table 90: Oceania Gnss Boards Volume (K) Forecast, by Application 2020 & 2033
- Table 91: Rest of Asia Pacific Gnss Boards Revenue (million) Forecast, by Application 2020 & 2033
- Table 92: Rest of Asia Pacific Gnss Boards Volume (K) Forecast, by Application 2020 & 2033
Frequently Asked Questions
1. What is the projected Compound Annual Growth Rate (CAGR) of the Gnss Boards?
The projected CAGR is approximately XXX%.
2. Which companies are prominent players in the Gnss Boards?
Key companies in the market include Trimble, NovAtel, Bynav, Hemisphere GNSS, Septentrio, Topcon, Saphyrion, ComNav Technology Ltd, u-blox, Swift Navigation, Inc, Unicore Communications, Inc.
3. What are the main segments of the Gnss Boards?
The market segments include Application, Type.
4. Can you provide details about the market size?
The market size is estimated to be USD XXX million as of 2022.
5. What are some drivers contributing to market growth?
N/A
6. What are the notable trends driving market growth?
N/A
7. Are there any restraints impacting market growth?
N/A
8. Can you provide examples of recent developments in the market?
N/A
9. What pricing options are available for accessing the report?
Pricing options include single-user, multi-user, and enterprise licenses priced at USD 3950.00, USD 5925.00, and USD 7900.00 respectively.
10. Is the market size provided in terms of value or volume?
The market size is provided in terms of value, measured in million and volume, measured in K.
11. Are there any specific market keywords associated with the report?
Yes, the market keyword associated with the report is "Gnss Boards," which aids in identifying and referencing the specific market segment covered.
12. How do I determine which pricing option suits my needs best?
The pricing options vary based on user requirements and access needs. Individual users may opt for single-user licenses, while businesses requiring broader access may choose multi-user or enterprise licenses for cost-effective access to the report.
13. Are there any additional resources or data provided in the Gnss Boards report?
While the report offers comprehensive insights, it's advisable to review the specific contents or supplementary materials provided to ascertain if additional resources or data are available.
14. How can I stay updated on further developments or reports in the Gnss Boards?
To stay informed about further developments, trends, and reports in the Gnss Boards, consider subscribing to industry newsletters, following relevant companies and organizations, or regularly checking reputable industry news sources and publications.
Methodology
Step 1 - Identification of Relevant Samples Size from Population Database


Step 2 - Approaches for Defining Global Market Size (Value, Volume* & Price*)

Note*: In applicable scenarios
Step 3 - Data Sources
Primary Research
- Web Analytics
- Survey Reports
- Research Institute
- Latest Research Reports
- Opinion Leaders
Secondary Research
- Annual Reports
- White Paper
- Latest Press Release
- Industry Association
- Paid Database
- Investor Presentations

Step 4 - Data Triangulation
Involves using different sources of information in order to increase the validity of a study
These sources are likely to be stakeholders in a program - participants, other researchers, program staff, other community members, and so on.
Then we put all data in single framework & apply various statistical tools to find out the dynamic on the market.
During the analysis stage, feedback from the stakeholder groups would be compared to determine areas of agreement as well as areas of divergence