

Key Insights
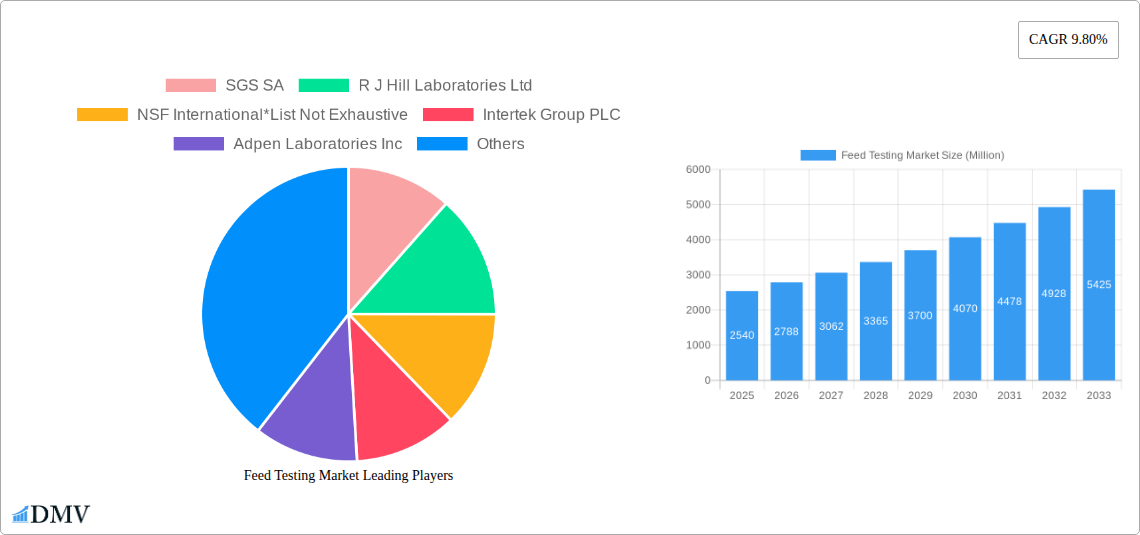
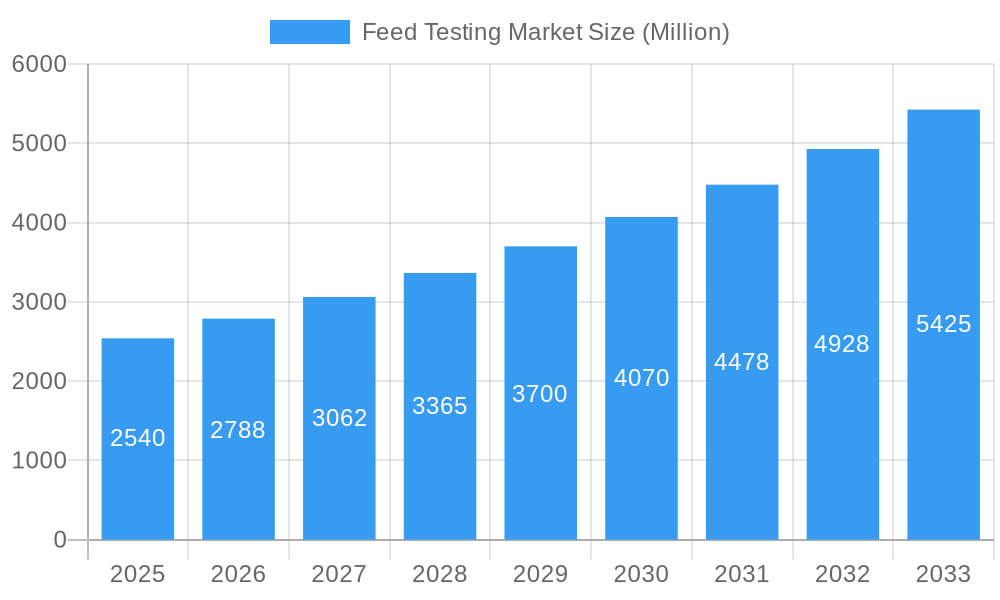
The global feed testing market, valued at $2.54 billion in 2025, is projected to experience robust growth, driven by increasing consumer demand for safe and high-quality animal products. This demand necessitates stringent quality control measures throughout the feed production and supply chain, fueling the adoption of comprehensive testing services. Key drivers include heightened regulatory scrutiny regarding food safety and animal health, coupled with rising awareness of mycotoxin contamination and the need for accurate nutritional labeling. The market is segmented by type of testing (pathogen testing, pesticide residue analysis, nutritional labeling analysis, fats and oils analysis, mycotoxin testing, and others) and feed type (ruminant, poultry, swine, aquaculture, and pet food). The prevalence of zoonotic diseases further underscores the importance of robust feed testing, particularly pathogen detection. Rapid advancements in analytical technologies, such as PCR and ELISA, are enhancing testing efficiency and accuracy, driving market expansion. Geographic growth is expected across all regions, with North America and Europe currently holding significant market shares, while Asia-Pacific is poised for considerable expansion due to its rapidly growing livestock industry.
Feed Testing Market Market Size (In Billion)
The market's compound annual growth rate (CAGR) of 9.80% from 2025 to 2033 indicates substantial future growth. This growth is influenced by several factors, including the increasing integration of advanced technologies in feed testing, the development of faster and more accurate analytical methods, and the growing adoption of sophisticated quality management systems within the feed industry. However, high testing costs and the need for specialized expertise can act as restraints. The competitive landscape features both large multinational companies and specialized laboratories offering a broad range of testing services, often tailored to specific feed types and customer needs. Future market success hinges on innovation, the development of cost-effective solutions, and a focus on providing rapid and reliable results to meet the evolving demands of a growing and increasingly regulated feed industry.
Feed Testing Market Company Market Share
Feed Testing Market: A Comprehensive Report (2019-2033)
This insightful report provides a detailed analysis of the Feed Testing Market, offering a comprehensive overview of market trends, growth drivers, challenges, and future opportunities. Covering the period from 2019 to 2033, with a base year of 2025 and a forecast period of 2025-2033, this report is an essential resource for stakeholders seeking to understand and navigate this dynamic market. The total market value in 2025 is estimated at $XX Million, projected to reach $XX Million by 2033.
Feed Testing Market Composition & Trends
This section delves into the intricate structure of the feed testing market, examining market concentration, innovative advancements, regulatory frameworks, substitute products, end-user profiles, and mergers & acquisitions (M&A) activities. The market exhibits a moderately concentrated landscape, with key players such as SGS SA, Eurofins Scientific, and Intertek Group PLC holding significant market share. However, several smaller, specialized firms are also making notable contributions. The market share distribution in 2025 is estimated as follows: SGS SA (XX%), Eurofins Scientific (XX%), Intertek Group PLC (XX%), Others (XX%). Innovation is driven by advancements in technologies like PCR, ELISA, and LC-MS/MS, enabling more rapid, accurate, and cost-effective testing. Stringent regulatory frameworks, including those set by the FDA and various regional bodies, are a major influencing factor shaping market growth. Substitute testing methods are limited, primarily due to the stringent accuracy and reliability demands of feed testing. End-users are primarily feed manufacturers, regulatory bodies, and agricultural organizations. M&A activities have been moderate, with deal values totaling approximately $XX Million in the past five years. Notable transactions included [Insert details of any significant M&A activity if available, otherwise use "No significant M&A activity reported"].
- Market Concentration: Moderately concentrated, with top players holding a significant, but not dominant, share.
- Innovation Catalysts: Advancements in PCR, ELISA, LC-MS/MS technologies.
- Regulatory Landscape: Stringent regulations by FDA and other regional bodies.
- Substitute Products: Limited viable substitutes due to accuracy requirements.
- End-User Profiles: Feed manufacturers, regulatory bodies, and agricultural organizations.
- M&A Activity: Moderate activity with approximately $XX Million in deal values over the past five years.
Feed Testing Market Industry Evolution
The feed testing market has witnessed substantial growth over the historical period (2019-2024), driven by escalating consumer demand for safe and high-quality animal feed, coupled with increasingly stringent regulatory requirements. The market experienced a Compound Annual Growth Rate (CAGR) of XX% during this period. Technological advancements, particularly in high-throughput screening and advanced analytical techniques, have significantly improved testing efficiency and accuracy. This has led to a notable increase in the adoption of sophisticated testing methods, with a XX% increase in the use of LC-MS/MS technology from 2019 to 2024. Consumer preference for sustainably sourced and ethically produced animal products is also fueling the demand for comprehensive feed testing to ensure product integrity and safety. The market is expected to maintain a steady growth trajectory in the forecast period (2025-2033), driven by continued technological innovation and regulatory compliance needs. The forecast CAGR for 2025-2033 is estimated at XX%.
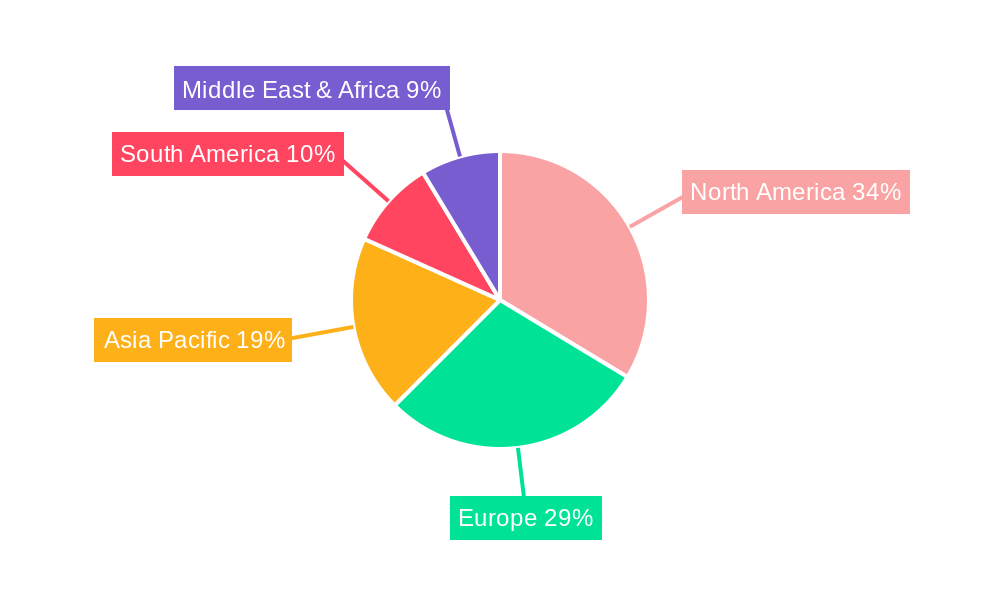
Leading Regions, Countries, or Segments in Feed Testing Market
The North American feed testing market holds the leading position, driven primarily by stringent regulatory standards and high consumer awareness regarding food safety. Europe follows closely, with a strong emphasis on ensuring feed quality and safety within the EU. Within the segmentation analysis:
By Type: Pathogen testing currently holds the largest market share, reflecting concerns about foodborne illnesses. Pesticide residue analysis is also a significant segment due to rising consumer demand for pesticide-free products.
By Feed Type: Ruminant feed testing accounts for the largest segment owing to the substantial scale of ruminant livestock farming. The poultry feed segment is also experiencing substantial growth driven by increasing poultry consumption worldwide.
- Key Drivers (North America): Stringent regulations, high consumer awareness of food safety.
- Key Drivers (Europe): Stringent EU regulations, strong focus on food quality and safety.
- Key Drivers (Pathogen Testing): Concerns regarding foodborne illnesses, stringent regulatory requirements.
- Key Drivers (Ruminant Feed): Large scale of ruminant livestock farming.
Feed Testing Market Product Innovations
Recent innovations in feed testing include the development of rapid diagnostic tests, miniaturized devices for on-site testing, and advanced software for data analysis and reporting. These advancements offer improved speed, portability, and data management capabilities, streamlining the testing process and enhancing efficiency. Unique selling propositions (USPs) for new products emphasize improved accuracy, reduced testing time, and cost-effectiveness. Specific examples include [mention specific product examples if known, otherwise, describe general innovations like automated systems or novel detection methods].
Propelling Factors for Feed Testing Market Growth
Several factors drive the growth of the feed testing market. Technological advancements in analytical techniques, such as next-generation sequencing (NGS), and improved automation significantly enhance testing accuracy and efficiency. Economic factors, including increasing consumer spending on animal-derived food products, contribute to heightened demand for safe and high-quality feed. Finally, stringent regulations and stricter enforcement by regulatory bodies globally further propel the market.
Obstacles in the Feed Testing Market
The feed testing market faces challenges including high testing costs, particularly for advanced methods like LC-MS/MS, and potential supply chain disruptions affecting reagent availability. Furthermore, the complex regulatory landscape and varying standards across different regions can complicate compliance efforts for testing providers. Competitive pressures among testing laboratories also influence pricing and service offerings.
Future Opportunities in Feed Testing Market
The feed testing market presents significant future opportunities in emerging economies with growing livestock production. The development and adoption of point-of-care testing devices, enabling rapid on-site analysis, offer considerable growth potential. Furthermore, incorporating advanced data analytics and artificial intelligence into testing procedures can significantly enhance efficiency and predictive capabilities, identifying potential issues before they become major problems.
Major Players in the Feed Testing Market Ecosystem
- SGS SA
- R J Hill Laboratories Ltd
- NSF International
- Intertek Group PLC
- Adpen Laboratories Inc
- Bruker Biosciences Corporation
- Genetic ID NA Inc
- Genon Laboratories Ltd
- Eurofins Scientific
- Invisible Sentinel Inc
Key Developments in Feed Testing Market Industry
- 2022 Q4: Eurofins Scientific acquired a smaller testing laboratory, expanding its capabilities.
- 2023 Q1: SGS SA launched a new rapid pathogen detection system.
- 2023 Q3: New regulations on mycotoxin testing were implemented in the EU. (Add more if available; otherwise, replace with other relevant information)
Strategic Feed Testing Market Forecast
The feed testing market is poised for continued growth, driven by technological innovations, rising consumer demand, and stricter regulations. Future opportunities lie in expanding into emerging markets, developing rapid and cost-effective testing methods, and leveraging data analytics for improved decision-making across the feed value chain. The market is expected to maintain a strong growth trajectory throughout the forecast period.
Feed Testing Market Segmentation
- 1. Production Analysis
- 2. Consumption Analysis
- 3. Import Market Analysis (Value & Volume)
- 4. Export Market Analysis (Value & Volume)
- 5. Price Trend Analysis
Feed Testing Market Segmentation By Geography
-
1. North America
- 1.1. United States
- 1.2. Canada
- 1.3. Mexico
-
2. South America
- 2.1. Brazil
- 2.2. Argentina
- 2.3. Rest of South America
-
3. Europe
- 3.1. United Kingdom
- 3.2. Germany
- 3.3. France
- 3.4. Italy
- 3.5. Spain
- 3.6. Russia
- 3.7. Benelux
- 3.8. Nordics
- 3.9. Rest of Europe
-
4. Middle East & Africa
- 4.1. Turkey
- 4.2. Israel
- 4.3. GCC
- 4.4. North Africa
- 4.5. South Africa
- 4.6. Rest of Middle East & Africa
-
5. Asia Pacific
- 5.1. China
- 5.2. India
- 5.3. Japan
- 5.4. South Korea
- 5.5. ASEAN
- 5.6. Oceania
- 5.7. Rest of Asia Pacific
Feed Testing Market Regional Market Share
Geographic Coverage of Feed Testing Market
Feed Testing Market REPORT HIGHLIGHTS
| Aspects | Details |
|---|---|
| Study Period | 2020-2034 |
| Base Year | 2025 |
| Estimated Year | 2026 |
| Forecast Period | 2026-2034 |
| Historical Period | 2020-2025 |
| Growth Rate | CAGR of 9.80% from 2020-2034 |
| Segmentation |
|
Table of Contents
- 1. Introduction
- 1.1. Research Scope
- 1.2. Market Segmentation
- 1.3. Research Objective
- 1.4. Definitions and Assumptions
- 2. Executive Summary
- 2.1. Market Snapshot
- 3. Market Dynamics
- 3.1. Market Drivers
- 3.2. Market Restrains
- 3.3. Market Trends
- 3.4. Market Opportunities
- 4. Market Factor Analysis
- 4.1. Porters Five Forces
- 4.1.1. Bargaining Power of Suppliers
- 4.1.2. Bargaining Power of Buyers
- 4.1.3. Threat of New Entrants
- 4.1.4. Threat of Substitutes
- 4.1.5. Competitive Rivalry
- 4.2. PESTEL analysis
- 4.3. BCG Analysis
- 4.3.1. Stars (High Growth, High Market Share)
- 4.3.2. Cash Cows (Low Growth, High Market Share)
- 4.3.3. Question Mark (High Growth, Low Market Share)
- 4.3.4. Dogs (Low Growth, Low Market Share)
- 4.4. Ansoff Matrix Analysis
- 4.5. Supply Chain Analysis
- 4.6. Regulatory Landscape
- 4.7. Current Market Potential and Opportunity Assessment (TAM–SAM–SOM Framework)
- 4.8. DMV Analyst Note
- 4.1. Porters Five Forces
- 5. Market Analysis, Insights and Forecast 2021-2033
- 5.1. Market Analysis, Insights and Forecast - by Production Analysis
- 5.2. Market Analysis, Insights and Forecast - by Consumption Analysis
- 5.3. Market Analysis, Insights and Forecast - by Import Market Analysis (Value & Volume)
- 5.4. Market Analysis, Insights and Forecast - by Export Market Analysis (Value & Volume)
- 5.5. Market Analysis, Insights and Forecast - by Price Trend Analysis
- 5.6. Market Analysis, Insights and Forecast - by Region
- 5.6.1. North America
- 5.6.2. South America
- 5.6.3. Europe
- 5.6.4. Middle East & Africa
- 5.6.5. Asia Pacific
- 6. Global Feed Testing Market Analysis, Insights and Forecast, 2021-2033
- 6.1. Market Analysis, Insights and Forecast - by Production Analysis
- 6.2. Market Analysis, Insights and Forecast - by Consumption Analysis
- 6.3. Market Analysis, Insights and Forecast - by Import Market Analysis (Value & Volume)
- 6.4. Market Analysis, Insights and Forecast - by Export Market Analysis (Value & Volume)
- 6.5. Market Analysis, Insights and Forecast - by Price Trend Analysis
- 7. North America Feed Testing Market Analysis, Insights and Forecast, 2020-2032
- 7.1. Market Analysis, Insights and Forecast - by Production Analysis
- 7.2. Market Analysis, Insights and Forecast - by Consumption Analysis
- 7.3. Market Analysis, Insights and Forecast - by Import Market Analysis (Value & Volume)
- 7.4. Market Analysis, Insights and Forecast - by Export Market Analysis (Value & Volume)
- 7.5. Market Analysis, Insights and Forecast - by Price Trend Analysis
- 8. South America Feed Testing Market Analysis, Insights and Forecast, 2020-2032
- 8.1. Market Analysis, Insights and Forecast - by Production Analysis
- 8.2. Market Analysis, Insights and Forecast - by Consumption Analysis
- 8.3. Market Analysis, Insights and Forecast - by Import Market Analysis (Value & Volume)
- 8.4. Market Analysis, Insights and Forecast - by Export Market Analysis (Value & Volume)
- 8.5. Market Analysis, Insights and Forecast - by Price Trend Analysis
- 9. Europe Feed Testing Market Analysis, Insights and Forecast, 2020-2032
- 9.1. Market Analysis, Insights and Forecast - by Production Analysis
- 9.2. Market Analysis, Insights and Forecast - by Consumption Analysis
- 9.3. Market Analysis, Insights and Forecast - by Import Market Analysis (Value & Volume)
- 9.4. Market Analysis, Insights and Forecast - by Export Market Analysis (Value & Volume)
- 9.5. Market Analysis, Insights and Forecast - by Price Trend Analysis
- 10. Middle East & Africa Feed Testing Market Analysis, Insights and Forecast, 2020-2032
- 10.1. Market Analysis, Insights and Forecast - by Production Analysis
- 10.2. Market Analysis, Insights and Forecast - by Consumption Analysis
- 10.3. Market Analysis, Insights and Forecast - by Import Market Analysis (Value & Volume)
- 10.4. Market Analysis, Insights and Forecast - by Export Market Analysis (Value & Volume)
- 10.5. Market Analysis, Insights and Forecast - by Price Trend Analysis
- 11. Asia Pacific Feed Testing Market Analysis, Insights and Forecast, 2020-2032
- 11.1. Market Analysis, Insights and Forecast - by Production Analysis
- 11.2. Market Analysis, Insights and Forecast - by Consumption Analysis
- 11.3. Market Analysis, Insights and Forecast - by Import Market Analysis (Value & Volume)
- 11.4. Market Analysis, Insights and Forecast - by Export Market Analysis (Value & Volume)
- 11.5. Market Analysis, Insights and Forecast - by Price Trend Analysis
- 12. Competitive Analysis
- 12.1. Company Profiles
- 12.1.1 SGS SA
- 12.1.1.1. Company Overview
- 12.1.1.2. Products
- 12.1.1.3. Company Financials
- 12.1.1.4. SWOT Analysis
- 12.1.2 R J Hill Laboratories Ltd
- 12.1.2.1. Company Overview
- 12.1.2.2. Products
- 12.1.2.3. Company Financials
- 12.1.2.4. SWOT Analysis
- 12.1.3 NSF International*List Not Exhaustive
- 12.1.3.1. Company Overview
- 12.1.3.2. Products
- 12.1.3.3. Company Financials
- 12.1.3.4. SWOT Analysis
- 12.1.4 Intertek Group PLC
- 12.1.4.1. Company Overview
- 12.1.4.2. Products
- 12.1.4.3. Company Financials
- 12.1.4.4. SWOT Analysis
- 12.1.5 Adpen Laboratories Inc
- 12.1.5.1. Company Overview
- 12.1.5.2. Products
- 12.1.5.3. Company Financials
- 12.1.5.4. SWOT Analysis
- 12.1.6 Bruker Biosciences Corporation
- 12.1.6.1. Company Overview
- 12.1.6.2. Products
- 12.1.6.3. Company Financials
- 12.1.6.4. SWOT Analysis
- 12.1.7 Genetic ID NA Inc
- 12.1.7.1. Company Overview
- 12.1.7.2. Products
- 12.1.7.3. Company Financials
- 12.1.7.4. SWOT Analysis
- 12.1.8 Genon Laboratories Ltd
- 12.1.8.1. Company Overview
- 12.1.8.2. Products
- 12.1.8.3. Company Financials
- 12.1.8.4. SWOT Analysis
- 12.1.9 Eurofins Scientific
- 12.1.9.1. Company Overview
- 12.1.9.2. Products
- 12.1.9.3. Company Financials
- 12.1.9.4. SWOT Analysis
- 12.1.10 Invisible Sentinel Inc
- 12.1.10.1. Company Overview
- 12.1.10.2. Products
- 12.1.10.3. Company Financials
- 12.1.10.4. SWOT Analysis
- 12.1.1 SGS SA
- 12.2. Market Entropy
- 12.2.1 Company's Key Areas Served
- 12.2.2 Recent Developments
- 12.3. Company Market Share Analysis 2025
- 12.3.1 Top 5 Companies Market Share Analysis
- 12.3.2 Top 3 Companies Market Share Analysis
- 12.4. List of Potential Customers
- 13. Research Methodology
List of Figures
- Figure 1: Global Feed Testing Market Revenue Breakdown (Million, %) by Region 2025 & 2033
- Figure 2: Global Feed Testing Market Volume Breakdown (Kiloton, %) by Region 2025 & 2033
- Figure 3: North America Feed Testing Market Revenue (Million), by Production Analysis 2025 & 2033
- Figure 4: North America Feed Testing Market Volume (Kiloton), by Production Analysis 2025 & 2033
- Figure 5: North America Feed Testing Market Revenue Share (%), by Production Analysis 2025 & 2033
- Figure 6: North America Feed Testing Market Volume Share (%), by Production Analysis 2025 & 2033
- Figure 7: North America Feed Testing Market Revenue (Million), by Consumption Analysis 2025 & 2033
- Figure 8: North America Feed Testing Market Volume (Kiloton), by Consumption Analysis 2025 & 2033
- Figure 9: North America Feed Testing Market Revenue Share (%), by Consumption Analysis 2025 & 2033
- Figure 10: North America Feed Testing Market Volume Share (%), by Consumption Analysis 2025 & 2033
- Figure 11: North America Feed Testing Market Revenue (Million), by Import Market Analysis (Value & Volume) 2025 & 2033
- Figure 12: North America Feed Testing Market Volume (Kiloton), by Import Market Analysis (Value & Volume) 2025 & 2033
- Figure 13: North America Feed Testing Market Revenue Share (%), by Import Market Analysis (Value & Volume) 2025 & 2033
- Figure 14: North America Feed Testing Market Volume Share (%), by Import Market Analysis (Value & Volume) 2025 & 2033
- Figure 15: North America Feed Testing Market Revenue (Million), by Export Market Analysis (Value & Volume) 2025 & 2033
- Figure 16: North America Feed Testing Market Volume (Kiloton), by Export Market Analysis (Value & Volume) 2025 & 2033
- Figure 17: North America Feed Testing Market Revenue Share (%), by Export Market Analysis (Value & Volume) 2025 & 2033
- Figure 18: North America Feed Testing Market Volume Share (%), by Export Market Analysis (Value & Volume) 2025 & 2033
- Figure 19: North America Feed Testing Market Revenue (Million), by Price Trend Analysis 2025 & 2033
- Figure 20: North America Feed Testing Market Volume (Kiloton), by Price Trend Analysis 2025 & 2033
- Figure 21: North America Feed Testing Market Revenue Share (%), by Price Trend Analysis 2025 & 2033
- Figure 22: North America Feed Testing Market Volume Share (%), by Price Trend Analysis 2025 & 2033
- Figure 23: North America Feed Testing Market Revenue (Million), by Country 2025 & 2033
- Figure 24: North America Feed Testing Market Volume (Kiloton), by Country 2025 & 2033
- Figure 25: North America Feed Testing Market Revenue Share (%), by Country 2025 & 2033
- Figure 26: North America Feed Testing Market Volume Share (%), by Country 2025 & 2033
- Figure 27: South America Feed Testing Market Revenue (Million), by Production Analysis 2025 & 2033
- Figure 28: South America Feed Testing Market Volume (Kiloton), by Production Analysis 2025 & 2033
- Figure 29: South America Feed Testing Market Revenue Share (%), by Production Analysis 2025 & 2033
- Figure 30: South America Feed Testing Market Volume Share (%), by Production Analysis 2025 & 2033
- Figure 31: South America Feed Testing Market Revenue (Million), by Consumption Analysis 2025 & 2033
- Figure 32: South America Feed Testing Market Volume (Kiloton), by Consumption Analysis 2025 & 2033
- Figure 33: South America Feed Testing Market Revenue Share (%), by Consumption Analysis 2025 & 2033
- Figure 34: South America Feed Testing Market Volume Share (%), by Consumption Analysis 2025 & 2033
- Figure 35: South America Feed Testing Market Revenue (Million), by Import Market Analysis (Value & Volume) 2025 & 2033
- Figure 36: South America Feed Testing Market Volume (Kiloton), by Import Market Analysis (Value & Volume) 2025 & 2033
- Figure 37: South America Feed Testing Market Revenue Share (%), by Import Market Analysis (Value & Volume) 2025 & 2033
- Figure 38: South America Feed Testing Market Volume Share (%), by Import Market Analysis (Value & Volume) 2025 & 2033
- Figure 39: South America Feed Testing Market Revenue (Million), by Export Market Analysis (Value & Volume) 2025 & 2033
- Figure 40: South America Feed Testing Market Volume (Kiloton), by Export Market Analysis (Value & Volume) 2025 & 2033
- Figure 41: South America Feed Testing Market Revenue Share (%), by Export Market Analysis (Value & Volume) 2025 & 2033
- Figure 42: South America Feed Testing Market Volume Share (%), by Export Market Analysis (Value & Volume) 2025 & 2033
- Figure 43: South America Feed Testing Market Revenue (Million), by Price Trend Analysis 2025 & 2033
- Figure 44: South America Feed Testing Market Volume (Kiloton), by Price Trend Analysis 2025 & 2033
- Figure 45: South America Feed Testing Market Revenue Share (%), by Price Trend Analysis 2025 & 2033
- Figure 46: South America Feed Testing Market Volume Share (%), by Price Trend Analysis 2025 & 2033
- Figure 47: South America Feed Testing Market Revenue (Million), by Country 2025 & 2033
- Figure 48: South America Feed Testing Market Volume (Kiloton), by Country 2025 & 2033
- Figure 49: South America Feed Testing Market Revenue Share (%), by Country 2025 & 2033
- Figure 50: South America Feed Testing Market Volume Share (%), by Country 2025 & 2033
- Figure 51: Europe Feed Testing Market Revenue (Million), by Production Analysis 2025 & 2033
- Figure 52: Europe Feed Testing Market Volume (Kiloton), by Production Analysis 2025 & 2033
- Figure 53: Europe Feed Testing Market Revenue Share (%), by Production Analysis 2025 & 2033
- Figure 54: Europe Feed Testing Market Volume Share (%), by Production Analysis 2025 & 2033
- Figure 55: Europe Feed Testing Market Revenue (Million), by Consumption Analysis 2025 & 2033
- Figure 56: Europe Feed Testing Market Volume (Kiloton), by Consumption Analysis 2025 & 2033
- Figure 57: Europe Feed Testing Market Revenue Share (%), by Consumption Analysis 2025 & 2033
- Figure 58: Europe Feed Testing Market Volume Share (%), by Consumption Analysis 2025 & 2033
- Figure 59: Europe Feed Testing Market Revenue (Million), by Import Market Analysis (Value & Volume) 2025 & 2033
- Figure 60: Europe Feed Testing Market Volume (Kiloton), by Import Market Analysis (Value & Volume) 2025 & 2033
- Figure 61: Europe Feed Testing Market Revenue Share (%), by Import Market Analysis (Value & Volume) 2025 & 2033
- Figure 62: Europe Feed Testing Market Volume Share (%), by Import Market Analysis (Value & Volume) 2025 & 2033
- Figure 63: Europe Feed Testing Market Revenue (Million), by Export Market Analysis (Value & Volume) 2025 & 2033
- Figure 64: Europe Feed Testing Market Volume (Kiloton), by Export Market Analysis (Value & Volume) 2025 & 2033
- Figure 65: Europe Feed Testing Market Revenue Share (%), by Export Market Analysis (Value & Volume) 2025 & 2033
- Figure 66: Europe Feed Testing Market Volume Share (%), by Export Market Analysis (Value & Volume) 2025 & 2033
- Figure 67: Europe Feed Testing Market Revenue (Million), by Price Trend Analysis 2025 & 2033
- Figure 68: Europe Feed Testing Market Volume (Kiloton), by Price Trend Analysis 2025 & 2033
- Figure 69: Europe Feed Testing Market Revenue Share (%), by Price Trend Analysis 2025 & 2033
- Figure 70: Europe Feed Testing Market Volume Share (%), by Price Trend Analysis 2025 & 2033
- Figure 71: Europe Feed Testing Market Revenue (Million), by Country 2025 & 2033
- Figure 72: Europe Feed Testing Market Volume (Kiloton), by Country 2025 & 2033
- Figure 73: Europe Feed Testing Market Revenue Share (%), by Country 2025 & 2033
- Figure 74: Europe Feed Testing Market Volume Share (%), by Country 2025 & 2033
- Figure 75: Middle East & Africa Feed Testing Market Revenue (Million), by Production Analysis 2025 & 2033
- Figure 76: Middle East & Africa Feed Testing Market Volume (Kiloton), by Production Analysis 2025 & 2033
- Figure 77: Middle East & Africa Feed Testing Market Revenue Share (%), by Production Analysis 2025 & 2033
- Figure 78: Middle East & Africa Feed Testing Market Volume Share (%), by Production Analysis 2025 & 2033
- Figure 79: Middle East & Africa Feed Testing Market Revenue (Million), by Consumption Analysis 2025 & 2033
- Figure 80: Middle East & Africa Feed Testing Market Volume (Kiloton), by Consumption Analysis 2025 & 2033
- Figure 81: Middle East & Africa Feed Testing Market Revenue Share (%), by Consumption Analysis 2025 & 2033
- Figure 82: Middle East & Africa Feed Testing Market Volume Share (%), by Consumption Analysis 2025 & 2033
- Figure 83: Middle East & Africa Feed Testing Market Revenue (Million), by Import Market Analysis (Value & Volume) 2025 & 2033
- Figure 84: Middle East & Africa Feed Testing Market Volume (Kiloton), by Import Market Analysis (Value & Volume) 2025 & 2033
- Figure 85: Middle East & Africa Feed Testing Market Revenue Share (%), by Import Market Analysis (Value & Volume) 2025 & 2033
- Figure 86: Middle East & Africa Feed Testing Market Volume Share (%), by Import Market Analysis (Value & Volume) 2025 & 2033
- Figure 87: Middle East & Africa Feed Testing Market Revenue (Million), by Export Market Analysis (Value & Volume) 2025 & 2033
- Figure 88: Middle East & Africa Feed Testing Market Volume (Kiloton), by Export Market Analysis (Value & Volume) 2025 & 2033
- Figure 89: Middle East & Africa Feed Testing Market Revenue Share (%), by Export Market Analysis (Value & Volume) 2025 & 2033
- Figure 90: Middle East & Africa Feed Testing Market Volume Share (%), by Export Market Analysis (Value & Volume) 2025 & 2033
- Figure 91: Middle East & Africa Feed Testing Market Revenue (Million), by Price Trend Analysis 2025 & 2033
- Figure 92: Middle East & Africa Feed Testing Market Volume (Kiloton), by Price Trend Analysis 2025 & 2033
- Figure 93: Middle East & Africa Feed Testing Market Revenue Share (%), by Price Trend Analysis 2025 & 2033
- Figure 94: Middle East & Africa Feed Testing Market Volume Share (%), by Price Trend Analysis 2025 & 2033
- Figure 95: Middle East & Africa Feed Testing Market Revenue (Million), by Country 2025 & 2033
- Figure 96: Middle East & Africa Feed Testing Market Volume (Kiloton), by Country 2025 & 2033
- Figure 97: Middle East & Africa Feed Testing Market Revenue Share (%), by Country 2025 & 2033
- Figure 98: Middle East & Africa Feed Testing Market Volume Share (%), by Country 2025 & 2033
- Figure 99: Asia Pacific Feed Testing Market Revenue (Million), by Production Analysis 2025 & 2033
- Figure 100: Asia Pacific Feed Testing Market Volume (Kiloton), by Production Analysis 2025 & 2033
- Figure 101: Asia Pacific Feed Testing Market Revenue Share (%), by Production Analysis 2025 & 2033
- Figure 102: Asia Pacific Feed Testing Market Volume Share (%), by Production Analysis 2025 & 2033
- Figure 103: Asia Pacific Feed Testing Market Revenue (Million), by Consumption Analysis 2025 & 2033
- Figure 104: Asia Pacific Feed Testing Market Volume (Kiloton), by Consumption Analysis 2025 & 2033
- Figure 105: Asia Pacific Feed Testing Market Revenue Share (%), by Consumption Analysis 2025 & 2033
- Figure 106: Asia Pacific Feed Testing Market Volume Share (%), by Consumption Analysis 2025 & 2033
- Figure 107: Asia Pacific Feed Testing Market Revenue (Million), by Import Market Analysis (Value & Volume) 2025 & 2033
- Figure 108: Asia Pacific Feed Testing Market Volume (Kiloton), by Import Market Analysis (Value & Volume) 2025 & 2033
- Figure 109: Asia Pacific Feed Testing Market Revenue Share (%), by Import Market Analysis (Value & Volume) 2025 & 2033
- Figure 110: Asia Pacific Feed Testing Market Volume Share (%), by Import Market Analysis (Value & Volume) 2025 & 2033
- Figure 111: Asia Pacific Feed Testing Market Revenue (Million), by Export Market Analysis (Value & Volume) 2025 & 2033
- Figure 112: Asia Pacific Feed Testing Market Volume (Kiloton), by Export Market Analysis (Value & Volume) 2025 & 2033
- Figure 113: Asia Pacific Feed Testing Market Revenue Share (%), by Export Market Analysis (Value & Volume) 2025 & 2033
- Figure 114: Asia Pacific Feed Testing Market Volume Share (%), by Export Market Analysis (Value & Volume) 2025 & 2033
- Figure 115: Asia Pacific Feed Testing Market Revenue (Million), by Price Trend Analysis 2025 & 2033
- Figure 116: Asia Pacific Feed Testing Market Volume (Kiloton), by Price Trend Analysis 2025 & 2033
- Figure 117: Asia Pacific Feed Testing Market Revenue Share (%), by Price Trend Analysis 2025 & 2033
- Figure 118: Asia Pacific Feed Testing Market Volume Share (%), by Price Trend Analysis 2025 & 2033
- Figure 119: Asia Pacific Feed Testing Market Revenue (Million), by Country 2025 & 2033
- Figure 120: Asia Pacific Feed Testing Market Volume (Kiloton), by Country 2025 & 2033
- Figure 121: Asia Pacific Feed Testing Market Revenue Share (%), by Country 2025 & 2033
- Figure 122: Asia Pacific Feed Testing Market Volume Share (%), by Country 2025 & 2033
List of Tables
- Table 1: Global Feed Testing Market Revenue Million Forecast, by Production Analysis 2020 & 2033
- Table 2: Global Feed Testing Market Volume Kiloton Forecast, by Production Analysis 2020 & 2033
- Table 3: Global Feed Testing Market Revenue Million Forecast, by Consumption Analysis 2020 & 2033
- Table 4: Global Feed Testing Market Volume Kiloton Forecast, by Consumption Analysis 2020 & 2033
- Table 5: Global Feed Testing Market Revenue Million Forecast, by Import Market Analysis (Value & Volume) 2020 & 2033
- Table 6: Global Feed Testing Market Volume Kiloton Forecast, by Import Market Analysis (Value & Volume) 2020 & 2033
- Table 7: Global Feed Testing Market Revenue Million Forecast, by Export Market Analysis (Value & Volume) 2020 & 2033
- Table 8: Global Feed Testing Market Volume Kiloton Forecast, by Export Market Analysis (Value & Volume) 2020 & 2033
- Table 9: Global Feed Testing Market Revenue Million Forecast, by Price Trend Analysis 2020 & 2033
- Table 10: Global Feed Testing Market Volume Kiloton Forecast, by Price Trend Analysis 2020 & 2033
- Table 11: Global Feed Testing Market Revenue Million Forecast, by Region 2020 & 2033
- Table 12: Global Feed Testing Market Volume Kiloton Forecast, by Region 2020 & 2033
- Table 13: Global Feed Testing Market Revenue Million Forecast, by Production Analysis 2020 & 2033
- Table 14: Global Feed Testing Market Volume Kiloton Forecast, by Production Analysis 2020 & 2033
- Table 15: Global Feed Testing Market Revenue Million Forecast, by Consumption Analysis 2020 & 2033
- Table 16: Global Feed Testing Market Volume Kiloton Forecast, by Consumption Analysis 2020 & 2033
- Table 17: Global Feed Testing Market Revenue Million Forecast, by Import Market Analysis (Value & Volume) 2020 & 2033
- Table 18: Global Feed Testing Market Volume Kiloton Forecast, by Import Market Analysis (Value & Volume) 2020 & 2033
- Table 19: Global Feed Testing Market Revenue Million Forecast, by Export Market Analysis (Value & Volume) 2020 & 2033
- Table 20: Global Feed Testing Market Volume Kiloton Forecast, by Export Market Analysis (Value & Volume) 2020 & 2033
- Table 21: Global Feed Testing Market Revenue Million Forecast, by Price Trend Analysis 2020 & 2033
- Table 22: Global Feed Testing Market Volume Kiloton Forecast, by Price Trend Analysis 2020 & 2033
- Table 23: Global Feed Testing Market Revenue Million Forecast, by Country 2020 & 2033
- Table 24: Global Feed Testing Market Volume Kiloton Forecast, by Country 2020 & 2033
- Table 25: United States Feed Testing Market Revenue (Million) Forecast, by Application 2020 & 2033
- Table 26: United States Feed Testing Market Volume (Kiloton) Forecast, by Application 2020 & 2033
- Table 27: Canada Feed Testing Market Revenue (Million) Forecast, by Application 2020 & 2033
- Table 28: Canada Feed Testing Market Volume (Kiloton) Forecast, by Application 2020 & 2033
- Table 29: Mexico Feed Testing Market Revenue (Million) Forecast, by Application 2020 & 2033
- Table 30: Mexico Feed Testing Market Volume (Kiloton) Forecast, by Application 2020 & 2033
- Table 31: Global Feed Testing Market Revenue Million Forecast, by Production Analysis 2020 & 2033
- Table 32: Global Feed Testing Market Volume Kiloton Forecast, by Production Analysis 2020 & 2033
- Table 33: Global Feed Testing Market Revenue Million Forecast, by Consumption Analysis 2020 & 2033
- Table 34: Global Feed Testing Market Volume Kiloton Forecast, by Consumption Analysis 2020 & 2033
- Table 35: Global Feed Testing Market Revenue Million Forecast, by Import Market Analysis (Value & Volume) 2020 & 2033
- Table 36: Global Feed Testing Market Volume Kiloton Forecast, by Import Market Analysis (Value & Volume) 2020 & 2033
- Table 37: Global Feed Testing Market Revenue Million Forecast, by Export Market Analysis (Value & Volume) 2020 & 2033
- Table 38: Global Feed Testing Market Volume Kiloton Forecast, by Export Market Analysis (Value & Volume) 2020 & 2033
- Table 39: Global Feed Testing Market Revenue Million Forecast, by Price Trend Analysis 2020 & 2033
- Table 40: Global Feed Testing Market Volume Kiloton Forecast, by Price Trend Analysis 2020 & 2033
- Table 41: Global Feed Testing Market Revenue Million Forecast, by Country 2020 & 2033
- Table 42: Global Feed Testing Market Volume Kiloton Forecast, by Country 2020 & 2033
- Table 43: Brazil Feed Testing Market Revenue (Million) Forecast, by Application 2020 & 2033
- Table 44: Brazil Feed Testing Market Volume (Kiloton) Forecast, by Application 2020 & 2033
- Table 45: Argentina Feed Testing Market Revenue (Million) Forecast, by Application 2020 & 2033
- Table 46: Argentina Feed Testing Market Volume (Kiloton) Forecast, by Application 2020 & 2033
- Table 47: Rest of South America Feed Testing Market Revenue (Million) Forecast, by Application 2020 & 2033
- Table 48: Rest of South America Feed Testing Market Volume (Kiloton) Forecast, by Application 2020 & 2033
- Table 49: Global Feed Testing Market Revenue Million Forecast, by Production Analysis 2020 & 2033
- Table 50: Global Feed Testing Market Volume Kiloton Forecast, by Production Analysis 2020 & 2033
- Table 51: Global Feed Testing Market Revenue Million Forecast, by Consumption Analysis 2020 & 2033
- Table 52: Global Feed Testing Market Volume Kiloton Forecast, by Consumption Analysis 2020 & 2033
- Table 53: Global Feed Testing Market Revenue Million Forecast, by Import Market Analysis (Value & Volume) 2020 & 2033
- Table 54: Global Feed Testing Market Volume Kiloton Forecast, by Import Market Analysis (Value & Volume) 2020 & 2033
- Table 55: Global Feed Testing Market Revenue Million Forecast, by Export Market Analysis (Value & Volume) 2020 & 2033
- Table 56: Global Feed Testing Market Volume Kiloton Forecast, by Export Market Analysis (Value & Volume) 2020 & 2033
- Table 57: Global Feed Testing Market Revenue Million Forecast, by Price Trend Analysis 2020 & 2033
- Table 58: Global Feed Testing Market Volume Kiloton Forecast, by Price Trend Analysis 2020 & 2033
- Table 59: Global Feed Testing Market Revenue Million Forecast, by Country 2020 & 2033
- Table 60: Global Feed Testing Market Volume Kiloton Forecast, by Country 2020 & 2033
- Table 61: United Kingdom Feed Testing Market Revenue (Million) Forecast, by Application 2020 & 2033
- Table 62: United Kingdom Feed Testing Market Volume (Kiloton) Forecast, by Application 2020 & 2033
- Table 63: Germany Feed Testing Market Revenue (Million) Forecast, by Application 2020 & 2033
- Table 64: Germany Feed Testing Market Volume (Kiloton) Forecast, by Application 2020 & 2033
- Table 65: France Feed Testing Market Revenue (Million) Forecast, by Application 2020 & 2033
- Table 66: France Feed Testing Market Volume (Kiloton) Forecast, by Application 2020 & 2033
- Table 67: Italy Feed Testing Market Revenue (Million) Forecast, by Application 2020 & 2033
- Table 68: Italy Feed Testing Market Volume (Kiloton) Forecast, by Application 2020 & 2033
- Table 69: Spain Feed Testing Market Revenue (Million) Forecast, by Application 2020 & 2033
- Table 70: Spain Feed Testing Market Volume (Kiloton) Forecast, by Application 2020 & 2033
- Table 71: Russia Feed Testing Market Revenue (Million) Forecast, by Application 2020 & 2033
- Table 72: Russia Feed Testing Market Volume (Kiloton) Forecast, by Application 2020 & 2033
- Table 73: Benelux Feed Testing Market Revenue (Million) Forecast, by Application 2020 & 2033
- Table 74: Benelux Feed Testing Market Volume (Kiloton) Forecast, by Application 2020 & 2033
- Table 75: Nordics Feed Testing Market Revenue (Million) Forecast, by Application 2020 & 2033
- Table 76: Nordics Feed Testing Market Volume (Kiloton) Forecast, by Application 2020 & 2033
- Table 77: Rest of Europe Feed Testing Market Revenue (Million) Forecast, by Application 2020 & 2033
- Table 78: Rest of Europe Feed Testing Market Volume (Kiloton) Forecast, by Application 2020 & 2033
- Table 79: Global Feed Testing Market Revenue Million Forecast, by Production Analysis 2020 & 2033
- Table 80: Global Feed Testing Market Volume Kiloton Forecast, by Production Analysis 2020 & 2033
- Table 81: Global Feed Testing Market Revenue Million Forecast, by Consumption Analysis 2020 & 2033
- Table 82: Global Feed Testing Market Volume Kiloton Forecast, by Consumption Analysis 2020 & 2033
- Table 83: Global Feed Testing Market Revenue Million Forecast, by Import Market Analysis (Value & Volume) 2020 & 2033
- Table 84: Global Feed Testing Market Volume Kiloton Forecast, by Import Market Analysis (Value & Volume) 2020 & 2033
- Table 85: Global Feed Testing Market Revenue Million Forecast, by Export Market Analysis (Value & Volume) 2020 & 2033
- Table 86: Global Feed Testing Market Volume Kiloton Forecast, by Export Market Analysis (Value & Volume) 2020 & 2033
- Table 87: Global Feed Testing Market Revenue Million Forecast, by Price Trend Analysis 2020 & 2033
- Table 88: Global Feed Testing Market Volume Kiloton Forecast, by Price Trend Analysis 2020 & 2033
- Table 89: Global Feed Testing Market Revenue Million Forecast, by Country 2020 & 2033
- Table 90: Global Feed Testing Market Volume Kiloton Forecast, by Country 2020 & 2033
- Table 91: Turkey Feed Testing Market Revenue (Million) Forecast, by Application 2020 & 2033
- Table 92: Turkey Feed Testing Market Volume (Kiloton) Forecast, by Application 2020 & 2033
- Table 93: Israel Feed Testing Market Revenue (Million) Forecast, by Application 2020 & 2033
- Table 94: Israel Feed Testing Market Volume (Kiloton) Forecast, by Application 2020 & 2033
- Table 95: GCC Feed Testing Market Revenue (Million) Forecast, by Application 2020 & 2033
- Table 96: GCC Feed Testing Market Volume (Kiloton) Forecast, by Application 2020 & 2033
- Table 97: North Africa Feed Testing Market Revenue (Million) Forecast, by Application 2020 & 2033
- Table 98: North Africa Feed Testing Market Volume (Kiloton) Forecast, by Application 2020 & 2033
- Table 99: South Africa Feed Testing Market Revenue (Million) Forecast, by Application 2020 & 2033
- Table 100: South Africa Feed Testing Market Volume (Kiloton) Forecast, by Application 2020 & 2033
- Table 101: Rest of Middle East & Africa Feed Testing Market Revenue (Million) Forecast, by Application 2020 & 2033
- Table 102: Rest of Middle East & Africa Feed Testing Market Volume (Kiloton) Forecast, by Application 2020 & 2033
- Table 103: Global Feed Testing Market Revenue Million Forecast, by Production Analysis 2020 & 2033
- Table 104: Global Feed Testing Market Volume Kiloton Forecast, by Production Analysis 2020 & 2033
- Table 105: Global Feed Testing Market Revenue Million Forecast, by Consumption Analysis 2020 & 2033
- Table 106: Global Feed Testing Market Volume Kiloton Forecast, by Consumption Analysis 2020 & 2033
- Table 107: Global Feed Testing Market Revenue Million Forecast, by Import Market Analysis (Value & Volume) 2020 & 2033
- Table 108: Global Feed Testing Market Volume Kiloton Forecast, by Import Market Analysis (Value & Volume) 2020 & 2033
- Table 109: Global Feed Testing Market Revenue Million Forecast, by Export Market Analysis (Value & Volume) 2020 & 2033
- Table 110: Global Feed Testing Market Volume Kiloton Forecast, by Export Market Analysis (Value & Volume) 2020 & 2033
- Table 111: Global Feed Testing Market Revenue Million Forecast, by Price Trend Analysis 2020 & 2033
- Table 112: Global Feed Testing Market Volume Kiloton Forecast, by Price Trend Analysis 2020 & 2033
- Table 113: Global Feed Testing Market Revenue Million Forecast, by Country 2020 & 2033
- Table 114: Global Feed Testing Market Volume Kiloton Forecast, by Country 2020 & 2033
- Table 115: China Feed Testing Market Revenue (Million) Forecast, by Application 2020 & 2033
- Table 116: China Feed Testing Market Volume (Kiloton) Forecast, by Application 2020 & 2033
- Table 117: India Feed Testing Market Revenue (Million) Forecast, by Application 2020 & 2033
- Table 118: India Feed Testing Market Volume (Kiloton) Forecast, by Application 2020 & 2033
- Table 119: Japan Feed Testing Market Revenue (Million) Forecast, by Application 2020 & 2033
- Table 120: Japan Feed Testing Market Volume (Kiloton) Forecast, by Application 2020 & 2033
- Table 121: South Korea Feed Testing Market Revenue (Million) Forecast, by Application 2020 & 2033
- Table 122: South Korea Feed Testing Market Volume (Kiloton) Forecast, by Application 2020 & 2033
- Table 123: ASEAN Feed Testing Market Revenue (Million) Forecast, by Application 2020 & 2033
- Table 124: ASEAN Feed Testing Market Volume (Kiloton) Forecast, by Application 2020 & 2033
- Table 125: Oceania Feed Testing Market Revenue (Million) Forecast, by Application 2020 & 2033
- Table 126: Oceania Feed Testing Market Volume (Kiloton) Forecast, by Application 2020 & 2033
- Table 127: Rest of Asia Pacific Feed Testing Market Revenue (Million) Forecast, by Application 2020 & 2033
- Table 128: Rest of Asia Pacific Feed Testing Market Volume (Kiloton) Forecast, by Application 2020 & 2033
Frequently Asked Questions
1. What is the projected Compound Annual Growth Rate (CAGR) of the Feed Testing Market?
The projected CAGR is approximately 9.80%.
2. Which companies are prominent players in the Feed Testing Market?
Key companies in the market include SGS SA, R J Hill Laboratories Ltd, NSF International*List Not Exhaustive, Intertek Group PLC, Adpen Laboratories Inc, Bruker Biosciences Corporation, Genetic ID NA Inc, Genon Laboratories Ltd, Eurofins Scientific, Invisible Sentinel Inc.
3. What are the main segments of the Feed Testing Market?
The market segments include Production Analysis, Consumption Analysis, Import Market Analysis (Value & Volume), Export Market Analysis (Value & Volume), Price Trend Analysis.
4. Can you provide details about the market size?
The market size is estimated to be USD 2.54 Million as of 2022.
5. What are some drivers contributing to market growth?
Decreasing Per Capita Arable Land; Increased Demand for Food.
6. What are the notable trends driving market growth?
Increasing Government Regulations Driving Growth of Pet Food Testing Market.
7. Are there any restraints impacting market growth?
High Initial Investments; Requirement of Precision Agriculture.
8. Can you provide examples of recent developments in the market?
N/A
9. What pricing options are available for accessing the report?
Pricing options include single-user, multi-user, and enterprise licenses priced at USD 4750, USD 5250, and USD 8750 respectively.
10. Is the market size provided in terms of value or volume?
The market size is provided in terms of value, measured in Million and volume, measured in Kiloton.
11. Are there any specific market keywords associated with the report?
Yes, the market keyword associated with the report is "Feed Testing Market," which aids in identifying and referencing the specific market segment covered.
12. How do I determine which pricing option suits my needs best?
The pricing options vary based on user requirements and access needs. Individual users may opt for single-user licenses, while businesses requiring broader access may choose multi-user or enterprise licenses for cost-effective access to the report.
13. Are there any additional resources or data provided in the Feed Testing Market report?
While the report offers comprehensive insights, it's advisable to review the specific contents or supplementary materials provided to ascertain if additional resources or data are available.
14. How can I stay updated on further developments or reports in the Feed Testing Market?
To stay informed about further developments, trends, and reports in the Feed Testing Market, consider subscribing to industry newsletters, following relevant companies and organizations, or regularly checking reputable industry news sources and publications.
Methodology
Step 1 - Identification of Relevant Samples Size from Population Database


Step 2 - Approaches for Defining Global Market Size (Value, Volume* & Price*)

Note*: In applicable scenarios
Step 3 - Data Sources
Primary Research
- Web Analytics
- Survey Reports
- Research Institute
- Latest Research Reports
- Opinion Leaders
Secondary Research
- Annual Reports
- White Paper
- Latest Press Release
- Industry Association
- Paid Database
- Investor Presentations

Step 4 - Data Triangulation
Involves using different sources of information in order to increase the validity of a study
These sources are likely to be stakeholders in a program - participants, other researchers, program staff, other community members, and so on.
Then we put all data in single framework & apply various statistical tools to find out the dynamic on the market.
During the analysis stage, feedback from the stakeholder groups would be compared to determine areas of agreement as well as areas of divergence