

Key Insights
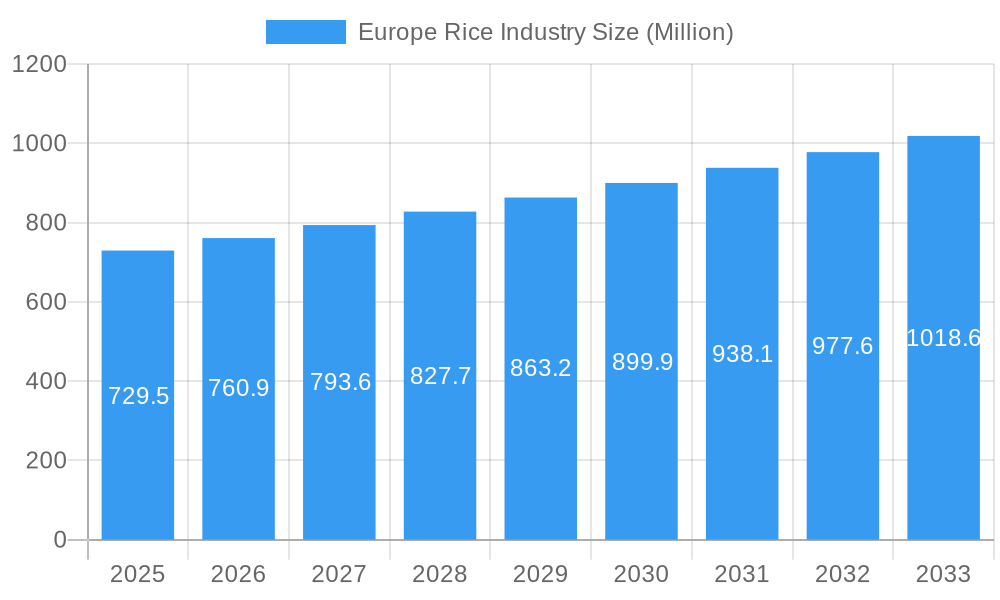
The European rice market, valued at €729.5 million in 2025, is projected to experience steady growth, driven by increasing consumer demand for convenient and healthy food options. Parboiled and organic rice segments are anticipated to witness particularly strong growth, fueled by rising health consciousness and a preference for sustainably produced food. The food and beverage industry remains the dominant application segment, although the animal feed sector is expected to see gradual expansion. Key players like BASF, Corteva Agriscience, Syngenta, Bayer CropScience, and Rallis India are actively shaping the market landscape through technological advancements in rice production and processing. Germany, France, Italy, and the United Kingdom represent the largest national markets within Europe, with robust consumption patterns and established distribution networks. The market growth is further influenced by factors such as fluctuating rice prices, government policies related to agricultural subsidies, and evolving consumer preferences toward specific rice varieties.
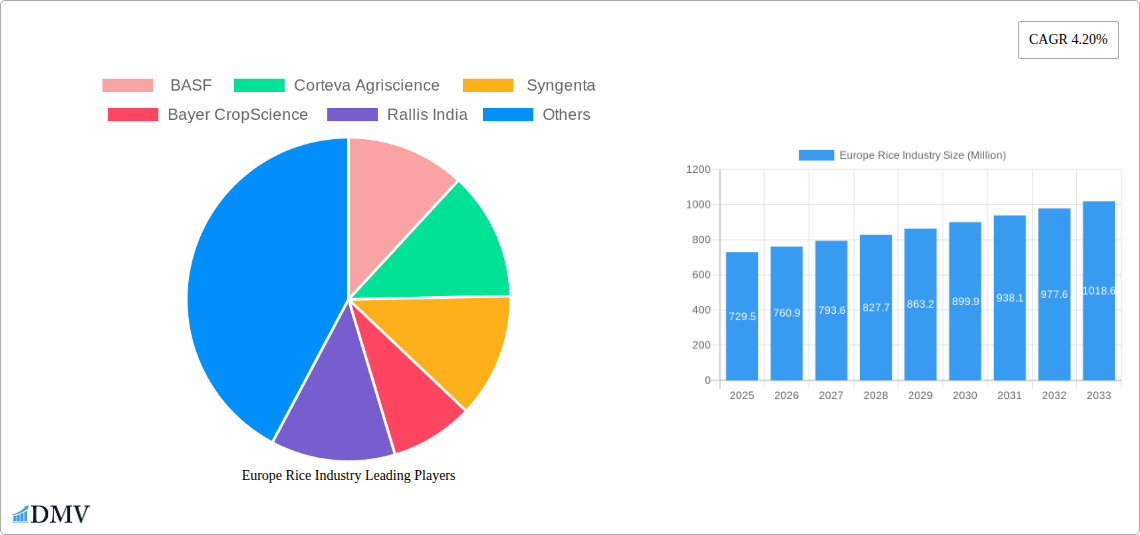
Europe Rice Industry Market Size (In Million)
The projected Compound Annual Growth Rate (CAGR) of 4.20% from 2025 to 2033 suggests a considerable market expansion over the forecast period. This growth is expected to be influenced by a number of factors including increased disposable incomes in certain European countries, a growing preference for ethically sourced and sustainable rice products, and the introduction of innovative rice-based products in the food and beverage sector. However, potential restraints include competition from other staple grains and the impact of climate change on rice yields. Continuous innovation in rice cultivation techniques and processing methods will be crucial for market players to maintain a competitive edge and capitalize on the growth opportunities in the European rice market. The market's dynamic nature suggests a need for adaptable business strategies focused on both sustainability and consumer preference trends.
Europe Rice Industry Company Market Share
Europe Rice Industry: A Comprehensive Market Report (2019-2033)
This insightful report provides a comprehensive analysis of the European rice industry, offering a detailed overview of market trends, competitive dynamics, and future growth prospects. The study period spans from 2019 to 2033, with 2025 serving as the base and estimated year. This report is essential for stakeholders including producers, processors, distributors, investors, and policymakers seeking to navigate this dynamic market. The report meticulously analyzes market segments, including Parboiled Rice, Organic Rice, and Conventional Rice, across applications in Food & Beverage and Animal Feed. Key players like BASF, Corteva Agriscience, Syngenta, Bayer CropScience, and Rallis India are profiled, providing a granular understanding of the competitive landscape. The report projects a market value of xx Million by 2033, showcasing significant growth opportunities.
Europe Rice Industry Market Composition & Trends
This section meticulously examines the European rice market's structure and prevailing trends. Market concentration is analyzed, revealing the market share distribution among key players. For example, the top three players (BASF, Syngenta, and Bayer CropScience) collectively hold an estimated 45% market share in 2025. The report also delves into the impact of innovation, regulatory changes (e.g., EU regulations on pesticide use), the availability of substitute products (like pasta and other grains), and evolving end-user preferences (e.g., increasing demand for organic rice). Furthermore, the report analyzes mergers and acquisitions (M&A) activities within the industry, detailing significant deals and their implications for market consolidation. The total value of M&A deals in the historical period (2019-2024) is estimated at xx Million.
- Market Concentration: High concentration with a few dominant players.
- Innovation Catalysts: Focus on improving yield, sustainability, and product quality.
- Regulatory Landscape: Stringent regulations impacting pesticide use and food safety.
- Substitute Products: Pasta, other grains pose competition.
- End-User Profiles: Food processing companies, retailers, and animal feed manufacturers.
- M&A Activities: Consolidation through strategic acquisitions, with an estimated xx Million in deal value during 2019-2024.
Europe Rice Industry Industry Evolution
This section provides a detailed analysis of the evolution of the European rice industry from 2019 to 2033, focusing on growth trajectories, technological advancements, and shifts in consumer demand. The market has witnessed a Compound Annual Growth Rate (CAGR) of x% during the historical period (2019-2024), driven by factors such as increasing health consciousness (leading to higher organic rice consumption) and the growth of the food processing industry. Technological advancements, particularly in precision agriculture and improved rice varieties, have contributed significantly to yield improvements and enhanced product quality. Consumer demand is increasingly shifting towards healthier, sustainably produced rice, impacting market segmentation and pricing strategies. Adoption of precision farming techniques is estimated at xx% in 2025, with a projected increase to xx% by 2033.
Leading Regions, Countries, or Segments in Europe Rice Industry
This section identifies the dominant regions, countries, and segments within the European rice market. While data varies by year, Italy and Spain consistently rank as leading consumers and producers. In terms of product type, Conventional Rice maintains the largest market share, followed by Parboiled Rice and Organic Rice. The Food & Beverage segment holds the largest share of the application market, though animal feed is showing strong growth.
Key Drivers for Dominance:
- Italy: Established rice cultivation practices, favorable climate, and strong domestic demand.
- Spain: Significant production capabilities, government support for agricultural innovation.
- Conventional Rice: Cost-effectiveness and wide availability.
- Food & Beverage: High demand from various food manufacturers and the restaurant sector.
In-depth Analysis: The dominance of Italy and Spain is attributed to a combination of factors including favorable climatic conditions, established infrastructure, and substantial government support for the agricultural sector. The high market share of conventional rice reflects its cost-competitiveness and widespread accessibility compared to organic and parboiled options. However, the Food & Beverage segment’s dominance is being challenged by the growing Animal Feed sector, fuelled by increasing livestock populations and demand for protein-rich feedstuffs.
Europe Rice Industry Product Innovations
Recent innovations focus on developing rice varieties with improved yield, nutritional content, and resilience to climate change. Improved processing techniques enhance shelf life and product quality. Unique selling propositions include enhanced taste, texture, and nutritional value. Technological advancements in genetic modification and precision agriculture are driving these innovations.
Propelling Factors for Europe Rice Industry Growth
Several factors drive the growth of the European rice industry. Technological advancements in agriculture, such as precision farming and improved seed varieties, lead to higher yields and reduced production costs. Positive economic growth and rising disposable incomes boost consumer spending on food, including rice. Favorable government policies and regulatory support for the agricultural sector further stimulate industry growth. Specifically, EU initiatives promoting sustainable agriculture are expected to positively impact organic rice production.
Obstacles in the Europe Rice Industry Market
The European rice industry faces several challenges. Climate change, including extreme weather events, poses significant threats to crop yields and production stability. Fluctuations in global rice prices impact profitability, while intense competition from other grain products and increasing input costs (fertilizers, labor) constrain margins. Stringent regulatory requirements related to food safety and environmental protection add to operational complexities and costs. Supply chain disruptions due to geopolitical events can cause price volatility and impact market accessibility.
Future Opportunities in Europe Rice Industry
The European rice industry presents several exciting opportunities. Growth in the organic rice segment presents a significant market for producers emphasizing sustainability and health-conscious consumer preferences. Technological advancements, such as the development of drought-resistant rice varieties and precision agriculture techniques, can improve yield and efficiency. Exploring new niche markets (e.g., specialty rice varieties) can enhance profitability and cater to growing consumer preferences for diverse culinary options.
Major Players in the Europe Rice Industry Ecosystem
- BASF
- Corteva Agriscience
- Syngenta
- Bayer CropScience
- Rallis India
Key Developments in Europe Rice Industry Industry
- 2022-Q4: Syngenta launches a new high-yield rice variety.
- 2023-Q1: BASF invests in a new rice processing facility in Italy.
- 2023-Q2: Corteva Agriscience partners with a local farm cooperative to promote sustainable rice farming.
- (Further developments can be added here with specific dates and impacts)
Strategic Europe Rice Industry Market Forecast
The European rice industry is poised for continued growth, driven by factors such as technological advancements, changing consumer preferences, and increasing demand from the food processing and animal feed sectors. The market is expected to expand significantly over the forecast period (2025-2033), presenting opportunities for established players and new entrants. However, addressing challenges related to climate change, supply chain resilience, and regulatory compliance will be crucial for long-term sustainability and success.
Europe Rice Industry Segmentation
- 1. Production Analysis
- 2. Consumption Analysis
- 3. Import Market Analysis (Value & Volume)
- 4. Export Market Analysis (Value & Volume)
- 5. Price Trend Analysis
Europe Rice Industry Segmentation By Geography
- 1. Belgium
- 2. United Kingdom
- 3. France
- 4. Italy
- 5. Germany
- 6. Spain
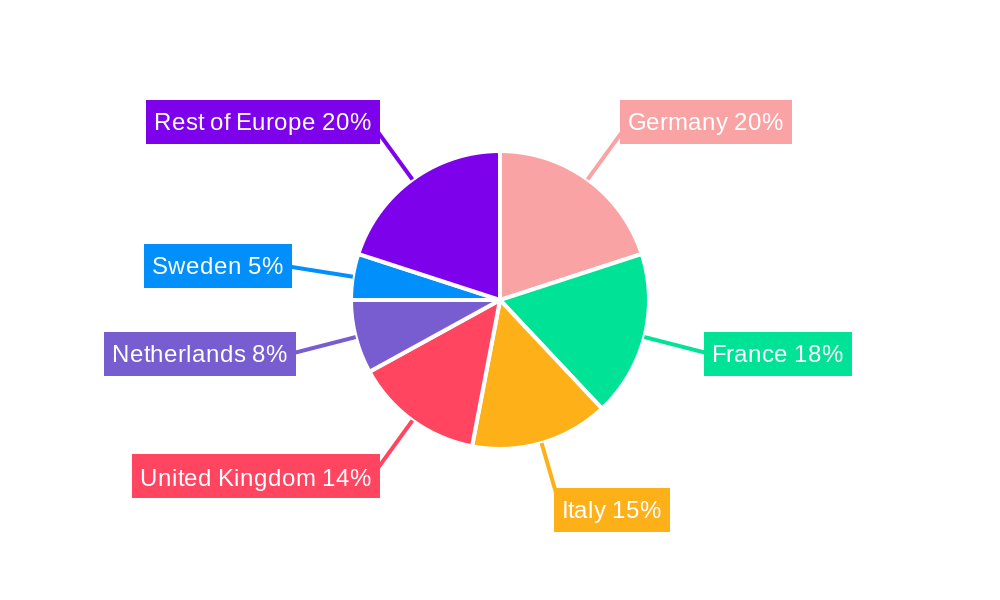
Europe Rice Industry Regional Market Share
Geographic Coverage of Europe Rice Industry
Europe Rice Industry REPORT HIGHLIGHTS
| Aspects | Details |
|---|---|
| Study Period | 2020-2034 |
| Base Year | 2025 |
| Estimated Year | 2026 |
| Forecast Period | 2026-2034 |
| Historical Period | 2020-2025 |
| Growth Rate | CAGR of 4.20% from 2020-2034 |
| Segmentation |
|
Table of Contents
- 1. Introduction
- 1.1. Research Scope
- 1.2. Market Segmentation
- 1.3. Research Objective
- 1.4. Definitions and Assumptions
- 2. Executive Summary
- 2.1. Market Snapshot
- 3. Market Dynamics
- 3.1. Market Drivers
- 3.2. Market Restrains
- 3.3. Market Trends
- 3.4. Market Opportunities
- 4. Market Factor Analysis
- 4.1. Porters Five Forces
- 4.1.1. Bargaining Power of Suppliers
- 4.1.2. Bargaining Power of Buyers
- 4.1.3. Threat of New Entrants
- 4.1.4. Threat of Substitutes
- 4.1.5. Competitive Rivalry
- 4.2. PESTEL analysis
- 4.3. BCG Analysis
- 4.3.1. Stars (High Growth, High Market Share)
- 4.3.2. Cash Cows (Low Growth, High Market Share)
- 4.3.3. Question Mark (High Growth, Low Market Share)
- 4.3.4. Dogs (Low Growth, Low Market Share)
- 4.4. Ansoff Matrix Analysis
- 4.5. Supply Chain Analysis
- 4.6. Regulatory Landscape
- 4.7. Current Market Potential and Opportunity Assessment (TAM–SAM–SOM Framework)
- 4.8. DMV Analyst Note
- 4.1. Porters Five Forces
- 5. Market Analysis, Insights and Forecast 2021-2033
- 5.1. Market Analysis, Insights and Forecast - by Production Analysis
- 5.2. Market Analysis, Insights and Forecast - by Consumption Analysis
- 5.3. Market Analysis, Insights and Forecast - by Import Market Analysis (Value & Volume)
- 5.4. Market Analysis, Insights and Forecast - by Export Market Analysis (Value & Volume)
- 5.5. Market Analysis, Insights and Forecast - by Price Trend Analysis
- 5.6. Market Analysis, Insights and Forecast - by Region
- 5.6.1. Belgium
- 5.6.2. United Kingdom
- 5.6.3. France
- 5.6.4. Italy
- 5.6.5. Germany
- 5.6.6. Spain
- 6. Europe Rice Industry Analysis, Insights and Forecast, 2021-2033
- 6.1. Market Analysis, Insights and Forecast - by Production Analysis
- 6.2. Market Analysis, Insights and Forecast - by Consumption Analysis
- 6.3. Market Analysis, Insights and Forecast - by Import Market Analysis (Value & Volume)
- 6.4. Market Analysis, Insights and Forecast - by Export Market Analysis (Value & Volume)
- 6.5. Market Analysis, Insights and Forecast - by Price Trend Analysis
- 7. Belgium Europe Rice Industry Analysis, Insights and Forecast, 2020-2032
- 7.1. Market Analysis, Insights and Forecast - by Production Analysis
- 7.2. Market Analysis, Insights and Forecast - by Consumption Analysis
- 7.3. Market Analysis, Insights and Forecast - by Import Market Analysis (Value & Volume)
- 7.4. Market Analysis, Insights and Forecast - by Export Market Analysis (Value & Volume)
- 7.5. Market Analysis, Insights and Forecast - by Price Trend Analysis
- 8. United Kingdom Europe Rice Industry Analysis, Insights and Forecast, 2020-2032
- 8.1. Market Analysis, Insights and Forecast - by Production Analysis
- 8.2. Market Analysis, Insights and Forecast - by Consumption Analysis
- 8.3. Market Analysis, Insights and Forecast - by Import Market Analysis (Value & Volume)
- 8.4. Market Analysis, Insights and Forecast - by Export Market Analysis (Value & Volume)
- 8.5. Market Analysis, Insights and Forecast - by Price Trend Analysis
- 9. France Europe Rice Industry Analysis, Insights and Forecast, 2020-2032
- 9.1. Market Analysis, Insights and Forecast - by Production Analysis
- 9.2. Market Analysis, Insights and Forecast - by Consumption Analysis
- 9.3. Market Analysis, Insights and Forecast - by Import Market Analysis (Value & Volume)
- 9.4. Market Analysis, Insights and Forecast - by Export Market Analysis (Value & Volume)
- 9.5. Market Analysis, Insights and Forecast - by Price Trend Analysis
- 10. Italy Europe Rice Industry Analysis, Insights and Forecast, 2020-2032
- 10.1. Market Analysis, Insights and Forecast - by Production Analysis
- 10.2. Market Analysis, Insights and Forecast - by Consumption Analysis
- 10.3. Market Analysis, Insights and Forecast - by Import Market Analysis (Value & Volume)
- 10.4. Market Analysis, Insights and Forecast - by Export Market Analysis (Value & Volume)
- 10.5. Market Analysis, Insights and Forecast - by Price Trend Analysis
- 11. Germany Europe Rice Industry Analysis, Insights and Forecast, 2020-2032
- 11.1. Market Analysis, Insights and Forecast - by Production Analysis
- 11.2. Market Analysis, Insights and Forecast - by Consumption Analysis
- 11.3. Market Analysis, Insights and Forecast - by Import Market Analysis (Value & Volume)
- 11.4. Market Analysis, Insights and Forecast - by Export Market Analysis (Value & Volume)
- 11.5. Market Analysis, Insights and Forecast - by Price Trend Analysis
- 12. Spain Europe Rice Industry Analysis, Insights and Forecast, 2020-2032
- 12.1. Market Analysis, Insights and Forecast - by Production Analysis
- 12.2. Market Analysis, Insights and Forecast - by Consumption Analysis
- 12.3. Market Analysis, Insights and Forecast - by Import Market Analysis (Value & Volume)
- 12.4. Market Analysis, Insights and Forecast - by Export Market Analysis (Value & Volume)
- 12.5. Market Analysis, Insights and Forecast - by Price Trend Analysis
- 13. Competitive Analysis
- 13.1. Company Profiles
- 13.1.1 BASF
- 13.1.1.1. Company Overview
- 13.1.1.2. Products
- 13.1.1.3. Company Financials
- 13.1.1.4. SWOT Analysis
- 13.1.2 Corteva Agriscience
- 13.1.2.1. Company Overview
- 13.1.2.2. Products
- 13.1.2.3. Company Financials
- 13.1.2.4. SWOT Analysis
- 13.1.3 Syngenta
- 13.1.3.1. Company Overview
- 13.1.3.2. Products
- 13.1.3.3. Company Financials
- 13.1.3.4. SWOT Analysis
- 13.1.4 Bayer CropScience
- 13.1.4.1. Company Overview
- 13.1.4.2. Products
- 13.1.4.3. Company Financials
- 13.1.4.4. SWOT Analysis
- 13.1.5 Rallis India
- 13.1.5.1. Company Overview
- 13.1.5.2. Products
- 13.1.5.3. Company Financials
- 13.1.5.4. SWOT Analysis
- 13.1.1 BASF
- 13.2. Market Entropy
- 13.2.1 Company's Key Areas Served
- 13.2.2 Recent Developments
- 13.3. Company Market Share Analysis 2025
- 13.3.1 Top 5 Companies Market Share Analysis
- 13.3.2 Top 3 Companies Market Share Analysis
- 13.4. List of Potential Customers
- 14. Research Methodology
List of Figures
- Figure 1: Europe Rice Industry Revenue Breakdown (Million, %) by Product 2025 & 2033
- Figure 2: Europe Rice Industry Share (%) by Company 2025
List of Tables
- Table 1: Europe Rice Industry Revenue Million Forecast, by Production Analysis 2020 & 2033
- Table 2: Europe Rice Industry Volume Kiloton Forecast, by Production Analysis 2020 & 2033
- Table 3: Europe Rice Industry Revenue Million Forecast, by Consumption Analysis 2020 & 2033
- Table 4: Europe Rice Industry Volume Kiloton Forecast, by Consumption Analysis 2020 & 2033
- Table 5: Europe Rice Industry Revenue Million Forecast, by Import Market Analysis (Value & Volume) 2020 & 2033
- Table 6: Europe Rice Industry Volume Kiloton Forecast, by Import Market Analysis (Value & Volume) 2020 & 2033
- Table 7: Europe Rice Industry Revenue Million Forecast, by Export Market Analysis (Value & Volume) 2020 & 2033
- Table 8: Europe Rice Industry Volume Kiloton Forecast, by Export Market Analysis (Value & Volume) 2020 & 2033
- Table 9: Europe Rice Industry Revenue Million Forecast, by Price Trend Analysis 2020 & 2033
- Table 10: Europe Rice Industry Volume Kiloton Forecast, by Price Trend Analysis 2020 & 2033
- Table 11: Europe Rice Industry Revenue Million Forecast, by Region 2020 & 2033
- Table 12: Europe Rice Industry Volume Kiloton Forecast, by Region 2020 & 2033
- Table 13: Europe Rice Industry Revenue Million Forecast, by Production Analysis 2020 & 2033
- Table 14: Europe Rice Industry Volume Kiloton Forecast, by Production Analysis 2020 & 2033
- Table 15: Europe Rice Industry Revenue Million Forecast, by Consumption Analysis 2020 & 2033
- Table 16: Europe Rice Industry Volume Kiloton Forecast, by Consumption Analysis 2020 & 2033
- Table 17: Europe Rice Industry Revenue Million Forecast, by Import Market Analysis (Value & Volume) 2020 & 2033
- Table 18: Europe Rice Industry Volume Kiloton Forecast, by Import Market Analysis (Value & Volume) 2020 & 2033
- Table 19: Europe Rice Industry Revenue Million Forecast, by Export Market Analysis (Value & Volume) 2020 & 2033
- Table 20: Europe Rice Industry Volume Kiloton Forecast, by Export Market Analysis (Value & Volume) 2020 & 2033
- Table 21: Europe Rice Industry Revenue Million Forecast, by Price Trend Analysis 2020 & 2033
- Table 22: Europe Rice Industry Volume Kiloton Forecast, by Price Trend Analysis 2020 & 2033
- Table 23: Europe Rice Industry Revenue Million Forecast, by Country 2020 & 2033
- Table 24: Europe Rice Industry Volume Kiloton Forecast, by Country 2020 & 2033
- Table 25: Europe Rice Industry Revenue Million Forecast, by Production Analysis 2020 & 2033
- Table 26: Europe Rice Industry Volume Kiloton Forecast, by Production Analysis 2020 & 2033
- Table 27: Europe Rice Industry Revenue Million Forecast, by Consumption Analysis 2020 & 2033
- Table 28: Europe Rice Industry Volume Kiloton Forecast, by Consumption Analysis 2020 & 2033
- Table 29: Europe Rice Industry Revenue Million Forecast, by Import Market Analysis (Value & Volume) 2020 & 2033
- Table 30: Europe Rice Industry Volume Kiloton Forecast, by Import Market Analysis (Value & Volume) 2020 & 2033
- Table 31: Europe Rice Industry Revenue Million Forecast, by Export Market Analysis (Value & Volume) 2020 & 2033
- Table 32: Europe Rice Industry Volume Kiloton Forecast, by Export Market Analysis (Value & Volume) 2020 & 2033
- Table 33: Europe Rice Industry Revenue Million Forecast, by Price Trend Analysis 2020 & 2033
- Table 34: Europe Rice Industry Volume Kiloton Forecast, by Price Trend Analysis 2020 & 2033
- Table 35: Europe Rice Industry Revenue Million Forecast, by Country 2020 & 2033
- Table 36: Europe Rice Industry Volume Kiloton Forecast, by Country 2020 & 2033
- Table 37: Europe Rice Industry Revenue Million Forecast, by Production Analysis 2020 & 2033
- Table 38: Europe Rice Industry Volume Kiloton Forecast, by Production Analysis 2020 & 2033
- Table 39: Europe Rice Industry Revenue Million Forecast, by Consumption Analysis 2020 & 2033
- Table 40: Europe Rice Industry Volume Kiloton Forecast, by Consumption Analysis 2020 & 2033
- Table 41: Europe Rice Industry Revenue Million Forecast, by Import Market Analysis (Value & Volume) 2020 & 2033
- Table 42: Europe Rice Industry Volume Kiloton Forecast, by Import Market Analysis (Value & Volume) 2020 & 2033
- Table 43: Europe Rice Industry Revenue Million Forecast, by Export Market Analysis (Value & Volume) 2020 & 2033
- Table 44: Europe Rice Industry Volume Kiloton Forecast, by Export Market Analysis (Value & Volume) 2020 & 2033
- Table 45: Europe Rice Industry Revenue Million Forecast, by Price Trend Analysis 2020 & 2033
- Table 46: Europe Rice Industry Volume Kiloton Forecast, by Price Trend Analysis 2020 & 2033
- Table 47: Europe Rice Industry Revenue Million Forecast, by Country 2020 & 2033
- Table 48: Europe Rice Industry Volume Kiloton Forecast, by Country 2020 & 2033
- Table 49: Europe Rice Industry Revenue Million Forecast, by Production Analysis 2020 & 2033
- Table 50: Europe Rice Industry Volume Kiloton Forecast, by Production Analysis 2020 & 2033
- Table 51: Europe Rice Industry Revenue Million Forecast, by Consumption Analysis 2020 & 2033
- Table 52: Europe Rice Industry Volume Kiloton Forecast, by Consumption Analysis 2020 & 2033
- Table 53: Europe Rice Industry Revenue Million Forecast, by Import Market Analysis (Value & Volume) 2020 & 2033
- Table 54: Europe Rice Industry Volume Kiloton Forecast, by Import Market Analysis (Value & Volume) 2020 & 2033
- Table 55: Europe Rice Industry Revenue Million Forecast, by Export Market Analysis (Value & Volume) 2020 & 2033
- Table 56: Europe Rice Industry Volume Kiloton Forecast, by Export Market Analysis (Value & Volume) 2020 & 2033
- Table 57: Europe Rice Industry Revenue Million Forecast, by Price Trend Analysis 2020 & 2033
- Table 58: Europe Rice Industry Volume Kiloton Forecast, by Price Trend Analysis 2020 & 2033
- Table 59: Europe Rice Industry Revenue Million Forecast, by Country 2020 & 2033
- Table 60: Europe Rice Industry Volume Kiloton Forecast, by Country 2020 & 2033
- Table 61: Europe Rice Industry Revenue Million Forecast, by Production Analysis 2020 & 2033
- Table 62: Europe Rice Industry Volume Kiloton Forecast, by Production Analysis 2020 & 2033
- Table 63: Europe Rice Industry Revenue Million Forecast, by Consumption Analysis 2020 & 2033
- Table 64: Europe Rice Industry Volume Kiloton Forecast, by Consumption Analysis 2020 & 2033
- Table 65: Europe Rice Industry Revenue Million Forecast, by Import Market Analysis (Value & Volume) 2020 & 2033
- Table 66: Europe Rice Industry Volume Kiloton Forecast, by Import Market Analysis (Value & Volume) 2020 & 2033
- Table 67: Europe Rice Industry Revenue Million Forecast, by Export Market Analysis (Value & Volume) 2020 & 2033
- Table 68: Europe Rice Industry Volume Kiloton Forecast, by Export Market Analysis (Value & Volume) 2020 & 2033
- Table 69: Europe Rice Industry Revenue Million Forecast, by Price Trend Analysis 2020 & 2033
- Table 70: Europe Rice Industry Volume Kiloton Forecast, by Price Trend Analysis 2020 & 2033
- Table 71: Europe Rice Industry Revenue Million Forecast, by Country 2020 & 2033
- Table 72: Europe Rice Industry Volume Kiloton Forecast, by Country 2020 & 2033
- Table 73: Europe Rice Industry Revenue Million Forecast, by Production Analysis 2020 & 2033
- Table 74: Europe Rice Industry Volume Kiloton Forecast, by Production Analysis 2020 & 2033
- Table 75: Europe Rice Industry Revenue Million Forecast, by Consumption Analysis 2020 & 2033
- Table 76: Europe Rice Industry Volume Kiloton Forecast, by Consumption Analysis 2020 & 2033
- Table 77: Europe Rice Industry Revenue Million Forecast, by Import Market Analysis (Value & Volume) 2020 & 2033
- Table 78: Europe Rice Industry Volume Kiloton Forecast, by Import Market Analysis (Value & Volume) 2020 & 2033
- Table 79: Europe Rice Industry Revenue Million Forecast, by Export Market Analysis (Value & Volume) 2020 & 2033
- Table 80: Europe Rice Industry Volume Kiloton Forecast, by Export Market Analysis (Value & Volume) 2020 & 2033
- Table 81: Europe Rice Industry Revenue Million Forecast, by Price Trend Analysis 2020 & 2033
- Table 82: Europe Rice Industry Volume Kiloton Forecast, by Price Trend Analysis 2020 & 2033
- Table 83: Europe Rice Industry Revenue Million Forecast, by Country 2020 & 2033
- Table 84: Europe Rice Industry Volume Kiloton Forecast, by Country 2020 & 2033
Frequently Asked Questions
1. What is the projected Compound Annual Growth Rate (CAGR) of the Europe Rice Industry?
The projected CAGR is approximately 4.20%.
2. Which companies are prominent players in the Europe Rice Industry?
Key companies in the market include BASF , Corteva Agriscience , Syngenta, Bayer CropScience , Rallis India.
3. What are the main segments of the Europe Rice Industry?
The market segments include Production Analysis, Consumption Analysis, Import Market Analysis (Value & Volume), Export Market Analysis (Value & Volume), Price Trend Analysis.
4. Can you provide details about the market size?
The market size is estimated to be USD 729.50 Million as of 2022.
5. What are some drivers contributing to market growth?
Rising Consumption of Cashew Nuts in the Country; Favorable Government Initiatives.
6. What are the notable trends driving market growth?
Strong Demand in Northwestern Europe.
7. Are there any restraints impacting market growth?
Hazardous Climatic Condition Hinders Cashew Production; Stringent Regulations Related to Food Quality Standards.
8. Can you provide examples of recent developments in the market?
N/A
9. What pricing options are available for accessing the report?
Pricing options include single-user, multi-user, and enterprise licenses priced at USD 4750, USD 5250, and USD 8750 respectively.
10. Is the market size provided in terms of value or volume?
The market size is provided in terms of value, measured in Million and volume, measured in Kiloton.
11. Are there any specific market keywords associated with the report?
Yes, the market keyword associated with the report is "Europe Rice Industry," which aids in identifying and referencing the specific market segment covered.
12. How do I determine which pricing option suits my needs best?
The pricing options vary based on user requirements and access needs. Individual users may opt for single-user licenses, while businesses requiring broader access may choose multi-user or enterprise licenses for cost-effective access to the report.
13. Are there any additional resources or data provided in the Europe Rice Industry report?
While the report offers comprehensive insights, it's advisable to review the specific contents or supplementary materials provided to ascertain if additional resources or data are available.
14. How can I stay updated on further developments or reports in the Europe Rice Industry?
To stay informed about further developments, trends, and reports in the Europe Rice Industry, consider subscribing to industry newsletters, following relevant companies and organizations, or regularly checking reputable industry news sources and publications.
Methodology
Step 1 - Identification of Relevant Samples Size from Population Database


Step 2 - Approaches for Defining Global Market Size (Value, Volume* & Price*)

Note*: In applicable scenarios
Step 3 - Data Sources
Primary Research
- Web Analytics
- Survey Reports
- Research Institute
- Latest Research Reports
- Opinion Leaders
Secondary Research
- Annual Reports
- White Paper
- Latest Press Release
- Industry Association
- Paid Database
- Investor Presentations

Step 4 - Data Triangulation
Involves using different sources of information in order to increase the validity of a study
These sources are likely to be stakeholders in a program - participants, other researchers, program staff, other community members, and so on.
Then we put all data in single framework & apply various statistical tools to find out the dynamic on the market.
During the analysis stage, feedback from the stakeholder groups would be compared to determine areas of agreement as well as areas of divergence