

Key Insights
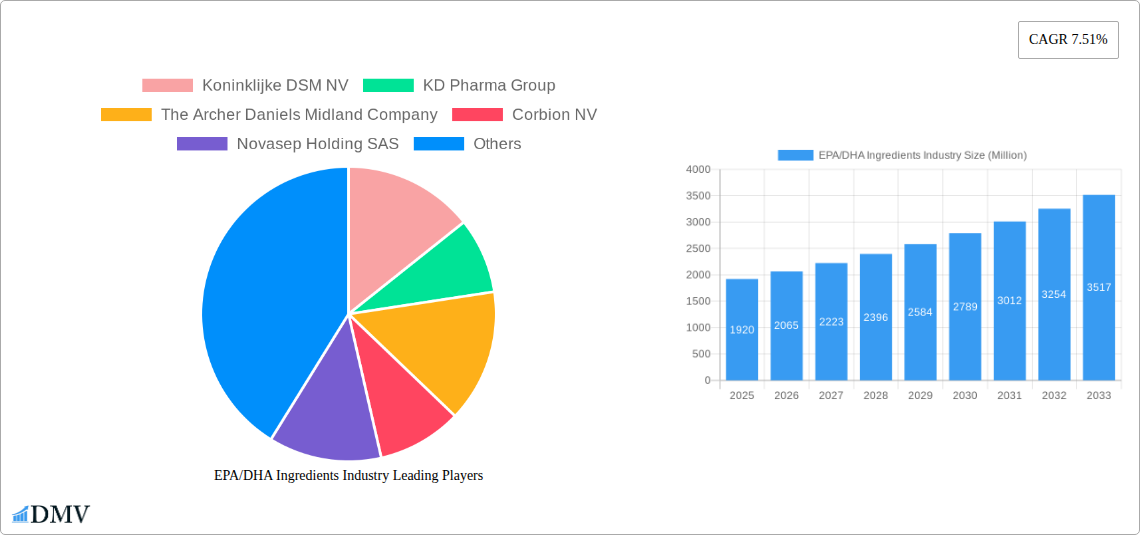
The EPA/DHA Ingredients market, valued at $1.92 billion in 2025, is projected to experience robust growth, driven by increasing consumer awareness of the health benefits associated with omega-3 fatty acids. This growth is fueled by the rising prevalence of chronic diseases like cardiovascular issues and cognitive decline, for which EPA and DHA are increasingly recognized as preventative and therapeutic agents. The functional food and beverage sector, along with the dietary supplement industry, are key drivers, incorporating EPA/DHA into products targeting health-conscious consumers seeking natural solutions. Furthermore, advancements in sustainable and efficient extraction and processing technologies are enhancing the market's appeal. This includes the development of more environmentally friendly methods for sourcing these essential fatty acids, addressing concerns around overfishing. Leading companies such as DSM, ADM, and Corbion are investing significantly in research and development, expanding their product portfolios to meet the burgeoning demand. Competitive pressures continue to drive innovation in ingredient formulation and delivery systems, including novel encapsulation techniques.
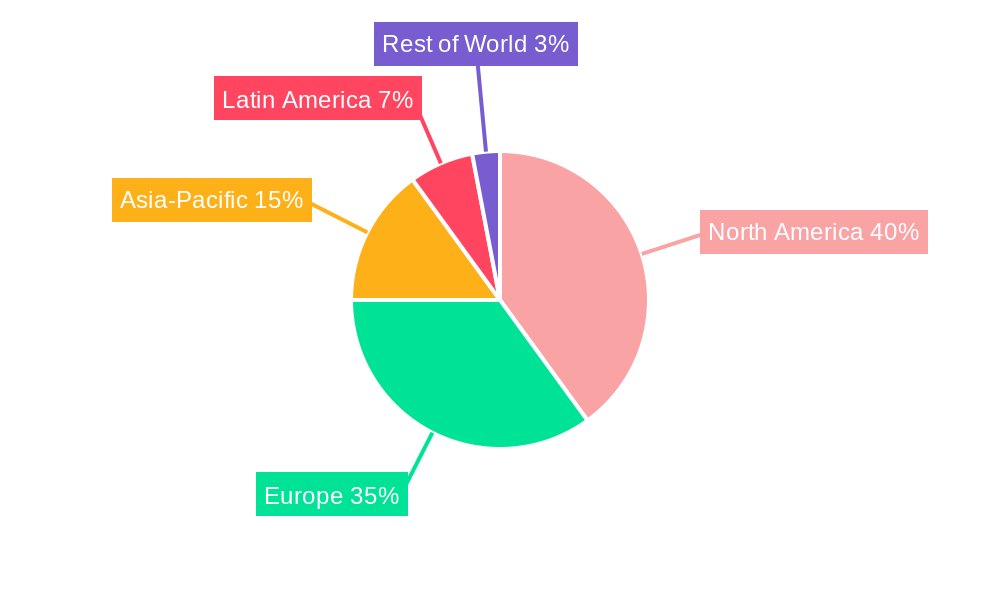
The projected Compound Annual Growth Rate (CAGR) of 7.51% from 2025 to 2033 indicates substantial expansion. While specific regional data is unavailable, it's reasonable to assume a significant market share for North America and Europe, given their established health and wellness industries and higher per capita consumption. However, emerging markets in Asia-Pacific and Latin America represent significant growth opportunities, fueled by rising disposable incomes and increasing awareness of the importance of dietary health. Despite promising prospects, challenges remain; including potential supply chain disruptions and fluctuating raw material costs, which can impact price stability. Nevertheless, the long-term outlook for the EPA/DHA ingredients market remains positive, largely driven by the continuously expanding consumer base seeking natural ways to enhance their health and well-being.
EPA/DHA Ingredients Industry Market Report: 2019-2033
This comprehensive report provides an in-depth analysis of the global EPA/DHA ingredients market, offering valuable insights for stakeholders across the value chain. With a study period spanning 2019-2033, a base year of 2025, and a forecast period of 2025-2033, this report meticulously examines market trends, competitive dynamics, and future growth potential. The market is projected to reach xx Million by 2033, exhibiting a robust CAGR of xx% during the forecast period.
EPA/DHA Ingredients Industry Market Composition & Trends
This section analyzes the market's competitive landscape, focusing on market concentration, innovation drivers, regulatory influences, substitute products, end-user profiles, and mergers & acquisitions (M&A) activities. The global EPA/DHA ingredients market is moderately concentrated, with key players holding significant market share. However, the entry of new players and innovative products is constantly reshaping the competitive landscape.
Market Share Distribution (2024 Estimate): Koninklijke DSM NV holds approximately xx% market share, followed by KD Pharma Group with xx%, Archer Daniels Midland Company with xx%, and other players accounting for the remaining xx%. These figures are estimates based on available data and may vary slightly.
M&A Activity: The industry has witnessed several significant M&A deals in recent years, with deal values exceeding xx Million in the past five years. These transactions reflect the strategic focus on expanding product portfolios and market reach.
Innovation Catalysts: Growing consumer awareness of the health benefits of EPA and DHA, coupled with advancements in extraction and purification technologies, are key drivers of innovation.
Regulatory Landscape: Stringent regulations regarding food safety and labeling significantly influence market dynamics, impacting product development and marketing strategies.
Substitute Products: Plant-based alternatives to EPA and DHA are emerging, posing a potential challenge to the market's growth trajectory.
End-User Profiles: The primary end-users are the nutraceutical, food, and pharmaceutical industries, with growing demand from dietary supplements and functional food segments.
EPA/DHA Ingredients Industry Industry Evolution
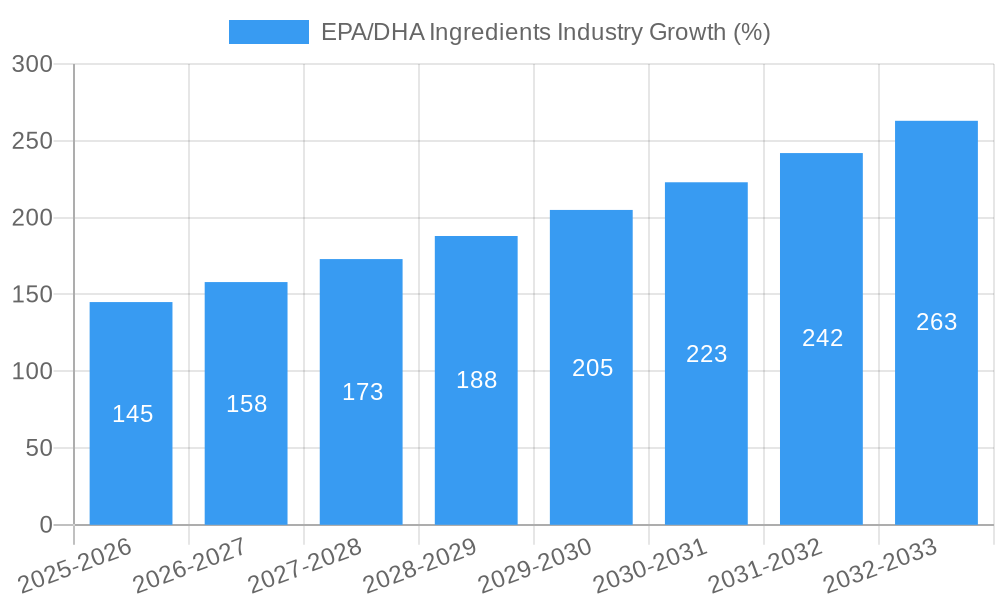
The EPA/DHA ingredients market has witnessed significant evolution over the past five years, driven by several factors. The market experienced a notable growth rate of xx% from 2019 to 2024, fueled by increasing consumer demand for omega-3 fatty acids and the development of innovative products. This growth is expected to continue, albeit at a slightly moderated pace, during the forecast period. Technological advancements in extraction methods, such as supercritical CO2 extraction, have significantly improved the quality and yield of EPA and DHA, enabling the production of high-quality, highly concentrated ingredients. Simultaneously, consumer preferences are shifting towards sustainable and ethically sourced products, placing pressure on manufacturers to adopt responsible sourcing practices. The adoption rate of sustainable sourcing practices among major players is estimated at approximately xx% as of 2024.
Leading Regions, Countries, or Segments in EPA/DHA Ingredients Industry
North America currently dominates the global EPA/DHA ingredients market, driven primarily by high consumer awareness of omega-3 benefits and strong regulatory support for the nutraceutical industry. The region's robust economy and high disposable incomes also contribute to its market leadership.
- Key Drivers for North American Dominance:
- High consumer demand for omega-3 supplements.
- Strong regulatory framework supporting the nutraceutical industry.
- Significant investments in research and development.
- High disposable incomes and health-conscious population.
- Established distribution networks.
Europe and Asia-Pacific are also significant markets, exhibiting strong growth potential. However, challenges such as stringent regulations in Europe and varying consumer awareness levels in Asia-Pacific are factors that need consideration.
EPA/DHA Ingredients Industry Product Innovations
Recent innovations focus on enhancing product purity, potency, and bioavailability. The development of ultra-concentrated EPA/DHA oils and innovative delivery systems (e.g., gummies, liposomal formulations) are improving consumer acceptance and efficacy. New product formulations incorporating EPA and DHA along with other beneficial nutrients (like the recent EPAX Omega 3-9-11 launch) are further enhancing their market appeal.
Propelling Factors for EPA/DHA Ingredients Industry Growth
Several factors are driving the growth of the EPA/DHA ingredients market. These include rising consumer awareness of the health benefits of EPA and DHA, increasing demand for functional foods and dietary supplements, advancements in extraction and purification technologies enabling the production of higher-quality products, and favorable regulatory frameworks supporting the use of EPA/DHA in various applications.
Obstacles in the EPA/DHA Ingredients Industry Market
The market faces challenges such as fluctuating raw material prices, potential supply chain disruptions from environmental factors (e.g., overfishing), intense competition, and the emergence of plant-based alternatives. Regulatory changes and evolving consumer preferences also represent ongoing challenges. For example, the impact of potential supply chain disruptions is estimated to be approximately xx Million in annual revenue loss during periods of significant disruptions.
Future Opportunities in EPA/DHA Ingredients Industry
Future opportunities lie in expanding into new markets, particularly in developing economies, developing innovative delivery systems and formulations, and focusing on sustainable and ethically sourced raw materials. Growing research into the specific health benefits of EPA and DHA is likely to further propel market expansion.
Major Players in the EPA/DHA Ingredients Industry Ecosystem
- Koninklijke DSM NV (Koninklijke DSM NV)
- KD Pharma Group
- The Archer Daniels Midland Company (The Archer Daniels Midland Company)
- Corbion NV (Corbion NV)
- Novasep Holding SAS (Novasep Holding SAS)
- Neptune Wellness Solutions (Neptune Wellness Solutions)
- BASF SE (BASF SE)
- Omega Protein Corporation (Omega Protein Corporation)
- Croda International PLC (Croda International PLC)
- Novotech Nutraceuticals
- List Not Exhaustive
Key Developments in EPA/DHA Ingredients Industry Industry
March 2024: DSM-Firmenich partnered with SCN BestCo to launch omega-3 gummies with EPA and DHA ingredients. This strategic collaboration expands the reach of EPA/DHA into the growing gummy supplement market.
March 2024: Epax, a subsidiary of Pelagia AS, invested USD 40 Million in a state-of-the-art distillation facility for ultra-concentrated omega-3 production. This investment signifies a commitment to enhancing product quality and efficiency.
February 2024: Epax launched EPAX Omega 3-9-11, a full-spectrum oil with potential for skin health supplements. This product diversification expands the applications of EPA and DHA beyond traditional heart and brain health benefits.
Strategic EPA/DHA Ingredients Industry Market Forecast
The EPA/DHA ingredients market is poised for continued growth, driven by sustained consumer demand, ongoing product innovation, and expansion into new geographic markets. Emerging applications in areas like skin health and cognitive enhancement are expected to further propel market expansion. The market's future success will depend on the industry's ability to address sustainability challenges, maintain product quality, and meet evolving consumer expectations.
EPA/DHA Ingredients Industry Segmentation
-
1. Type
- 1.1. Eicosapentaenoic Acid (EPA)
- 1.2. Docosahexaenoic Acid (DHA)
-
2. Source
- 2.1. Fish Oil
- 2.2. Algae Oil
- 2.3. Krill Oil
- 2.4. Other Sources
-
3. Application
- 3.1. Infant Formulae
- 3.2. Dietary Supplements
- 3.3. Fortified Food and Beverages
- 3.4. Pharmaceuticals
- 3.5. Other Applications
EPA/DHA Ingredients Industry Segmentation By Geography
-
1. North America
- 1.1. United States
- 1.2. Mexico
- 1.3. Canada
- 1.4. Rest of North America
-
2. Europe
- 2.1. Spain
- 2.2. United Kingdom
- 2.3. Germany
- 2.4. France
- 2.5. Russia
- 2.6. Italy
- 2.7. Rest of Europe
-
3. Asia Pacific
- 3.1. China
- 3.2. Japan
- 3.3. India
- 3.4. Australia
- 3.5. Rest of Asia Pacific
-
4. South America
- 4.1. Brazil
- 4.2. Argentina
- 4.3. Rest of South America
-
5. Middle East and Africa
- 5.1. United Arab Emirates
- 5.2. South Africa
- 5.3. Rest of Middle East and Africa
EPA/DHA Ingredients Industry REPORT HIGHLIGHTS
| Aspects | Details |
|---|---|
| Study Period | 2019-2033 |
| Base Year | 2024 |
| Estimated Year | 2025 |
| Forecast Period | 2025-2033 |
| Historical Period | 2019-2024 |
| Growth Rate | CAGR of 7.51% from 2019-2033 |
| Segmentation |
|
Table of Contents
- 1. Introduction
- 1.1. Research Scope
- 1.2. Market Segmentation
- 1.3. Research Methodology
- 1.4. Definitions and Assumptions
- 2. Executive Summary
- 2.1. Introduction
- 3. Market Dynamics
- 3.1. Introduction
- 3.2. Market Drivers
- 3.2.1. Increasing Awareness Of Health Benefits Associated With EPA And DHA; Demand for Concentrated Forms of Omega 3
- 3.3. Market Restrains
- 3.3.1. Increasing Awareness Of Health Benefits Associated With EPA And DHA; Demand for Concentrated Forms of Omega 3
- 3.4. Market Trends
- 3.4.1. Increasing Awareness Of Health Benefits Associated With EPA And DHA
- 4. Market Factor Analysis
- 4.1. Porters Five Forces
- 4.2. Supply/Value Chain
- 4.3. PESTEL analysis
- 4.4. Market Entropy
- 4.5. Patent/Trademark Analysis
- 5. Global EPA/DHA Ingredients Industry Analysis, Insights and Forecast, 2019-2031
- 5.1. Market Analysis, Insights and Forecast - by Type
- 5.1.1. Eicosapentaenoic Acid (EPA)
- 5.1.2. Docosahexaenoic Acid (DHA)
- 5.2. Market Analysis, Insights and Forecast - by Source
- 5.2.1. Fish Oil
- 5.2.2. Algae Oil
- 5.2.3. Krill Oil
- 5.2.4. Other Sources
- 5.3. Market Analysis, Insights and Forecast - by Application
- 5.3.1. Infant Formulae
- 5.3.2. Dietary Supplements
- 5.3.3. Fortified Food and Beverages
- 5.3.4. Pharmaceuticals
- 5.3.5. Other Applications
- 5.4. Market Analysis, Insights and Forecast - by Region
- 5.4.1. North America
- 5.4.2. Europe
- 5.4.3. Asia Pacific
- 5.4.4. South America
- 5.4.5. Middle East and Africa
- 5.1. Market Analysis, Insights and Forecast - by Type
- 6. North America EPA/DHA Ingredients Industry Analysis, Insights and Forecast, 2019-2031
- 6.1. Market Analysis, Insights and Forecast - by Type
- 6.1.1. Eicosapentaenoic Acid (EPA)
- 6.1.2. Docosahexaenoic Acid (DHA)
- 6.2. Market Analysis, Insights and Forecast - by Source
- 6.2.1. Fish Oil
- 6.2.2. Algae Oil
- 6.2.3. Krill Oil
- 6.2.4. Other Sources
- 6.3. Market Analysis, Insights and Forecast - by Application
- 6.3.1. Infant Formulae
- 6.3.2. Dietary Supplements
- 6.3.3. Fortified Food and Beverages
- 6.3.4. Pharmaceuticals
- 6.3.5. Other Applications
- 6.1. Market Analysis, Insights and Forecast - by Type
- 7. Europe EPA/DHA Ingredients Industry Analysis, Insights and Forecast, 2019-2031
- 7.1. Market Analysis, Insights and Forecast - by Type
- 7.1.1. Eicosapentaenoic Acid (EPA)
- 7.1.2. Docosahexaenoic Acid (DHA)
- 7.2. Market Analysis, Insights and Forecast - by Source
- 7.2.1. Fish Oil
- 7.2.2. Algae Oil
- 7.2.3. Krill Oil
- 7.2.4. Other Sources
- 7.3. Market Analysis, Insights and Forecast - by Application
- 7.3.1. Infant Formulae
- 7.3.2. Dietary Supplements
- 7.3.3. Fortified Food and Beverages
- 7.3.4. Pharmaceuticals
- 7.3.5. Other Applications
- 7.1. Market Analysis, Insights and Forecast - by Type
- 8. Asia Pacific EPA/DHA Ingredients Industry Analysis, Insights and Forecast, 2019-2031
- 8.1. Market Analysis, Insights and Forecast - by Type
- 8.1.1. Eicosapentaenoic Acid (EPA)
- 8.1.2. Docosahexaenoic Acid (DHA)
- 8.2. Market Analysis, Insights and Forecast - by Source
- 8.2.1. Fish Oil
- 8.2.2. Algae Oil
- 8.2.3. Krill Oil
- 8.2.4. Other Sources
- 8.3. Market Analysis, Insights and Forecast - by Application
- 8.3.1. Infant Formulae
- 8.3.2. Dietary Supplements
- 8.3.3. Fortified Food and Beverages
- 8.3.4. Pharmaceuticals
- 8.3.5. Other Applications
- 8.1. Market Analysis, Insights and Forecast - by Type
- 9. South America EPA/DHA Ingredients Industry Analysis, Insights and Forecast, 2019-2031
- 9.1. Market Analysis, Insights and Forecast - by Type
- 9.1.1. Eicosapentaenoic Acid (EPA)
- 9.1.2. Docosahexaenoic Acid (DHA)
- 9.2. Market Analysis, Insights and Forecast - by Source
- 9.2.1. Fish Oil
- 9.2.2. Algae Oil
- 9.2.3. Krill Oil
- 9.2.4. Other Sources
- 9.3. Market Analysis, Insights and Forecast - by Application
- 9.3.1. Infant Formulae
- 9.3.2. Dietary Supplements
- 9.3.3. Fortified Food and Beverages
- 9.3.4. Pharmaceuticals
- 9.3.5. Other Applications
- 9.1. Market Analysis, Insights and Forecast - by Type
- 10. Middle East and Africa EPA/DHA Ingredients Industry Analysis, Insights and Forecast, 2019-2031
- 10.1. Market Analysis, Insights and Forecast - by Type
- 10.1.1. Eicosapentaenoic Acid (EPA)
- 10.1.2. Docosahexaenoic Acid (DHA)
- 10.2. Market Analysis, Insights and Forecast - by Source
- 10.2.1. Fish Oil
- 10.2.2. Algae Oil
- 10.2.3. Krill Oil
- 10.2.4. Other Sources
- 10.3. Market Analysis, Insights and Forecast - by Application
- 10.3.1. Infant Formulae
- 10.3.2. Dietary Supplements
- 10.3.3. Fortified Food and Beverages
- 10.3.4. Pharmaceuticals
- 10.3.5. Other Applications
- 10.1. Market Analysis, Insights and Forecast - by Type
- 11. Competitive Analysis
- 11.1. Global Market Share Analysis 2024
- 11.2. Company Profiles
- 11.2.1 Koninklijke DSM NV
- 11.2.1.1. Overview
- 11.2.1.2. Products
- 11.2.1.3. SWOT Analysis
- 11.2.1.4. Recent Developments
- 11.2.1.5. Financials (Based on Availability)
- 11.2.2 KD Pharma Group
- 11.2.2.1. Overview
- 11.2.2.2. Products
- 11.2.2.3. SWOT Analysis
- 11.2.2.4. Recent Developments
- 11.2.2.5. Financials (Based on Availability)
- 11.2.3 The Archer Daniels Midland Company
- 11.2.3.1. Overview
- 11.2.3.2. Products
- 11.2.3.3. SWOT Analysis
- 11.2.3.4. Recent Developments
- 11.2.3.5. Financials (Based on Availability)
- 11.2.4 Corbion NV
- 11.2.4.1. Overview
- 11.2.4.2. Products
- 11.2.4.3. SWOT Analysis
- 11.2.4.4. Recent Developments
- 11.2.4.5. Financials (Based on Availability)
- 11.2.5 Novasep Holding SAS
- 11.2.5.1. Overview
- 11.2.5.2. Products
- 11.2.5.3. SWOT Analysis
- 11.2.5.4. Recent Developments
- 11.2.5.5. Financials (Based on Availability)
- 11.2.6 Neptune Wellness Solutions
- 11.2.6.1. Overview
- 11.2.6.2. Products
- 11.2.6.3. SWOT Analysis
- 11.2.6.4. Recent Developments
- 11.2.6.5. Financials (Based on Availability)
- 11.2.7 BASF SE
- 11.2.7.1. Overview
- 11.2.7.2. Products
- 11.2.7.3. SWOT Analysis
- 11.2.7.4. Recent Developments
- 11.2.7.5. Financials (Based on Availability)
- 11.2.8 Omega Protein Corporation
- 11.2.8.1. Overview
- 11.2.8.2. Products
- 11.2.8.3. SWOT Analysis
- 11.2.8.4. Recent Developments
- 11.2.8.5. Financials (Based on Availability)
- 11.2.9 Croda International PLC
- 11.2.9.1. Overview
- 11.2.9.2. Products
- 11.2.9.3. SWOT Analysis
- 11.2.9.4. Recent Developments
- 11.2.9.5. Financials (Based on Availability)
- 11.2.10 Novotech Nutraceuticals*List Not Exhaustive
- 11.2.10.1. Overview
- 11.2.10.2. Products
- 11.2.10.3. SWOT Analysis
- 11.2.10.4. Recent Developments
- 11.2.10.5. Financials (Based on Availability)
- 11.2.1 Koninklijke DSM NV
List of Figures
- Figure 1: Global EPA/DHA Ingredients Industry Revenue Breakdown (Million, %) by Region 2024 & 2032
- Figure 2: Global EPA/DHA Ingredients Industry Volume Breakdown (Billion, %) by Region 2024 & 2032
- Figure 3: North America EPA/DHA Ingredients Industry Revenue (Million), by Type 2024 & 2032
- Figure 4: North America EPA/DHA Ingredients Industry Volume (Billion), by Type 2024 & 2032
- Figure 5: North America EPA/DHA Ingredients Industry Revenue Share (%), by Type 2024 & 2032
- Figure 6: North America EPA/DHA Ingredients Industry Volume Share (%), by Type 2024 & 2032
- Figure 7: North America EPA/DHA Ingredients Industry Revenue (Million), by Source 2024 & 2032
- Figure 8: North America EPA/DHA Ingredients Industry Volume (Billion), by Source 2024 & 2032
- Figure 9: North America EPA/DHA Ingredients Industry Revenue Share (%), by Source 2024 & 2032
- Figure 10: North America EPA/DHA Ingredients Industry Volume Share (%), by Source 2024 & 2032
- Figure 11: North America EPA/DHA Ingredients Industry Revenue (Million), by Application 2024 & 2032
- Figure 12: North America EPA/DHA Ingredients Industry Volume (Billion), by Application 2024 & 2032
- Figure 13: North America EPA/DHA Ingredients Industry Revenue Share (%), by Application 2024 & 2032
- Figure 14: North America EPA/DHA Ingredients Industry Volume Share (%), by Application 2024 & 2032
- Figure 15: North America EPA/DHA Ingredients Industry Revenue (Million), by Country 2024 & 2032
- Figure 16: North America EPA/DHA Ingredients Industry Volume (Billion), by Country 2024 & 2032
- Figure 17: North America EPA/DHA Ingredients Industry Revenue Share (%), by Country 2024 & 2032
- Figure 18: North America EPA/DHA Ingredients Industry Volume Share (%), by Country 2024 & 2032
- Figure 19: Europe EPA/DHA Ingredients Industry Revenue (Million), by Type 2024 & 2032
- Figure 20: Europe EPA/DHA Ingredients Industry Volume (Billion), by Type 2024 & 2032
- Figure 21: Europe EPA/DHA Ingredients Industry Revenue Share (%), by Type 2024 & 2032
- Figure 22: Europe EPA/DHA Ingredients Industry Volume Share (%), by Type 2024 & 2032
- Figure 23: Europe EPA/DHA Ingredients Industry Revenue (Million), by Source 2024 & 2032
- Figure 24: Europe EPA/DHA Ingredients Industry Volume (Billion), by Source 2024 & 2032
- Figure 25: Europe EPA/DHA Ingredients Industry Revenue Share (%), by Source 2024 & 2032
- Figure 26: Europe EPA/DHA Ingredients Industry Volume Share (%), by Source 2024 & 2032
- Figure 27: Europe EPA/DHA Ingredients Industry Revenue (Million), by Application 2024 & 2032
- Figure 28: Europe EPA/DHA Ingredients Industry Volume (Billion), by Application 2024 & 2032
- Figure 29: Europe EPA/DHA Ingredients Industry Revenue Share (%), by Application 2024 & 2032
- Figure 30: Europe EPA/DHA Ingredients Industry Volume Share (%), by Application 2024 & 2032
- Figure 31: Europe EPA/DHA Ingredients Industry Revenue (Million), by Country 2024 & 2032
- Figure 32: Europe EPA/DHA Ingredients Industry Volume (Billion), by Country 2024 & 2032
- Figure 33: Europe EPA/DHA Ingredients Industry Revenue Share (%), by Country 2024 & 2032
- Figure 34: Europe EPA/DHA Ingredients Industry Volume Share (%), by Country 2024 & 2032
- Figure 35: Asia Pacific EPA/DHA Ingredients Industry Revenue (Million), by Type 2024 & 2032
- Figure 36: Asia Pacific EPA/DHA Ingredients Industry Volume (Billion), by Type 2024 & 2032
- Figure 37: Asia Pacific EPA/DHA Ingredients Industry Revenue Share (%), by Type 2024 & 2032
- Figure 38: Asia Pacific EPA/DHA Ingredients Industry Volume Share (%), by Type 2024 & 2032
- Figure 39: Asia Pacific EPA/DHA Ingredients Industry Revenue (Million), by Source 2024 & 2032
- Figure 40: Asia Pacific EPA/DHA Ingredients Industry Volume (Billion), by Source 2024 & 2032
- Figure 41: Asia Pacific EPA/DHA Ingredients Industry Revenue Share (%), by Source 2024 & 2032
- Figure 42: Asia Pacific EPA/DHA Ingredients Industry Volume Share (%), by Source 2024 & 2032
- Figure 43: Asia Pacific EPA/DHA Ingredients Industry Revenue (Million), by Application 2024 & 2032
- Figure 44: Asia Pacific EPA/DHA Ingredients Industry Volume (Billion), by Application 2024 & 2032
- Figure 45: Asia Pacific EPA/DHA Ingredients Industry Revenue Share (%), by Application 2024 & 2032
- Figure 46: Asia Pacific EPA/DHA Ingredients Industry Volume Share (%), by Application 2024 & 2032
- Figure 47: Asia Pacific EPA/DHA Ingredients Industry Revenue (Million), by Country 2024 & 2032
- Figure 48: Asia Pacific EPA/DHA Ingredients Industry Volume (Billion), by Country 2024 & 2032
- Figure 49: Asia Pacific EPA/DHA Ingredients Industry Revenue Share (%), by Country 2024 & 2032
- Figure 50: Asia Pacific EPA/DHA Ingredients Industry Volume Share (%), by Country 2024 & 2032
- Figure 51: South America EPA/DHA Ingredients Industry Revenue (Million), by Type 2024 & 2032
- Figure 52: South America EPA/DHA Ingredients Industry Volume (Billion), by Type 2024 & 2032
- Figure 53: South America EPA/DHA Ingredients Industry Revenue Share (%), by Type 2024 & 2032
- Figure 54: South America EPA/DHA Ingredients Industry Volume Share (%), by Type 2024 & 2032
- Figure 55: South America EPA/DHA Ingredients Industry Revenue (Million), by Source 2024 & 2032
- Figure 56: South America EPA/DHA Ingredients Industry Volume (Billion), by Source 2024 & 2032
- Figure 57: South America EPA/DHA Ingredients Industry Revenue Share (%), by Source 2024 & 2032
- Figure 58: South America EPA/DHA Ingredients Industry Volume Share (%), by Source 2024 & 2032
- Figure 59: South America EPA/DHA Ingredients Industry Revenue (Million), by Application 2024 & 2032
- Figure 60: South America EPA/DHA Ingredients Industry Volume (Billion), by Application 2024 & 2032
- Figure 61: South America EPA/DHA Ingredients Industry Revenue Share (%), by Application 2024 & 2032
- Figure 62: South America EPA/DHA Ingredients Industry Volume Share (%), by Application 2024 & 2032
- Figure 63: South America EPA/DHA Ingredients Industry Revenue (Million), by Country 2024 & 2032
- Figure 64: South America EPA/DHA Ingredients Industry Volume (Billion), by Country 2024 & 2032
- Figure 65: South America EPA/DHA Ingredients Industry Revenue Share (%), by Country 2024 & 2032
- Figure 66: South America EPA/DHA Ingredients Industry Volume Share (%), by Country 2024 & 2032
- Figure 67: Middle East and Africa EPA/DHA Ingredients Industry Revenue (Million), by Type 2024 & 2032
- Figure 68: Middle East and Africa EPA/DHA Ingredients Industry Volume (Billion), by Type 2024 & 2032
- Figure 69: Middle East and Africa EPA/DHA Ingredients Industry Revenue Share (%), by Type 2024 & 2032
- Figure 70: Middle East and Africa EPA/DHA Ingredients Industry Volume Share (%), by Type 2024 & 2032
- Figure 71: Middle East and Africa EPA/DHA Ingredients Industry Revenue (Million), by Source 2024 & 2032
- Figure 72: Middle East and Africa EPA/DHA Ingredients Industry Volume (Billion), by Source 2024 & 2032
- Figure 73: Middle East and Africa EPA/DHA Ingredients Industry Revenue Share (%), by Source 2024 & 2032
- Figure 74: Middle East and Africa EPA/DHA Ingredients Industry Volume Share (%), by Source 2024 & 2032
- Figure 75: Middle East and Africa EPA/DHA Ingredients Industry Revenue (Million), by Application 2024 & 2032
- Figure 76: Middle East and Africa EPA/DHA Ingredients Industry Volume (Billion), by Application 2024 & 2032
- Figure 77: Middle East and Africa EPA/DHA Ingredients Industry Revenue Share (%), by Application 2024 & 2032
- Figure 78: Middle East and Africa EPA/DHA Ingredients Industry Volume Share (%), by Application 2024 & 2032
- Figure 79: Middle East and Africa EPA/DHA Ingredients Industry Revenue (Million), by Country 2024 & 2032
- Figure 80: Middle East and Africa EPA/DHA Ingredients Industry Volume (Billion), by Country 2024 & 2032
- Figure 81: Middle East and Africa EPA/DHA Ingredients Industry Revenue Share (%), by Country 2024 & 2032
- Figure 82: Middle East and Africa EPA/DHA Ingredients Industry Volume Share (%), by Country 2024 & 2032
List of Tables
- Table 1: Global EPA/DHA Ingredients Industry Revenue Million Forecast, by Region 2019 & 2032
- Table 2: Global EPA/DHA Ingredients Industry Volume Billion Forecast, by Region 2019 & 2032
- Table 3: Global EPA/DHA Ingredients Industry Revenue Million Forecast, by Type 2019 & 2032
- Table 4: Global EPA/DHA Ingredients Industry Volume Billion Forecast, by Type 2019 & 2032
- Table 5: Global EPA/DHA Ingredients Industry Revenue Million Forecast, by Source 2019 & 2032
- Table 6: Global EPA/DHA Ingredients Industry Volume Billion Forecast, by Source 2019 & 2032
- Table 7: Global EPA/DHA Ingredients Industry Revenue Million Forecast, by Application 2019 & 2032
- Table 8: Global EPA/DHA Ingredients Industry Volume Billion Forecast, by Application 2019 & 2032
- Table 9: Global EPA/DHA Ingredients Industry Revenue Million Forecast, by Region 2019 & 2032
- Table 10: Global EPA/DHA Ingredients Industry Volume Billion Forecast, by Region 2019 & 2032
- Table 11: Global EPA/DHA Ingredients Industry Revenue Million Forecast, by Type 2019 & 2032
- Table 12: Global EPA/DHA Ingredients Industry Volume Billion Forecast, by Type 2019 & 2032
- Table 13: Global EPA/DHA Ingredients Industry Revenue Million Forecast, by Source 2019 & 2032
- Table 14: Global EPA/DHA Ingredients Industry Volume Billion Forecast, by Source 2019 & 2032
- Table 15: Global EPA/DHA Ingredients Industry Revenue Million Forecast, by Application 2019 & 2032
- Table 16: Global EPA/DHA Ingredients Industry Volume Billion Forecast, by Application 2019 & 2032
- Table 17: Global EPA/DHA Ingredients Industry Revenue Million Forecast, by Country 2019 & 2032
- Table 18: Global EPA/DHA Ingredients Industry Volume Billion Forecast, by Country 2019 & 2032
- Table 19: United States EPA/DHA Ingredients Industry Revenue (Million) Forecast, by Application 2019 & 2032
- Table 20: United States EPA/DHA Ingredients Industry Volume (Billion) Forecast, by Application 2019 & 2032
- Table 21: Mexico EPA/DHA Ingredients Industry Revenue (Million) Forecast, by Application 2019 & 2032
- Table 22: Mexico EPA/DHA Ingredients Industry Volume (Billion) Forecast, by Application 2019 & 2032
- Table 23: Canada EPA/DHA Ingredients Industry Revenue (Million) Forecast, by Application 2019 & 2032
- Table 24: Canada EPA/DHA Ingredients Industry Volume (Billion) Forecast, by Application 2019 & 2032
- Table 25: Rest of North America EPA/DHA Ingredients Industry Revenue (Million) Forecast, by Application 2019 & 2032
- Table 26: Rest of North America EPA/DHA Ingredients Industry Volume (Billion) Forecast, by Application 2019 & 2032
- Table 27: Global EPA/DHA Ingredients Industry Revenue Million Forecast, by Type 2019 & 2032
- Table 28: Global EPA/DHA Ingredients Industry Volume Billion Forecast, by Type 2019 & 2032
- Table 29: Global EPA/DHA Ingredients Industry Revenue Million Forecast, by Source 2019 & 2032
- Table 30: Global EPA/DHA Ingredients Industry Volume Billion Forecast, by Source 2019 & 2032
- Table 31: Global EPA/DHA Ingredients Industry Revenue Million Forecast, by Application 2019 & 2032
- Table 32: Global EPA/DHA Ingredients Industry Volume Billion Forecast, by Application 2019 & 2032
- Table 33: Global EPA/DHA Ingredients Industry Revenue Million Forecast, by Country 2019 & 2032
- Table 34: Global EPA/DHA Ingredients Industry Volume Billion Forecast, by Country 2019 & 2032
- Table 35: Spain EPA/DHA Ingredients Industry Revenue (Million) Forecast, by Application 2019 & 2032
- Table 36: Spain EPA/DHA Ingredients Industry Volume (Billion) Forecast, by Application 2019 & 2032
- Table 37: United Kingdom EPA/DHA Ingredients Industry Revenue (Million) Forecast, by Application 2019 & 2032
- Table 38: United Kingdom EPA/DHA Ingredients Industry Volume (Billion) Forecast, by Application 2019 & 2032
- Table 39: Germany EPA/DHA Ingredients Industry Revenue (Million) Forecast, by Application 2019 & 2032
- Table 40: Germany EPA/DHA Ingredients Industry Volume (Billion) Forecast, by Application 2019 & 2032
- Table 41: France EPA/DHA Ingredients Industry Revenue (Million) Forecast, by Application 2019 & 2032
- Table 42: France EPA/DHA Ingredients Industry Volume (Billion) Forecast, by Application 2019 & 2032
- Table 43: Russia EPA/DHA Ingredients Industry Revenue (Million) Forecast, by Application 2019 & 2032
- Table 44: Russia EPA/DHA Ingredients Industry Volume (Billion) Forecast, by Application 2019 & 2032
- Table 45: Italy EPA/DHA Ingredients Industry Revenue (Million) Forecast, by Application 2019 & 2032
- Table 46: Italy EPA/DHA Ingredients Industry Volume (Billion) Forecast, by Application 2019 & 2032
- Table 47: Rest of Europe EPA/DHA Ingredients Industry Revenue (Million) Forecast, by Application 2019 & 2032
- Table 48: Rest of Europe EPA/DHA Ingredients Industry Volume (Billion) Forecast, by Application 2019 & 2032
- Table 49: Global EPA/DHA Ingredients Industry Revenue Million Forecast, by Type 2019 & 2032
- Table 50: Global EPA/DHA Ingredients Industry Volume Billion Forecast, by Type 2019 & 2032
- Table 51: Global EPA/DHA Ingredients Industry Revenue Million Forecast, by Source 2019 & 2032
- Table 52: Global EPA/DHA Ingredients Industry Volume Billion Forecast, by Source 2019 & 2032
- Table 53: Global EPA/DHA Ingredients Industry Revenue Million Forecast, by Application 2019 & 2032
- Table 54: Global EPA/DHA Ingredients Industry Volume Billion Forecast, by Application 2019 & 2032
- Table 55: Global EPA/DHA Ingredients Industry Revenue Million Forecast, by Country 2019 & 2032
- Table 56: Global EPA/DHA Ingredients Industry Volume Billion Forecast, by Country 2019 & 2032
- Table 57: China EPA/DHA Ingredients Industry Revenue (Million) Forecast, by Application 2019 & 2032
- Table 58: China EPA/DHA Ingredients Industry Volume (Billion) Forecast, by Application 2019 & 2032
- Table 59: Japan EPA/DHA Ingredients Industry Revenue (Million) Forecast, by Application 2019 & 2032
- Table 60: Japan EPA/DHA Ingredients Industry Volume (Billion) Forecast, by Application 2019 & 2032
- Table 61: India EPA/DHA Ingredients Industry Revenue (Million) Forecast, by Application 2019 & 2032
- Table 62: India EPA/DHA Ingredients Industry Volume (Billion) Forecast, by Application 2019 & 2032
- Table 63: Australia EPA/DHA Ingredients Industry Revenue (Million) Forecast, by Application 2019 & 2032
- Table 64: Australia EPA/DHA Ingredients Industry Volume (Billion) Forecast, by Application 2019 & 2032
- Table 65: Rest of Asia Pacific EPA/DHA Ingredients Industry Revenue (Million) Forecast, by Application 2019 & 2032
- Table 66: Rest of Asia Pacific EPA/DHA Ingredients Industry Volume (Billion) Forecast, by Application 2019 & 2032
- Table 67: Global EPA/DHA Ingredients Industry Revenue Million Forecast, by Type 2019 & 2032
- Table 68: Global EPA/DHA Ingredients Industry Volume Billion Forecast, by Type 2019 & 2032
- Table 69: Global EPA/DHA Ingredients Industry Revenue Million Forecast, by Source 2019 & 2032
- Table 70: Global EPA/DHA Ingredients Industry Volume Billion Forecast, by Source 2019 & 2032
- Table 71: Global EPA/DHA Ingredients Industry Revenue Million Forecast, by Application 2019 & 2032
- Table 72: Global EPA/DHA Ingredients Industry Volume Billion Forecast, by Application 2019 & 2032
- Table 73: Global EPA/DHA Ingredients Industry Revenue Million Forecast, by Country 2019 & 2032
- Table 74: Global EPA/DHA Ingredients Industry Volume Billion Forecast, by Country 2019 & 2032
- Table 75: Brazil EPA/DHA Ingredients Industry Revenue (Million) Forecast, by Application 2019 & 2032
- Table 76: Brazil EPA/DHA Ingredients Industry Volume (Billion) Forecast, by Application 2019 & 2032
- Table 77: Argentina EPA/DHA Ingredients Industry Revenue (Million) Forecast, by Application 2019 & 2032
- Table 78: Argentina EPA/DHA Ingredients Industry Volume (Billion) Forecast, by Application 2019 & 2032
- Table 79: Rest of South America EPA/DHA Ingredients Industry Revenue (Million) Forecast, by Application 2019 & 2032
- Table 80: Rest of South America EPA/DHA Ingredients Industry Volume (Billion) Forecast, by Application 2019 & 2032
- Table 81: Global EPA/DHA Ingredients Industry Revenue Million Forecast, by Type 2019 & 2032
- Table 82: Global EPA/DHA Ingredients Industry Volume Billion Forecast, by Type 2019 & 2032
- Table 83: Global EPA/DHA Ingredients Industry Revenue Million Forecast, by Source 2019 & 2032
- Table 84: Global EPA/DHA Ingredients Industry Volume Billion Forecast, by Source 2019 & 2032
- Table 85: Global EPA/DHA Ingredients Industry Revenue Million Forecast, by Application 2019 & 2032
- Table 86: Global EPA/DHA Ingredients Industry Volume Billion Forecast, by Application 2019 & 2032
- Table 87: Global EPA/DHA Ingredients Industry Revenue Million Forecast, by Country 2019 & 2032
- Table 88: Global EPA/DHA Ingredients Industry Volume Billion Forecast, by Country 2019 & 2032
- Table 89: United Arab Emirates EPA/DHA Ingredients Industry Revenue (Million) Forecast, by Application 2019 & 2032
- Table 90: United Arab Emirates EPA/DHA Ingredients Industry Volume (Billion) Forecast, by Application 2019 & 2032
- Table 91: South Africa EPA/DHA Ingredients Industry Revenue (Million) Forecast, by Application 2019 & 2032
- Table 92: South Africa EPA/DHA Ingredients Industry Volume (Billion) Forecast, by Application 2019 & 2032
- Table 93: Rest of Middle East and Africa EPA/DHA Ingredients Industry Revenue (Million) Forecast, by Application 2019 & 2032
- Table 94: Rest of Middle East and Africa EPA/DHA Ingredients Industry Volume (Billion) Forecast, by Application 2019 & 2032
Frequently Asked Questions
1. What is the projected Compound Annual Growth Rate (CAGR) of the EPA/DHA Ingredients Industry?
The projected CAGR is approximately 7.51%.
2. Which companies are prominent players in the EPA/DHA Ingredients Industry?
Key companies in the market include Koninklijke DSM NV, KD Pharma Group, The Archer Daniels Midland Company, Corbion NV, Novasep Holding SAS, Neptune Wellness Solutions, BASF SE, Omega Protein Corporation, Croda International PLC, Novotech Nutraceuticals*List Not Exhaustive.
3. What are the main segments of the EPA/DHA Ingredients Industry?
The market segments include Type, Source, Application.
4. Can you provide details about the market size?
The market size is estimated to be USD 1.92 Million as of 2022.
5. What are some drivers contributing to market growth?
Increasing Awareness Of Health Benefits Associated With EPA And DHA; Demand for Concentrated Forms of Omega 3.
6. What are the notable trends driving market growth?
Increasing Awareness Of Health Benefits Associated With EPA And DHA.
7. Are there any restraints impacting market growth?
Increasing Awareness Of Health Benefits Associated With EPA And DHA; Demand for Concentrated Forms of Omega 3.
8. Can you provide examples of recent developments in the market?
March 2024: DSM-Firmenich partnered with SCN BestCo to launch omega-3 gummies with EPA and DHA ingredients.
9. What pricing options are available for accessing the report?
Pricing options include single-user, multi-user, and enterprise licenses priced at USD 4750, USD 5250, and USD 8750 respectively.
10. Is the market size provided in terms of value or volume?
The market size is provided in terms of value, measured in Million and volume, measured in Billion.
11. Are there any specific market keywords associated with the report?
Yes, the market keyword associated with the report is "EPA/DHA Ingredients Industry," which aids in identifying and referencing the specific market segment covered.
12. How do I determine which pricing option suits my needs best?
The pricing options vary based on user requirements and access needs. Individual users may opt for single-user licenses, while businesses requiring broader access may choose multi-user or enterprise licenses for cost-effective access to the report.
13. Are there any additional resources or data provided in the EPA/DHA Ingredients Industry report?
While the report offers comprehensive insights, it's advisable to review the specific contents or supplementary materials provided to ascertain if additional resources or data are available.
14. How can I stay updated on further developments or reports in the EPA/DHA Ingredients Industry?
To stay informed about further developments, trends, and reports in the EPA/DHA Ingredients Industry, consider subscribing to industry newsletters, following relevant companies and organizations, or regularly checking reputable industry news sources and publications.
Methodology
Step 1 - Identification of Relevant Samples Size from Population Database


Step 2 - Approaches for Defining Global Market Size (Value, Volume* & Price*)

Note*: In applicable scenarios
Step 3 - Data Sources
Primary Research
- Web Analytics
- Survey Reports
- Research Institute
- Latest Research Reports
- Opinion Leaders
Secondary Research
- Annual Reports
- White Paper
- Latest Press Release
- Industry Association
- Paid Database
- Investor Presentations

Step 4 - Data Triangulation
Involves using different sources of information in order to increase the validity of a study
These sources are likely to be stakeholders in a program - participants, other researchers, program staff, other community members, and so on.
Then we put all data in single framework & apply various statistical tools to find out the dynamic on the market.
During the analysis stage, feedback from the stakeholder groups would be compared to determine areas of agreement as well as areas of divergence
