

Key Insights
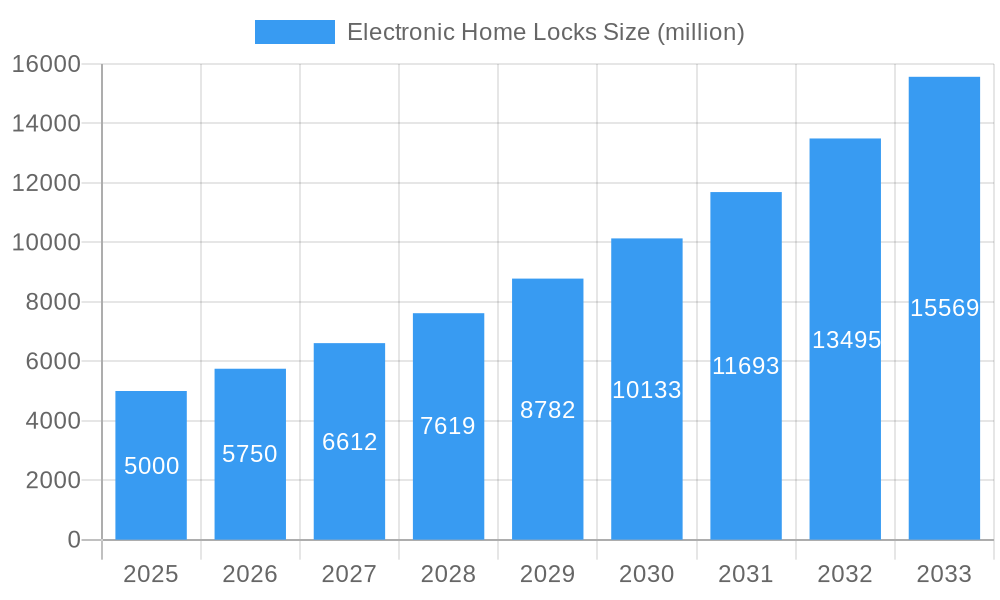
The global electronic home lock market is experiencing robust growth, driven by increasing consumer demand for enhanced security, convenience, and smart home integration. The market, estimated at $5 billion in 2025, is projected to expand at a Compound Annual Growth Rate (CAGR) of 15% from 2025 to 2033, reaching a value exceeding $15 billion by 2033. Key drivers include rising disposable incomes, particularly in developing economies, leading to increased adoption of advanced home security systems. Furthermore, the integration of electronic locks with smart home ecosystems, offering remote access, keyless entry, and user management through mobile applications, is significantly boosting market expansion. The growing preference for contactless technologies, further amplified by recent global health concerns, is another prominent factor fueling market growth. Market segmentation reveals a strong demand for smart locks across residential properties, with a significant portion of the market share held by established players like ASSA ABLOY and Allegion, who leverage their established distribution networks and brand recognition. However, the market is also witnessing the emergence of innovative startups and smaller companies offering specialized features and competitive pricing, fostering competition and driving innovation.
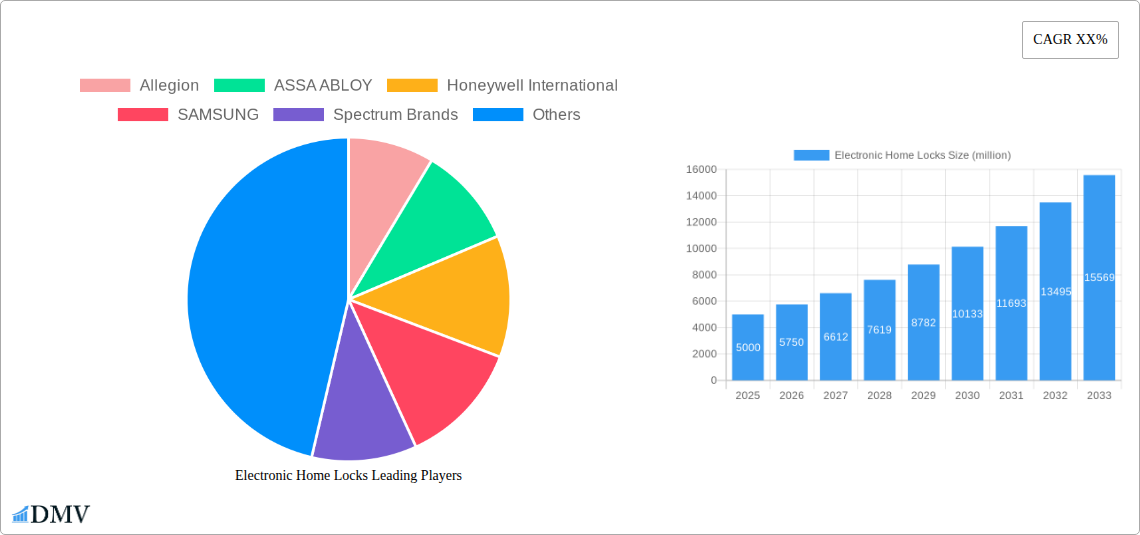
Electronic Home Locks Market Size (In Billion)
Despite the positive outlook, certain restraints hinder market growth. High initial installation costs compared to traditional locks remain a barrier for some consumers. Concerns regarding data security and privacy associated with connected devices also contribute to market hesitancy. However, ongoing technological advancements focusing on improved security protocols and user-friendly interfaces are actively addressing these concerns. The market’s future hinges on continuous innovation, focusing on enhanced security features, seamless integration with other smart home devices, and the development of affordable and reliable options. Expansion into emerging markets will play a crucial role in shaping future growth trajectories. The market's success is closely tied to the broader adoption of smart home technology and increasing consumer confidence in the security and reliability of electronic home locks.
Electronic Home Locks Company Market Share
Electronic Home Locks Market Report: A Comprehensive Analysis (2019-2033)
This insightful report provides a detailed analysis of the global electronic home locks market, projecting a market value exceeding $XX million by 2033. The study covers the period from 2019 to 2033, with 2025 serving as both the base and estimated year. This comprehensive research delves into market dynamics, technological advancements, competitive landscapes, and future growth prospects, offering invaluable insights for stakeholders across the industry. The report utilizes data from the historical period (2019-2024) and forecasts market trends from 2025 to 2033.
Electronic Home Locks Market Composition & Trends
This section examines the market's competitive landscape, analyzing market concentration, innovation drivers, regulatory influences, substitute products, end-user preferences, and mergers & acquisitions (M&A) activity. The report reveals a moderately concentrated market, with key players like Allegion, ASSA ABLOY, and Honeywell International holding significant market share, totaling approximately xx%. However, the emergence of innovative smaller players like Vlocker and Locktec UK is challenging the dominance of established players.
- Market Share Distribution (2025): Allegion (xx%), ASSA ABLOY (xx%), Honeywell International (xx%), Samsung (xx%), Others (xx%).
- Innovation Catalysts: Advancements in biometric technology (fingerprint, facial recognition), smart home integration, and enhanced security features are driving market growth.
- Regulatory Landscape: Varying regional regulations concerning data privacy and security standards impact market penetration.
- Substitute Products: Traditional mechanical locks and keypads present limited competition due to the superior convenience and security offered by electronic locks.
- End-User Profiles: The target audience spans homeowners seeking enhanced security and convenience, property managers prioritizing remote access, and businesses focused on streamlined access control.
- M&A Activities (2019-2024): A total of xx M&A deals were recorded, with a cumulative value exceeding $xx million, reflecting consolidation and expansion strategies within the industry. These activities were primarily focused on technological integration and market expansion.
Electronic Home Locks Industry Evolution
This section analyzes the evolutionary path of the electronic home locks market, documenting growth trajectories, technological advancements, and evolving consumer preferences. The market experienced a Compound Annual Growth Rate (CAGR) of xx% during the historical period (2019-2024), driven primarily by increasing disposable incomes, rising demand for smart home technologies, and enhanced security concerns. The forecast period (2025-2033) anticipates a CAGR of xx%, spurred by the integration of advanced technologies like AI-powered security systems and the growth of the smart home ecosystem. Adoption rates are predicted to increase to xx% by 2033, compared to xx% in 2024. Key technological advancements include the shift towards battery-free locks powered by energy harvesting, and the integration of cloud-based connectivity for enhanced remote management and security monitoring. Consumer demand is shifting towards seamless integration with existing smart home ecosystems, intuitive user interfaces, and enhanced security features, fueling the market's continued expansion.
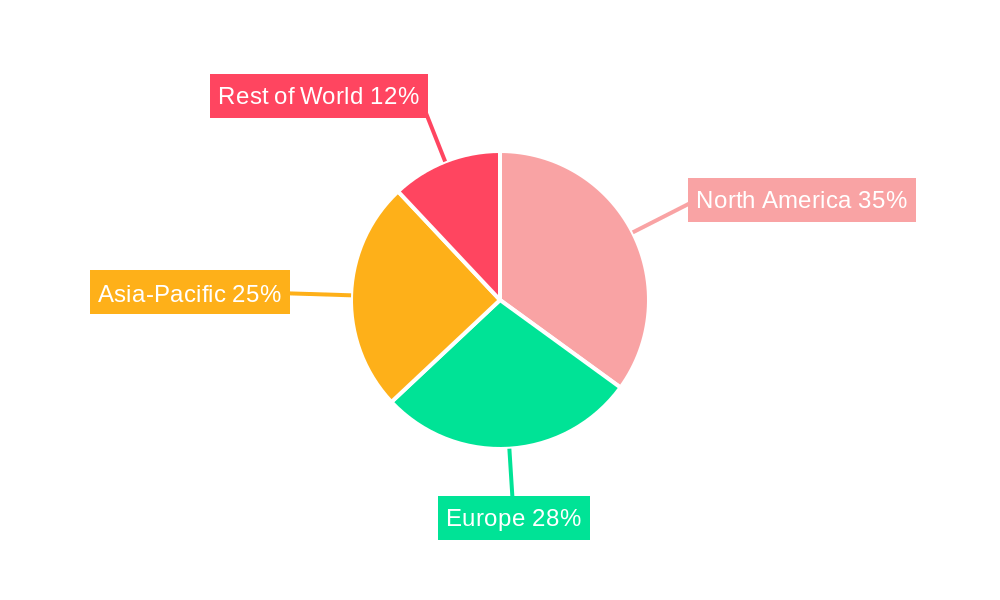
Leading Regions, Countries, or Segments in Electronic Home Locks
North America currently dominates the global electronic home locks market. This dominance is primarily attributed to the high adoption rate of smart home technologies, a strong emphasis on home security, and robust consumer spending power.
- Key Drivers in North America:
- High disposable incomes and willingness to invest in home improvement.
- Strong demand for smart home integration and enhanced security solutions.
- Favorable regulatory environment promoting innovation and technological adoption.
- Early adoption of advanced technologies, creating a strong technological base for market development.
- Other Regions: Europe and Asia-Pacific are also experiencing significant growth, driven by increasing urbanization, rising middle-class incomes, and government initiatives promoting smart city developments. However, these regions lag behind North America in overall market size and adoption rates due to factors like lower disposable income, variable regulatory environments, and slower adoption rates of smart home technologies.
Electronic Home Locks Product Innovations
Recent innovations include the introduction of locks with advanced biometric authentication methods (fingerprint, facial recognition, vein scanning), integration with voice assistants (Alexa, Google Assistant), enhanced encryption protocols, and self-powered mechanisms using energy harvesting technology. These advancements offer improved security, user convenience, and enhanced compatibility with existing smart home ecosystems. Unique selling propositions focus on ease of use, superior security features, and seamless integration into smart home networks, providing a competitive advantage in the market.
Propelling Factors for Electronic Home Locks Growth
The growth of the electronic home locks market is primarily driven by several factors: technological advancements offering enhanced security and convenience, increasing disposable incomes driving consumer spending on home improvement, and the growing adoption of smart home technologies creating a favorable environment for market expansion. Government regulations promoting smart city initiatives and security standards further encourage the market's upward trajectory.
Obstacles in the Electronic Home Locks Market
Significant obstacles include high initial costs deterring some consumers, concerns about data privacy and security breaches associated with connected devices, and potential supply chain disruptions impacting production and distribution. Furthermore, competitive pressure from established and emerging players necessitates continuous innovation and adaptation to maintain market share.
Future Opportunities in Electronic Home Locks
Emerging opportunities lie in the expansion into developing economies with rising middle classes, integration with advanced IoT platforms for broader smart home connectivity, and the development of more sustainable, energy-efficient solutions (e.g., self-powered locks). Exploring new functionalities, such as integrating access control with other home systems (lighting, HVAC), presents further expansion avenues.
Major Players in the Electronic Home Locks Ecosystem
- Allegion
- ASSA ABLOY
- Honeywell International
- SAMSUNG
- Spectrum Brands
- Vlocker
- Eurolockers
- Locktec UK
- Ozone Safes
- Lockers4U
- KEBA
- CP Lockers
- Hangzhou Dongcheng Electronic
Key Developments in Electronic Home Locks Industry
- 2022 Q3: Allegion launched a new line of smart locks with advanced encryption and biometric capabilities.
- 2023 Q1: ASSA ABLOY acquired a smaller smart lock manufacturer, expanding its product portfolio and market reach.
- 2024 Q2: Honeywell International announced a partnership with a major smart home platform, facilitating greater integration of its electronic locks. (Further specific developments will be included in the full report)
Strategic Electronic Home Locks Market Forecast
The electronic home locks market is poised for continued robust growth, driven by ongoing technological advancements, increasing consumer demand for enhanced security and smart home integration, and favorable regulatory support. The market's expansion into new geographical regions and the development of innovative product features will further fuel growth, creating significant opportunities for market participants over the forecast period (2025-2033). This upward trajectory is expected to be sustained, with a significant expansion of the market value to $XX million by 2033.
Electronic Home Locks Segmentation
-
1. Application
- 1.1. Household
- 1.2. Commercial
-
2. Types
- 2.1. Fingerprint
- 2.2. ID
Electronic Home Locks Segmentation By Geography
-
1. North America
- 1.1. United States
- 1.2. Canada
- 1.3. Mexico
-
2. South America
- 2.1. Brazil
- 2.2. Argentina
- 2.3. Rest of South America
-
3. Europe
- 3.1. United Kingdom
- 3.2. Germany
- 3.3. France
- 3.4. Italy
- 3.5. Spain
- 3.6. Russia
- 3.7. Benelux
- 3.8. Nordics
- 3.9. Rest of Europe
-
4. Middle East & Africa
- 4.1. Turkey
- 4.2. Israel
- 4.3. GCC
- 4.4. North Africa
- 4.5. South Africa
- 4.6. Rest of Middle East & Africa
-
5. Asia Pacific
- 5.1. China
- 5.2. India
- 5.3. Japan
- 5.4. South Korea
- 5.5. ASEAN
- 5.6. Oceania
- 5.7. Rest of Asia Pacific
Electronic Home Locks Regional Market Share
Geographic Coverage of Electronic Home Locks
Electronic Home Locks REPORT HIGHLIGHTS
| Aspects | Details |
|---|---|
| Study Period | 2020-2034 |
| Base Year | 2025 |
| Estimated Year | 2026 |
| Forecast Period | 2026-2034 |
| Historical Period | 2020-2025 |
| Growth Rate | CAGR of 19.6% from 2020-2034 |
| Segmentation |
|
Table of Contents
- 1. Introduction
- 1.1. Research Scope
- 1.2. Market Segmentation
- 1.3. Research Methodology
- 1.4. Definitions and Assumptions
- 2. Executive Summary
- 2.1. Introduction
- 3. Market Dynamics
- 3.1. Introduction
- 3.2. Market Drivers
- 3.3. Market Restrains
- 3.4. Market Trends
- 4. Market Factor Analysis
- 4.1. Porters Five Forces
- 4.2. Supply/Value Chain
- 4.3. PESTEL analysis
- 4.4. Market Entropy
- 4.5. Patent/Trademark Analysis
- 5. Global Electronic Home Locks Analysis, Insights and Forecast, 2020-2032
- 5.1. Market Analysis, Insights and Forecast - by Application
- 5.1.1. Household
- 5.1.2. Commercial
- 5.2. Market Analysis, Insights and Forecast - by Types
- 5.2.1. Fingerprint
- 5.2.2. ID
- 5.3. Market Analysis, Insights and Forecast - by Region
- 5.3.1. North America
- 5.3.2. South America
- 5.3.3. Europe
- 5.3.4. Middle East & Africa
- 5.3.5. Asia Pacific
- 5.1. Market Analysis, Insights and Forecast - by Application
- 6. North America Electronic Home Locks Analysis, Insights and Forecast, 2020-2032
- 6.1. Market Analysis, Insights and Forecast - by Application
- 6.1.1. Household
- 6.1.2. Commercial
- 6.2. Market Analysis, Insights and Forecast - by Types
- 6.2.1. Fingerprint
- 6.2.2. ID
- 6.1. Market Analysis, Insights and Forecast - by Application
- 7. South America Electronic Home Locks Analysis, Insights and Forecast, 2020-2032
- 7.1. Market Analysis, Insights and Forecast - by Application
- 7.1.1. Household
- 7.1.2. Commercial
- 7.2. Market Analysis, Insights and Forecast - by Types
- 7.2.1. Fingerprint
- 7.2.2. ID
- 7.1. Market Analysis, Insights and Forecast - by Application
- 8. Europe Electronic Home Locks Analysis, Insights and Forecast, 2020-2032
- 8.1. Market Analysis, Insights and Forecast - by Application
- 8.1.1. Household
- 8.1.2. Commercial
- 8.2. Market Analysis, Insights and Forecast - by Types
- 8.2.1. Fingerprint
- 8.2.2. ID
- 8.1. Market Analysis, Insights and Forecast - by Application
- 9. Middle East & Africa Electronic Home Locks Analysis, Insights and Forecast, 2020-2032
- 9.1. Market Analysis, Insights and Forecast - by Application
- 9.1.1. Household
- 9.1.2. Commercial
- 9.2. Market Analysis, Insights and Forecast - by Types
- 9.2.1. Fingerprint
- 9.2.2. ID
- 9.1. Market Analysis, Insights and Forecast - by Application
- 10. Asia Pacific Electronic Home Locks Analysis, Insights and Forecast, 2020-2032
- 10.1. Market Analysis, Insights and Forecast - by Application
- 10.1.1. Household
- 10.1.2. Commercial
- 10.2. Market Analysis, Insights and Forecast - by Types
- 10.2.1. Fingerprint
- 10.2.2. ID
- 10.1. Market Analysis, Insights and Forecast - by Application
- 11. Competitive Analysis
- 11.1. Global Market Share Analysis 2025
- 11.2. Company Profiles
- 11.2.1 Allegion
- 11.2.1.1. Overview
- 11.2.1.2. Products
- 11.2.1.3. SWOT Analysis
- 11.2.1.4. Recent Developments
- 11.2.1.5. Financials (Based on Availability)
- 11.2.2 ASSA ABLOY
- 11.2.2.1. Overview
- 11.2.2.2. Products
- 11.2.2.3. SWOT Analysis
- 11.2.2.4. Recent Developments
- 11.2.2.5. Financials (Based on Availability)
- 11.2.3 Honeywell International
- 11.2.3.1. Overview
- 11.2.3.2. Products
- 11.2.3.3. SWOT Analysis
- 11.2.3.4. Recent Developments
- 11.2.3.5. Financials (Based on Availability)
- 11.2.4 SAMSUNG
- 11.2.4.1. Overview
- 11.2.4.2. Products
- 11.2.4.3. SWOT Analysis
- 11.2.4.4. Recent Developments
- 11.2.4.5. Financials (Based on Availability)
- 11.2.5 Spectrum Brands
- 11.2.5.1. Overview
- 11.2.5.2. Products
- 11.2.5.3. SWOT Analysis
- 11.2.5.4. Recent Developments
- 11.2.5.5. Financials (Based on Availability)
- 11.2.6 Vlocker
- 11.2.6.1. Overview
- 11.2.6.2. Products
- 11.2.6.3. SWOT Analysis
- 11.2.6.4. Recent Developments
- 11.2.6.5. Financials (Based on Availability)
- 11.2.7 Eurolockers
- 11.2.7.1. Overview
- 11.2.7.2. Products
- 11.2.7.3. SWOT Analysis
- 11.2.7.4. Recent Developments
- 11.2.7.5. Financials (Based on Availability)
- 11.2.8 Locktec UK
- 11.2.8.1. Overview
- 11.2.8.2. Products
- 11.2.8.3. SWOT Analysis
- 11.2.8.4. Recent Developments
- 11.2.8.5. Financials (Based on Availability)
- 11.2.9 Ozone Safes
- 11.2.9.1. Overview
- 11.2.9.2. Products
- 11.2.9.3. SWOT Analysis
- 11.2.9.4. Recent Developments
- 11.2.9.5. Financials (Based on Availability)
- 11.2.10 Lockers4U
- 11.2.10.1. Overview
- 11.2.10.2. Products
- 11.2.10.3. SWOT Analysis
- 11.2.10.4. Recent Developments
- 11.2.10.5. Financials (Based on Availability)
- 11.2.11 KEBA
- 11.2.11.1. Overview
- 11.2.11.2. Products
- 11.2.11.3. SWOT Analysis
- 11.2.11.4. Recent Developments
- 11.2.11.5. Financials (Based on Availability)
- 11.2.12 CP Lockers
- 11.2.12.1. Overview
- 11.2.12.2. Products
- 11.2.12.3. SWOT Analysis
- 11.2.12.4. Recent Developments
- 11.2.12.5. Financials (Based on Availability)
- 11.2.13 Hangzhou Dongcheng Electronic
- 11.2.13.1. Overview
- 11.2.13.2. Products
- 11.2.13.3. SWOT Analysis
- 11.2.13.4. Recent Developments
- 11.2.13.5. Financials (Based on Availability)
- 11.2.1 Allegion
List of Figures
- Figure 1: Global Electronic Home Locks Revenue Breakdown (undefined, %) by Region 2025 & 2033
- Figure 2: Global Electronic Home Locks Volume Breakdown (K, %) by Region 2025 & 2033
- Figure 3: North America Electronic Home Locks Revenue (undefined), by Application 2025 & 2033
- Figure 4: North America Electronic Home Locks Volume (K), by Application 2025 & 2033
- Figure 5: North America Electronic Home Locks Revenue Share (%), by Application 2025 & 2033
- Figure 6: North America Electronic Home Locks Volume Share (%), by Application 2025 & 2033
- Figure 7: North America Electronic Home Locks Revenue (undefined), by Types 2025 & 2033
- Figure 8: North America Electronic Home Locks Volume (K), by Types 2025 & 2033
- Figure 9: North America Electronic Home Locks Revenue Share (%), by Types 2025 & 2033
- Figure 10: North America Electronic Home Locks Volume Share (%), by Types 2025 & 2033
- Figure 11: North America Electronic Home Locks Revenue (undefined), by Country 2025 & 2033
- Figure 12: North America Electronic Home Locks Volume (K), by Country 2025 & 2033
- Figure 13: North America Electronic Home Locks Revenue Share (%), by Country 2025 & 2033
- Figure 14: North America Electronic Home Locks Volume Share (%), by Country 2025 & 2033
- Figure 15: South America Electronic Home Locks Revenue (undefined), by Application 2025 & 2033
- Figure 16: South America Electronic Home Locks Volume (K), by Application 2025 & 2033
- Figure 17: South America Electronic Home Locks Revenue Share (%), by Application 2025 & 2033
- Figure 18: South America Electronic Home Locks Volume Share (%), by Application 2025 & 2033
- Figure 19: South America Electronic Home Locks Revenue (undefined), by Types 2025 & 2033
- Figure 20: South America Electronic Home Locks Volume (K), by Types 2025 & 2033
- Figure 21: South America Electronic Home Locks Revenue Share (%), by Types 2025 & 2033
- Figure 22: South America Electronic Home Locks Volume Share (%), by Types 2025 & 2033
- Figure 23: South America Electronic Home Locks Revenue (undefined), by Country 2025 & 2033
- Figure 24: South America Electronic Home Locks Volume (K), by Country 2025 & 2033
- Figure 25: South America Electronic Home Locks Revenue Share (%), by Country 2025 & 2033
- Figure 26: South America Electronic Home Locks Volume Share (%), by Country 2025 & 2033
- Figure 27: Europe Electronic Home Locks Revenue (undefined), by Application 2025 & 2033
- Figure 28: Europe Electronic Home Locks Volume (K), by Application 2025 & 2033
- Figure 29: Europe Electronic Home Locks Revenue Share (%), by Application 2025 & 2033
- Figure 30: Europe Electronic Home Locks Volume Share (%), by Application 2025 & 2033
- Figure 31: Europe Electronic Home Locks Revenue (undefined), by Types 2025 & 2033
- Figure 32: Europe Electronic Home Locks Volume (K), by Types 2025 & 2033
- Figure 33: Europe Electronic Home Locks Revenue Share (%), by Types 2025 & 2033
- Figure 34: Europe Electronic Home Locks Volume Share (%), by Types 2025 & 2033
- Figure 35: Europe Electronic Home Locks Revenue (undefined), by Country 2025 & 2033
- Figure 36: Europe Electronic Home Locks Volume (K), by Country 2025 & 2033
- Figure 37: Europe Electronic Home Locks Revenue Share (%), by Country 2025 & 2033
- Figure 38: Europe Electronic Home Locks Volume Share (%), by Country 2025 & 2033
- Figure 39: Middle East & Africa Electronic Home Locks Revenue (undefined), by Application 2025 & 2033
- Figure 40: Middle East & Africa Electronic Home Locks Volume (K), by Application 2025 & 2033
- Figure 41: Middle East & Africa Electronic Home Locks Revenue Share (%), by Application 2025 & 2033
- Figure 42: Middle East & Africa Electronic Home Locks Volume Share (%), by Application 2025 & 2033
- Figure 43: Middle East & Africa Electronic Home Locks Revenue (undefined), by Types 2025 & 2033
- Figure 44: Middle East & Africa Electronic Home Locks Volume (K), by Types 2025 & 2033
- Figure 45: Middle East & Africa Electronic Home Locks Revenue Share (%), by Types 2025 & 2033
- Figure 46: Middle East & Africa Electronic Home Locks Volume Share (%), by Types 2025 & 2033
- Figure 47: Middle East & Africa Electronic Home Locks Revenue (undefined), by Country 2025 & 2033
- Figure 48: Middle East & Africa Electronic Home Locks Volume (K), by Country 2025 & 2033
- Figure 49: Middle East & Africa Electronic Home Locks Revenue Share (%), by Country 2025 & 2033
- Figure 50: Middle East & Africa Electronic Home Locks Volume Share (%), by Country 2025 & 2033
- Figure 51: Asia Pacific Electronic Home Locks Revenue (undefined), by Application 2025 & 2033
- Figure 52: Asia Pacific Electronic Home Locks Volume (K), by Application 2025 & 2033
- Figure 53: Asia Pacific Electronic Home Locks Revenue Share (%), by Application 2025 & 2033
- Figure 54: Asia Pacific Electronic Home Locks Volume Share (%), by Application 2025 & 2033
- Figure 55: Asia Pacific Electronic Home Locks Revenue (undefined), by Types 2025 & 2033
- Figure 56: Asia Pacific Electronic Home Locks Volume (K), by Types 2025 & 2033
- Figure 57: Asia Pacific Electronic Home Locks Revenue Share (%), by Types 2025 & 2033
- Figure 58: Asia Pacific Electronic Home Locks Volume Share (%), by Types 2025 & 2033
- Figure 59: Asia Pacific Electronic Home Locks Revenue (undefined), by Country 2025 & 2033
- Figure 60: Asia Pacific Electronic Home Locks Volume (K), by Country 2025 & 2033
- Figure 61: Asia Pacific Electronic Home Locks Revenue Share (%), by Country 2025 & 2033
- Figure 62: Asia Pacific Electronic Home Locks Volume Share (%), by Country 2025 & 2033
List of Tables
- Table 1: Global Electronic Home Locks Revenue undefined Forecast, by Application 2020 & 2033
- Table 2: Global Electronic Home Locks Volume K Forecast, by Application 2020 & 2033
- Table 3: Global Electronic Home Locks Revenue undefined Forecast, by Types 2020 & 2033
- Table 4: Global Electronic Home Locks Volume K Forecast, by Types 2020 & 2033
- Table 5: Global Electronic Home Locks Revenue undefined Forecast, by Region 2020 & 2033
- Table 6: Global Electronic Home Locks Volume K Forecast, by Region 2020 & 2033
- Table 7: Global Electronic Home Locks Revenue undefined Forecast, by Application 2020 & 2033
- Table 8: Global Electronic Home Locks Volume K Forecast, by Application 2020 & 2033
- Table 9: Global Electronic Home Locks Revenue undefined Forecast, by Types 2020 & 2033
- Table 10: Global Electronic Home Locks Volume K Forecast, by Types 2020 & 2033
- Table 11: Global Electronic Home Locks Revenue undefined Forecast, by Country 2020 & 2033
- Table 12: Global Electronic Home Locks Volume K Forecast, by Country 2020 & 2033
- Table 13: United States Electronic Home Locks Revenue (undefined) Forecast, by Application 2020 & 2033
- Table 14: United States Electronic Home Locks Volume (K) Forecast, by Application 2020 & 2033
- Table 15: Canada Electronic Home Locks Revenue (undefined) Forecast, by Application 2020 & 2033
- Table 16: Canada Electronic Home Locks Volume (K) Forecast, by Application 2020 & 2033
- Table 17: Mexico Electronic Home Locks Revenue (undefined) Forecast, by Application 2020 & 2033
- Table 18: Mexico Electronic Home Locks Volume (K) Forecast, by Application 2020 & 2033
- Table 19: Global Electronic Home Locks Revenue undefined Forecast, by Application 2020 & 2033
- Table 20: Global Electronic Home Locks Volume K Forecast, by Application 2020 & 2033
- Table 21: Global Electronic Home Locks Revenue undefined Forecast, by Types 2020 & 2033
- Table 22: Global Electronic Home Locks Volume K Forecast, by Types 2020 & 2033
- Table 23: Global Electronic Home Locks Revenue undefined Forecast, by Country 2020 & 2033
- Table 24: Global Electronic Home Locks Volume K Forecast, by Country 2020 & 2033
- Table 25: Brazil Electronic Home Locks Revenue (undefined) Forecast, by Application 2020 & 2033
- Table 26: Brazil Electronic Home Locks Volume (K) Forecast, by Application 2020 & 2033
- Table 27: Argentina Electronic Home Locks Revenue (undefined) Forecast, by Application 2020 & 2033
- Table 28: Argentina Electronic Home Locks Volume (K) Forecast, by Application 2020 & 2033
- Table 29: Rest of South America Electronic Home Locks Revenue (undefined) Forecast, by Application 2020 & 2033
- Table 30: Rest of South America Electronic Home Locks Volume (K) Forecast, by Application 2020 & 2033
- Table 31: Global Electronic Home Locks Revenue undefined Forecast, by Application 2020 & 2033
- Table 32: Global Electronic Home Locks Volume K Forecast, by Application 2020 & 2033
- Table 33: Global Electronic Home Locks Revenue undefined Forecast, by Types 2020 & 2033
- Table 34: Global Electronic Home Locks Volume K Forecast, by Types 2020 & 2033
- Table 35: Global Electronic Home Locks Revenue undefined Forecast, by Country 2020 & 2033
- Table 36: Global Electronic Home Locks Volume K Forecast, by Country 2020 & 2033
- Table 37: United Kingdom Electronic Home Locks Revenue (undefined) Forecast, by Application 2020 & 2033
- Table 38: United Kingdom Electronic Home Locks Volume (K) Forecast, by Application 2020 & 2033
- Table 39: Germany Electronic Home Locks Revenue (undefined) Forecast, by Application 2020 & 2033
- Table 40: Germany Electronic Home Locks Volume (K) Forecast, by Application 2020 & 2033
- Table 41: France Electronic Home Locks Revenue (undefined) Forecast, by Application 2020 & 2033
- Table 42: France Electronic Home Locks Volume (K) Forecast, by Application 2020 & 2033
- Table 43: Italy Electronic Home Locks Revenue (undefined) Forecast, by Application 2020 & 2033
- Table 44: Italy Electronic Home Locks Volume (K) Forecast, by Application 2020 & 2033
- Table 45: Spain Electronic Home Locks Revenue (undefined) Forecast, by Application 2020 & 2033
- Table 46: Spain Electronic Home Locks Volume (K) Forecast, by Application 2020 & 2033
- Table 47: Russia Electronic Home Locks Revenue (undefined) Forecast, by Application 2020 & 2033
- Table 48: Russia Electronic Home Locks Volume (K) Forecast, by Application 2020 & 2033
- Table 49: Benelux Electronic Home Locks Revenue (undefined) Forecast, by Application 2020 & 2033
- Table 50: Benelux Electronic Home Locks Volume (K) Forecast, by Application 2020 & 2033
- Table 51: Nordics Electronic Home Locks Revenue (undefined) Forecast, by Application 2020 & 2033
- Table 52: Nordics Electronic Home Locks Volume (K) Forecast, by Application 2020 & 2033
- Table 53: Rest of Europe Electronic Home Locks Revenue (undefined) Forecast, by Application 2020 & 2033
- Table 54: Rest of Europe Electronic Home Locks Volume (K) Forecast, by Application 2020 & 2033
- Table 55: Global Electronic Home Locks Revenue undefined Forecast, by Application 2020 & 2033
- Table 56: Global Electronic Home Locks Volume K Forecast, by Application 2020 & 2033
- Table 57: Global Electronic Home Locks Revenue undefined Forecast, by Types 2020 & 2033
- Table 58: Global Electronic Home Locks Volume K Forecast, by Types 2020 & 2033
- Table 59: Global Electronic Home Locks Revenue undefined Forecast, by Country 2020 & 2033
- Table 60: Global Electronic Home Locks Volume K Forecast, by Country 2020 & 2033
- Table 61: Turkey Electronic Home Locks Revenue (undefined) Forecast, by Application 2020 & 2033
- Table 62: Turkey Electronic Home Locks Volume (K) Forecast, by Application 2020 & 2033
- Table 63: Israel Electronic Home Locks Revenue (undefined) Forecast, by Application 2020 & 2033
- Table 64: Israel Electronic Home Locks Volume (K) Forecast, by Application 2020 & 2033
- Table 65: GCC Electronic Home Locks Revenue (undefined) Forecast, by Application 2020 & 2033
- Table 66: GCC Electronic Home Locks Volume (K) Forecast, by Application 2020 & 2033
- Table 67: North Africa Electronic Home Locks Revenue (undefined) Forecast, by Application 2020 & 2033
- Table 68: North Africa Electronic Home Locks Volume (K) Forecast, by Application 2020 & 2033
- Table 69: South Africa Electronic Home Locks Revenue (undefined) Forecast, by Application 2020 & 2033
- Table 70: South Africa Electronic Home Locks Volume (K) Forecast, by Application 2020 & 2033
- Table 71: Rest of Middle East & Africa Electronic Home Locks Revenue (undefined) Forecast, by Application 2020 & 2033
- Table 72: Rest of Middle East & Africa Electronic Home Locks Volume (K) Forecast, by Application 2020 & 2033
- Table 73: Global Electronic Home Locks Revenue undefined Forecast, by Application 2020 & 2033
- Table 74: Global Electronic Home Locks Volume K Forecast, by Application 2020 & 2033
- Table 75: Global Electronic Home Locks Revenue undefined Forecast, by Types 2020 & 2033
- Table 76: Global Electronic Home Locks Volume K Forecast, by Types 2020 & 2033
- Table 77: Global Electronic Home Locks Revenue undefined Forecast, by Country 2020 & 2033
- Table 78: Global Electronic Home Locks Volume K Forecast, by Country 2020 & 2033
- Table 79: China Electronic Home Locks Revenue (undefined) Forecast, by Application 2020 & 2033
- Table 80: China Electronic Home Locks Volume (K) Forecast, by Application 2020 & 2033
- Table 81: India Electronic Home Locks Revenue (undefined) Forecast, by Application 2020 & 2033
- Table 82: India Electronic Home Locks Volume (K) Forecast, by Application 2020 & 2033
- Table 83: Japan Electronic Home Locks Revenue (undefined) Forecast, by Application 2020 & 2033
- Table 84: Japan Electronic Home Locks Volume (K) Forecast, by Application 2020 & 2033
- Table 85: South Korea Electronic Home Locks Revenue (undefined) Forecast, by Application 2020 & 2033
- Table 86: South Korea Electronic Home Locks Volume (K) Forecast, by Application 2020 & 2033
- Table 87: ASEAN Electronic Home Locks Revenue (undefined) Forecast, by Application 2020 & 2033
- Table 88: ASEAN Electronic Home Locks Volume (K) Forecast, by Application 2020 & 2033
- Table 89: Oceania Electronic Home Locks Revenue (undefined) Forecast, by Application 2020 & 2033
- Table 90: Oceania Electronic Home Locks Volume (K) Forecast, by Application 2020 & 2033
- Table 91: Rest of Asia Pacific Electronic Home Locks Revenue (undefined) Forecast, by Application 2020 & 2033
- Table 92: Rest of Asia Pacific Electronic Home Locks Volume (K) Forecast, by Application 2020 & 2033
Frequently Asked Questions
1. What is the projected Compound Annual Growth Rate (CAGR) of the Electronic Home Locks?
The projected CAGR is approximately 19.6%.
2. Which companies are prominent players in the Electronic Home Locks?
Key companies in the market include Allegion, ASSA ABLOY, Honeywell International, SAMSUNG, Spectrum Brands, Vlocker, Eurolockers, Locktec UK, Ozone Safes, Lockers4U, KEBA, CP Lockers, Hangzhou Dongcheng Electronic.
3. What are the main segments of the Electronic Home Locks?
The market segments include Application, Types.
4. Can you provide details about the market size?
The market size is estimated to be USD XXX N/A as of 2022.
5. What are some drivers contributing to market growth?
N/A
6. What are the notable trends driving market growth?
N/A
7. Are there any restraints impacting market growth?
N/A
8. Can you provide examples of recent developments in the market?
N/A
9. What pricing options are available for accessing the report?
Pricing options include single-user, multi-user, and enterprise licenses priced at USD 3350.00, USD 5025.00, and USD 6700.00 respectively.
10. Is the market size provided in terms of value or volume?
The market size is provided in terms of value, measured in N/A and volume, measured in K.
11. Are there any specific market keywords associated with the report?
Yes, the market keyword associated with the report is "Electronic Home Locks," which aids in identifying and referencing the specific market segment covered.
12. How do I determine which pricing option suits my needs best?
The pricing options vary based on user requirements and access needs. Individual users may opt for single-user licenses, while businesses requiring broader access may choose multi-user or enterprise licenses for cost-effective access to the report.
13. Are there any additional resources or data provided in the Electronic Home Locks report?
While the report offers comprehensive insights, it's advisable to review the specific contents or supplementary materials provided to ascertain if additional resources or data are available.
14. How can I stay updated on further developments or reports in the Electronic Home Locks?
To stay informed about further developments, trends, and reports in the Electronic Home Locks, consider subscribing to industry newsletters, following relevant companies and organizations, or regularly checking reputable industry news sources and publications.
Methodology
Step 1 - Identification of Relevant Samples Size from Population Database


Step 2 - Approaches for Defining Global Market Size (Value, Volume* & Price*)

Note*: In applicable scenarios
Step 3 - Data Sources
Primary Research
- Web Analytics
- Survey Reports
- Research Institute
- Latest Research Reports
- Opinion Leaders
Secondary Research
- Annual Reports
- White Paper
- Latest Press Release
- Industry Association
- Paid Database
- Investor Presentations

Step 4 - Data Triangulation
Involves using different sources of information in order to increase the validity of a study
These sources are likely to be stakeholders in a program - participants, other researchers, program staff, other community members, and so on.
Then we put all data in single framework & apply various statistical tools to find out the dynamic on the market.
During the analysis stage, feedback from the stakeholder groups would be compared to determine areas of agreement as well as areas of divergence