

Key Insights
The Distributed In-Memory Database (DIMDB) market is experiencing significant expansion, driven by the escalating demand for real-time data processing and analytics across a multitude of industries. This growth is propelled by the widespread adoption of cloud computing, the proliferation of big data applications, and the imperative for low-latency, high-throughput database solutions. Businesses are increasingly leveraging DIMDBs to support mission-critical applications requiring immediate insights, including fraud detection, online gaming, and high-frequency trading. The market's segmentation showcases diverse deployment models and functional capabilities, encompassing cloud-native solutions and on-premise configurations tailored to specific industry requirements. Leading market participants are dedicated to continuous innovation, focusing on enhancing scalability, performance, and security features. The competitive landscape is dynamic, characterized by established vendors and emerging startups vying for market dominance through strategic alliances, acquisitions, and ongoing product development. Future market expansion will be significantly influenced by technological advancements in in-memory computing architectures and the integration of artificial intelligence (AI) and machine learning (ML) capabilities within DIMDB platforms.
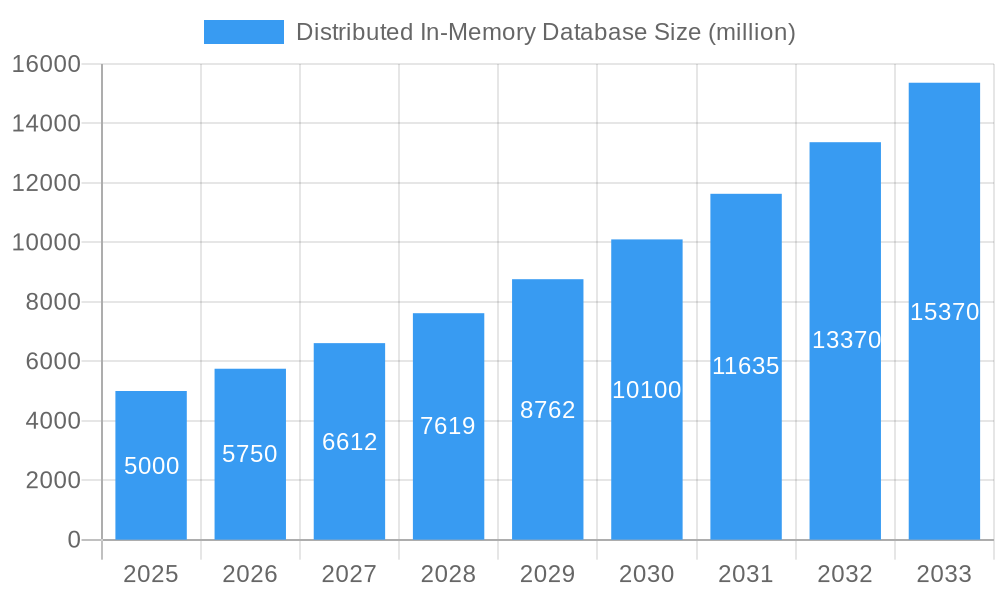
Distributed In-Memory Database Market Size (In Billion)
The projected Compound Annual Growth Rate (CAGR) indicates substantial market expansion within the forecast period. With a CAGR of 13.61% and a base year market size of $9.96 billion in 2025, the market is forecasted to reach significant value by 2033. However, this growth trajectory is contingent upon effectively addressing key challenges. These include the inherent complexities in managing and maintaining large-scale in-memory databases, the requirement for specialized technical expertise, and the persistent concerns surrounding security vulnerabilities. Mitigating these obstacles through the development of advanced tooling, robust security protocols, and strategic workforce development initiatives will be paramount to ensuring sustained market expansion and fostering broader adoption of DIMDB technologies.
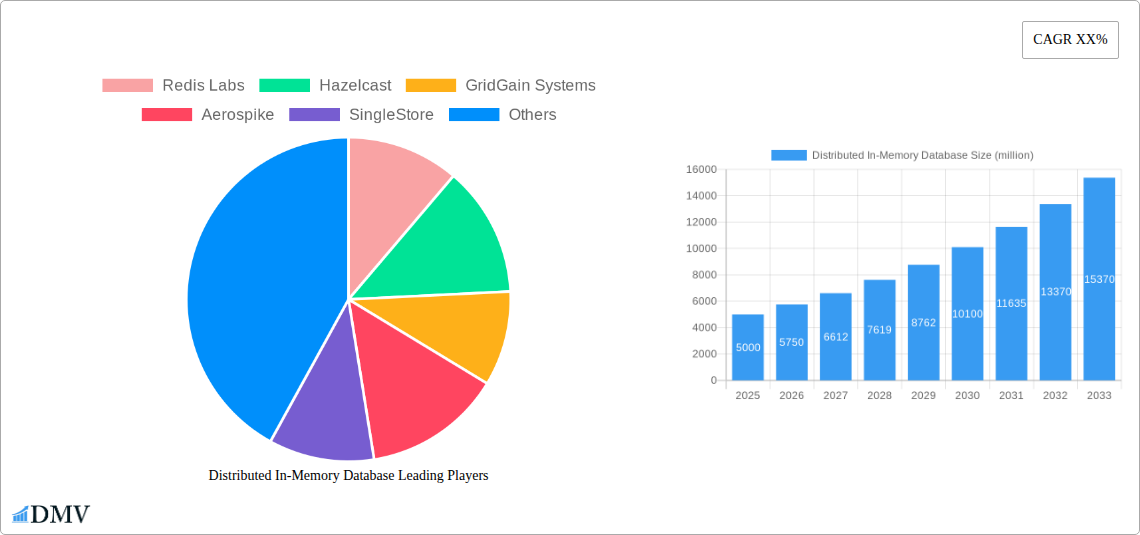
Distributed In-Memory Database Company Market Share
Distributed In-Memory Database Market Report: 2019-2033
This comprehensive report provides an in-depth analysis of the global Distributed In-Memory Database (DIMDB) market, forecasting robust growth from $XX million in 2025 to $XX million by 2033. The study covers the historical period (2019-2024), the base year (2025), and the forecast period (2025-2033), offering invaluable insights for stakeholders across the technology landscape. This report is crucial for businesses seeking to understand the competitive dynamics, technological advancements, and lucrative investment opportunities within this rapidly evolving sector.
Distributed In-Memory Database Market Composition & Trends
This section delves into the intricate structure of the DIMDB market, revealing its key components and driving forces. We analyze market concentration, identifying the leading players and their respective market share. For example, in 2025, Redis Labs is estimated to hold a XX% market share, followed by Hazelcast with XX%, and so on. The report also examines innovation catalysts, pinpointing technological breakthroughs driving market growth, such as advancements in in-memory computing and distributed architectures. Further analysis includes the regulatory landscape and its impact on market expansion, the presence and influence of substitute products, detailed end-user profiles across diverse industries (e.g., finance, healthcare, and retail), and a comprehensive overview of significant M&A activities, including deal values. For instance, the merger of Company A and Company B in 2024 resulted in a $XX million transaction, reshaping the competitive landscape. Finally, the section will utilize charts and graphs to illustrate the market share distribution amongst the major players, including the above-mentioned Redis Labs, Hazelcast, and other significant companies, alongside other key trends and data points.
- Market Concentration: High/Medium/Low (specify based on data analysis).
- M&A Activity: XX major deals totaling $XX million in the historical period.
- Innovation Catalysts: Advancements in data analytics, AI/ML integration, cloud adoption.
- Regulatory Landscape: Compliance with GDPR, CCPA, and other relevant data privacy regulations.
- Substitute Products: Traditional relational databases, cloud-based databases.
Distributed In-Memory Database Industry Evolution
This section provides a detailed historical and future perspective on the DIMDB market’s evolution, encompassing technological breakthroughs, shifting consumer preferences, and resultant market growth trajectories. We analyze the market's Compound Annual Growth Rate (CAGR) during the historical period (2019-2024) as XX% and project a CAGR of XX% for the forecast period (2025-2033). Adoption rates are projected to increase from XX million users in 2025 to XX million users in 2033, fueled by increasing demands for real-time analytics and low latency applications. The evolution of DIMDB technologies from basic in-memory solutions to sophisticated, distributed architectures optimized for cloud environments is meticulously charted. The increasing adoption of cloud-native solutions and the integration of advanced analytics capabilities, such as machine learning and artificial intelligence, will be central to this analysis. Specific data points, such as the adoption rate of different DIMDB types across sectors and technological advancements, will be discussed.
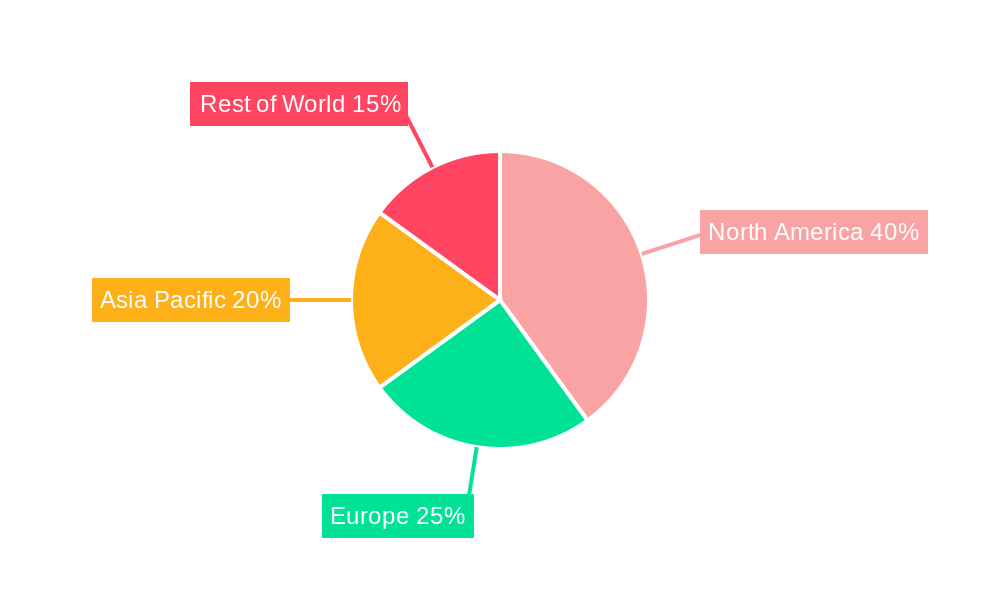
Leading Regions, Countries, or Segments in Distributed In-Memory Database
This section identifies the dominant regions, countries, and market segments for DIMDB adoption. Based on our analysis, North America is projected to be the leading region during the forecast period, followed by Europe and Asia-Pacific.
- Key Drivers for North American Dominance:
- High levels of technological innovation and early adoption of new technologies.
- Significant investments in research and development in the IT sector.
- Stringent data privacy regulations driving adoption of high-performance, secure databases.
- Strong presence of major technology companies.
- Other Regions: The report will also provide detailed insights into the market dynamics and growth prospects of other regions like Europe, Asia-Pacific, and the rest of the world. We will explore factors such as government support, economic conditions, and the technological maturity of the market in each region.
Distributed In-Memory Database Product Innovations
This section highlights recent product innovations, focusing on enhanced performance metrics and unique selling propositions. Key advancements include improved scalability, reduced latency, enhanced security features, and integration with leading cloud platforms. New application domains emerging, driven by the need for real-time insights from ever-growing datasets are also discussed. For instance, advancements in query processing engines and data compression techniques are leading to significant performance improvements and lowering storage costs.
Propelling Factors for Distributed In-Memory Database Growth
The rapid expansion of the DIMDB market is fueled by several key factors: the exponential growth of data, the increasing demand for real-time analytics, advancements in processing power and storage technologies, and the growing adoption of cloud computing. The demand for low-latency applications across diverse sectors, such as finance and IoT, further accelerates the adoption of DIMDB solutions.
Obstacles in the Distributed In-Memory Database Market
Despite the promising growth outlook, challenges remain. These include the complexity of implementation and management of distributed systems, the high cost of deployment for some advanced solutions, and the need for skilled professionals to manage and maintain these databases effectively. The competitive landscape remains another key obstacle, with numerous established and emerging vendors vying for market share. Supply chain disruptions can also potentially impact the market, leading to delays in product delivery or increased costs.
Future Opportunities in Distributed In-Memory Database
Future opportunities lie in expanding into new markets such as edge computing and the Internet of Things (IoT), where low latency and high throughput are crucial. The integration of AI and machine learning capabilities into DIMDB platforms to provide advanced analytics functionalities also presents significant opportunities. Finally, focusing on vertical-specific solutions tailored to address the unique needs of different industries will likely drive further growth.
Major Players in the Distributed In-Memory Database Ecosystem
- Redis Labs
- Hazelcast
- GridGain Systems
- Aerospike
- SingleStore
- Broadcom
- GigaSpaces
- ScaleOut Software
- Shenzhen Tianyuan DIC Information Technology
- Couchbase
- VoltDB
- Alachisoft
- TmaxSoft
- Oracle
- SAP
- Microsoft
- Amazon
- Exasol
- Altibase
- Apache
- ArangoDB
- Terracotta
- McObject
Key Developments in Distributed In-Memory Database Industry
- 2024 Q4: Redis Labs launched its new cloud-native DIMDB platform.
- 2023 Q3: Hazelcast announced a strategic partnership with a major cloud provider.
- 2022 Q1: GridGain Systems released a major update to its DIMDB software. (Further details on other key developments would be included here)
Strategic Distributed In-Memory Database Market Forecast
The DIMDB market is poised for significant growth over the next decade. Driven by increasing data volumes, the demand for real-time analytics, and the continued evolution of cloud computing, the market will experience substantial expansion across various industries. Emerging technologies, such as edge computing and serverless architectures, will further propel the adoption of DIMDB solutions, creating new opportunities for innovation and market leadership.
Distributed In-Memory Database Segmentation
-
1. Application
- 1.1. Transactional Applications
- 1.2. IoT Data
-
2. Types
- 2.1. Non-relational Database
- 2.2. Relational Database
Distributed In-Memory Database Segmentation By Geography
-
1. North America
- 1.1. United States
- 1.2. Canada
- 1.3. Mexico
-
2. South America
- 2.1. Brazil
- 2.2. Argentina
- 2.3. Rest of South America
-
3. Europe
- 3.1. United Kingdom
- 3.2. Germany
- 3.3. France
- 3.4. Italy
- 3.5. Spain
- 3.6. Russia
- 3.7. Benelux
- 3.8. Nordics
- 3.9. Rest of Europe
-
4. Middle East & Africa
- 4.1. Turkey
- 4.2. Israel
- 4.3. GCC
- 4.4. North Africa
- 4.5. South Africa
- 4.6. Rest of Middle East & Africa
-
5. Asia Pacific
- 5.1. China
- 5.2. India
- 5.3. Japan
- 5.4. South Korea
- 5.5. ASEAN
- 5.6. Oceania
- 5.7. Rest of Asia Pacific
Distributed In-Memory Database Regional Market Share
Geographic Coverage of Distributed In-Memory Database
Distributed In-Memory Database REPORT HIGHLIGHTS
| Aspects | Details |
|---|---|
| Study Period | 2020-2034 |
| Base Year | 2025 |
| Estimated Year | 2026 |
| Forecast Period | 2026-2034 |
| Historical Period | 2020-2025 |
| Growth Rate | CAGR of 13.61% from 2020-2034 |
| Segmentation |
|
Table of Contents
- 1. Introduction
- 1.1. Research Scope
- 1.2. Market Segmentation
- 1.3. Research Methodology
- 1.4. Definitions and Assumptions
- 2. Executive Summary
- 2.1. Introduction
- 3. Market Dynamics
- 3.1. Introduction
- 3.2. Market Drivers
- 3.3. Market Restrains
- 3.4. Market Trends
- 4. Market Factor Analysis
- 4.1. Porters Five Forces
- 4.2. Supply/Value Chain
- 4.3. PESTEL analysis
- 4.4. Market Entropy
- 4.5. Patent/Trademark Analysis
- 5. Global Distributed In-Memory Database Analysis, Insights and Forecast, 2020-2032
- 5.1. Market Analysis, Insights and Forecast - by Application
- 5.1.1. Transactional Applications
- 5.1.2. IoT Data
- 5.2. Market Analysis, Insights and Forecast - by Types
- 5.2.1. Non-relational Database
- 5.2.2. Relational Database
- 5.3. Market Analysis, Insights and Forecast - by Region
- 5.3.1. North America
- 5.3.2. South America
- 5.3.3. Europe
- 5.3.4. Middle East & Africa
- 5.3.5. Asia Pacific
- 5.1. Market Analysis, Insights and Forecast - by Application
- 6. North America Distributed In-Memory Database Analysis, Insights and Forecast, 2020-2032
- 6.1. Market Analysis, Insights and Forecast - by Application
- 6.1.1. Transactional Applications
- 6.1.2. IoT Data
- 6.2. Market Analysis, Insights and Forecast - by Types
- 6.2.1. Non-relational Database
- 6.2.2. Relational Database
- 6.1. Market Analysis, Insights and Forecast - by Application
- 7. South America Distributed In-Memory Database Analysis, Insights and Forecast, 2020-2032
- 7.1. Market Analysis, Insights and Forecast - by Application
- 7.1.1. Transactional Applications
- 7.1.2. IoT Data
- 7.2. Market Analysis, Insights and Forecast - by Types
- 7.2.1. Non-relational Database
- 7.2.2. Relational Database
- 7.1. Market Analysis, Insights and Forecast - by Application
- 8. Europe Distributed In-Memory Database Analysis, Insights and Forecast, 2020-2032
- 8.1. Market Analysis, Insights and Forecast - by Application
- 8.1.1. Transactional Applications
- 8.1.2. IoT Data
- 8.2. Market Analysis, Insights and Forecast - by Types
- 8.2.1. Non-relational Database
- 8.2.2. Relational Database
- 8.1. Market Analysis, Insights and Forecast - by Application
- 9. Middle East & Africa Distributed In-Memory Database Analysis, Insights and Forecast, 2020-2032
- 9.1. Market Analysis, Insights and Forecast - by Application
- 9.1.1. Transactional Applications
- 9.1.2. IoT Data
- 9.2. Market Analysis, Insights and Forecast - by Types
- 9.2.1. Non-relational Database
- 9.2.2. Relational Database
- 9.1. Market Analysis, Insights and Forecast - by Application
- 10. Asia Pacific Distributed In-Memory Database Analysis, Insights and Forecast, 2020-2032
- 10.1. Market Analysis, Insights and Forecast - by Application
- 10.1.1. Transactional Applications
- 10.1.2. IoT Data
- 10.2. Market Analysis, Insights and Forecast - by Types
- 10.2.1. Non-relational Database
- 10.2.2. Relational Database
- 10.1. Market Analysis, Insights and Forecast - by Application
- 11. Competitive Analysis
- 11.1. Global Market Share Analysis 2025
- 11.2. Company Profiles
- 11.2.1 Redis Labs
- 11.2.1.1. Overview
- 11.2.1.2. Products
- 11.2.1.3. SWOT Analysis
- 11.2.1.4. Recent Developments
- 11.2.1.5. Financials (Based on Availability)
- 11.2.2 Hazelcast
- 11.2.2.1. Overview
- 11.2.2.2. Products
- 11.2.2.3. SWOT Analysis
- 11.2.2.4. Recent Developments
- 11.2.2.5. Financials (Based on Availability)
- 11.2.3 GridGain Systems
- 11.2.3.1. Overview
- 11.2.3.2. Products
- 11.2.3.3. SWOT Analysis
- 11.2.3.4. Recent Developments
- 11.2.3.5. Financials (Based on Availability)
- 11.2.4 Aerospike
- 11.2.4.1. Overview
- 11.2.4.2. Products
- 11.2.4.3. SWOT Analysis
- 11.2.4.4. Recent Developments
- 11.2.4.5. Financials (Based on Availability)
- 11.2.5 SingleStore
- 11.2.5.1. Overview
- 11.2.5.2. Products
- 11.2.5.3. SWOT Analysis
- 11.2.5.4. Recent Developments
- 11.2.5.5. Financials (Based on Availability)
- 11.2.6 Broadcom
- 11.2.6.1. Overview
- 11.2.6.2. Products
- 11.2.6.3. SWOT Analysis
- 11.2.6.4. Recent Developments
- 11.2.6.5. Financials (Based on Availability)
- 11.2.7 GigaSpaces
- 11.2.7.1. Overview
- 11.2.7.2. Products
- 11.2.7.3. SWOT Analysis
- 11.2.7.4. Recent Developments
- 11.2.7.5. Financials (Based on Availability)
- 11.2.8 ScaleOut Software
- 11.2.8.1. Overview
- 11.2.8.2. Products
- 11.2.8.3. SWOT Analysis
- 11.2.8.4. Recent Developments
- 11.2.8.5. Financials (Based on Availability)
- 11.2.9 Shenzhen Tianyuan DIC Information Technology
- 11.2.9.1. Overview
- 11.2.9.2. Products
- 11.2.9.3. SWOT Analysis
- 11.2.9.4. Recent Developments
- 11.2.9.5. Financials (Based on Availability)
- 11.2.10 Couchbase
- 11.2.10.1. Overview
- 11.2.10.2. Products
- 11.2.10.3. SWOT Analysis
- 11.2.10.4. Recent Developments
- 11.2.10.5. Financials (Based on Availability)
- 11.2.11 VoltDB
- 11.2.11.1. Overview
- 11.2.11.2. Products
- 11.2.11.3. SWOT Analysis
- 11.2.11.4. Recent Developments
- 11.2.11.5. Financials (Based on Availability)
- 11.2.12 Alachisoft
- 11.2.12.1. Overview
- 11.2.12.2. Products
- 11.2.12.3. SWOT Analysis
- 11.2.12.4. Recent Developments
- 11.2.12.5. Financials (Based on Availability)
- 11.2.13 GridGain
- 11.2.13.1. Overview
- 11.2.13.2. Products
- 11.2.13.3. SWOT Analysis
- 11.2.13.4. Recent Developments
- 11.2.13.5. Financials (Based on Availability)
- 11.2.14 TmaxSoft
- 11.2.14.1. Overview
- 11.2.14.2. Products
- 11.2.14.3. SWOT Analysis
- 11.2.14.4. Recent Developments
- 11.2.14.5. Financials (Based on Availability)
- 11.2.15 Oracle
- 11.2.15.1. Overview
- 11.2.15.2. Products
- 11.2.15.3. SWOT Analysis
- 11.2.15.4. Recent Developments
- 11.2.15.5. Financials (Based on Availability)
- 11.2.16 SAP
- 11.2.16.1. Overview
- 11.2.16.2. Products
- 11.2.16.3. SWOT Analysis
- 11.2.16.4. Recent Developments
- 11.2.16.5. Financials (Based on Availability)
- 11.2.17 Microsoft
- 11.2.17.1. Overview
- 11.2.17.2. Products
- 11.2.17.3. SWOT Analysis
- 11.2.17.4. Recent Developments
- 11.2.17.5. Financials (Based on Availability)
- 11.2.18 Amazon
- 11.2.18.1. Overview
- 11.2.18.2. Products
- 11.2.18.3. SWOT Analysis
- 11.2.18.4. Recent Developments
- 11.2.18.5. Financials (Based on Availability)
- 11.2.19 Exasol
- 11.2.19.1. Overview
- 11.2.19.2. Products
- 11.2.19.3. SWOT Analysis
- 11.2.19.4. Recent Developments
- 11.2.19.5. Financials (Based on Availability)
- 11.2.20 Altibase
- 11.2.20.1. Overview
- 11.2.20.2. Products
- 11.2.20.3. SWOT Analysis
- 11.2.20.4. Recent Developments
- 11.2.20.5. Financials (Based on Availability)
- 11.2.21 Apache
- 11.2.21.1. Overview
- 11.2.21.2. Products
- 11.2.21.3. SWOT Analysis
- 11.2.21.4. Recent Developments
- 11.2.21.5. Financials (Based on Availability)
- 11.2.22 ArangoDB
- 11.2.22.1. Overview
- 11.2.22.2. Products
- 11.2.22.3. SWOT Analysis
- 11.2.22.4. Recent Developments
- 11.2.22.5. Financials (Based on Availability)
- 11.2.23 Terracotta
- 11.2.23.1. Overview
- 11.2.23.2. Products
- 11.2.23.3. SWOT Analysis
- 11.2.23.4. Recent Developments
- 11.2.23.5. Financials (Based on Availability)
- 11.2.24 McObject
- 11.2.24.1. Overview
- 11.2.24.2. Products
- 11.2.24.3. SWOT Analysis
- 11.2.24.4. Recent Developments
- 11.2.24.5. Financials (Based on Availability)
- 11.2.1 Redis Labs
List of Figures
- Figure 1: Global Distributed In-Memory Database Revenue Breakdown (billion, %) by Region 2025 & 2033
- Figure 2: North America Distributed In-Memory Database Revenue (billion), by Application 2025 & 2033
- Figure 3: North America Distributed In-Memory Database Revenue Share (%), by Application 2025 & 2033
- Figure 4: North America Distributed In-Memory Database Revenue (billion), by Types 2025 & 2033
- Figure 5: North America Distributed In-Memory Database Revenue Share (%), by Types 2025 & 2033
- Figure 6: North America Distributed In-Memory Database Revenue (billion), by Country 2025 & 2033
- Figure 7: North America Distributed In-Memory Database Revenue Share (%), by Country 2025 & 2033
- Figure 8: South America Distributed In-Memory Database Revenue (billion), by Application 2025 & 2033
- Figure 9: South America Distributed In-Memory Database Revenue Share (%), by Application 2025 & 2033
- Figure 10: South America Distributed In-Memory Database Revenue (billion), by Types 2025 & 2033
- Figure 11: South America Distributed In-Memory Database Revenue Share (%), by Types 2025 & 2033
- Figure 12: South America Distributed In-Memory Database Revenue (billion), by Country 2025 & 2033
- Figure 13: South America Distributed In-Memory Database Revenue Share (%), by Country 2025 & 2033
- Figure 14: Europe Distributed In-Memory Database Revenue (billion), by Application 2025 & 2033
- Figure 15: Europe Distributed In-Memory Database Revenue Share (%), by Application 2025 & 2033
- Figure 16: Europe Distributed In-Memory Database Revenue (billion), by Types 2025 & 2033
- Figure 17: Europe Distributed In-Memory Database Revenue Share (%), by Types 2025 & 2033
- Figure 18: Europe Distributed In-Memory Database Revenue (billion), by Country 2025 & 2033
- Figure 19: Europe Distributed In-Memory Database Revenue Share (%), by Country 2025 & 2033
- Figure 20: Middle East & Africa Distributed In-Memory Database Revenue (billion), by Application 2025 & 2033
- Figure 21: Middle East & Africa Distributed In-Memory Database Revenue Share (%), by Application 2025 & 2033
- Figure 22: Middle East & Africa Distributed In-Memory Database Revenue (billion), by Types 2025 & 2033
- Figure 23: Middle East & Africa Distributed In-Memory Database Revenue Share (%), by Types 2025 & 2033
- Figure 24: Middle East & Africa Distributed In-Memory Database Revenue (billion), by Country 2025 & 2033
- Figure 25: Middle East & Africa Distributed In-Memory Database Revenue Share (%), by Country 2025 & 2033
- Figure 26: Asia Pacific Distributed In-Memory Database Revenue (billion), by Application 2025 & 2033
- Figure 27: Asia Pacific Distributed In-Memory Database Revenue Share (%), by Application 2025 & 2033
- Figure 28: Asia Pacific Distributed In-Memory Database Revenue (billion), by Types 2025 & 2033
- Figure 29: Asia Pacific Distributed In-Memory Database Revenue Share (%), by Types 2025 & 2033
- Figure 30: Asia Pacific Distributed In-Memory Database Revenue (billion), by Country 2025 & 2033
- Figure 31: Asia Pacific Distributed In-Memory Database Revenue Share (%), by Country 2025 & 2033
List of Tables
- Table 1: Global Distributed In-Memory Database Revenue billion Forecast, by Application 2020 & 2033
- Table 2: Global Distributed In-Memory Database Revenue billion Forecast, by Types 2020 & 2033
- Table 3: Global Distributed In-Memory Database Revenue billion Forecast, by Region 2020 & 2033
- Table 4: Global Distributed In-Memory Database Revenue billion Forecast, by Application 2020 & 2033
- Table 5: Global Distributed In-Memory Database Revenue billion Forecast, by Types 2020 & 2033
- Table 6: Global Distributed In-Memory Database Revenue billion Forecast, by Country 2020 & 2033
- Table 7: United States Distributed In-Memory Database Revenue (billion) Forecast, by Application 2020 & 2033
- Table 8: Canada Distributed In-Memory Database Revenue (billion) Forecast, by Application 2020 & 2033
- Table 9: Mexico Distributed In-Memory Database Revenue (billion) Forecast, by Application 2020 & 2033
- Table 10: Global Distributed In-Memory Database Revenue billion Forecast, by Application 2020 & 2033
- Table 11: Global Distributed In-Memory Database Revenue billion Forecast, by Types 2020 & 2033
- Table 12: Global Distributed In-Memory Database Revenue billion Forecast, by Country 2020 & 2033
- Table 13: Brazil Distributed In-Memory Database Revenue (billion) Forecast, by Application 2020 & 2033
- Table 14: Argentina Distributed In-Memory Database Revenue (billion) Forecast, by Application 2020 & 2033
- Table 15: Rest of South America Distributed In-Memory Database Revenue (billion) Forecast, by Application 2020 & 2033
- Table 16: Global Distributed In-Memory Database Revenue billion Forecast, by Application 2020 & 2033
- Table 17: Global Distributed In-Memory Database Revenue billion Forecast, by Types 2020 & 2033
- Table 18: Global Distributed In-Memory Database Revenue billion Forecast, by Country 2020 & 2033
- Table 19: United Kingdom Distributed In-Memory Database Revenue (billion) Forecast, by Application 2020 & 2033
- Table 20: Germany Distributed In-Memory Database Revenue (billion) Forecast, by Application 2020 & 2033
- Table 21: France Distributed In-Memory Database Revenue (billion) Forecast, by Application 2020 & 2033
- Table 22: Italy Distributed In-Memory Database Revenue (billion) Forecast, by Application 2020 & 2033
- Table 23: Spain Distributed In-Memory Database Revenue (billion) Forecast, by Application 2020 & 2033
- Table 24: Russia Distributed In-Memory Database Revenue (billion) Forecast, by Application 2020 & 2033
- Table 25: Benelux Distributed In-Memory Database Revenue (billion) Forecast, by Application 2020 & 2033
- Table 26: Nordics Distributed In-Memory Database Revenue (billion) Forecast, by Application 2020 & 2033
- Table 27: Rest of Europe Distributed In-Memory Database Revenue (billion) Forecast, by Application 2020 & 2033
- Table 28: Global Distributed In-Memory Database Revenue billion Forecast, by Application 2020 & 2033
- Table 29: Global Distributed In-Memory Database Revenue billion Forecast, by Types 2020 & 2033
- Table 30: Global Distributed In-Memory Database Revenue billion Forecast, by Country 2020 & 2033
- Table 31: Turkey Distributed In-Memory Database Revenue (billion) Forecast, by Application 2020 & 2033
- Table 32: Israel Distributed In-Memory Database Revenue (billion) Forecast, by Application 2020 & 2033
- Table 33: GCC Distributed In-Memory Database Revenue (billion) Forecast, by Application 2020 & 2033
- Table 34: North Africa Distributed In-Memory Database Revenue (billion) Forecast, by Application 2020 & 2033
- Table 35: South Africa Distributed In-Memory Database Revenue (billion) Forecast, by Application 2020 & 2033
- Table 36: Rest of Middle East & Africa Distributed In-Memory Database Revenue (billion) Forecast, by Application 2020 & 2033
- Table 37: Global Distributed In-Memory Database Revenue billion Forecast, by Application 2020 & 2033
- Table 38: Global Distributed In-Memory Database Revenue billion Forecast, by Types 2020 & 2033
- Table 39: Global Distributed In-Memory Database Revenue billion Forecast, by Country 2020 & 2033
- Table 40: China Distributed In-Memory Database Revenue (billion) Forecast, by Application 2020 & 2033
- Table 41: India Distributed In-Memory Database Revenue (billion) Forecast, by Application 2020 & 2033
- Table 42: Japan Distributed In-Memory Database Revenue (billion) Forecast, by Application 2020 & 2033
- Table 43: South Korea Distributed In-Memory Database Revenue (billion) Forecast, by Application 2020 & 2033
- Table 44: ASEAN Distributed In-Memory Database Revenue (billion) Forecast, by Application 2020 & 2033
- Table 45: Oceania Distributed In-Memory Database Revenue (billion) Forecast, by Application 2020 & 2033
- Table 46: Rest of Asia Pacific Distributed In-Memory Database Revenue (billion) Forecast, by Application 2020 & 2033
Frequently Asked Questions
1. What is the projected Compound Annual Growth Rate (CAGR) of the Distributed In-Memory Database?
The projected CAGR is approximately 13.61%.
2. Which companies are prominent players in the Distributed In-Memory Database?
Key companies in the market include Redis Labs, Hazelcast, GridGain Systems, Aerospike, SingleStore, Broadcom, GigaSpaces, ScaleOut Software, Shenzhen Tianyuan DIC Information Technology, Couchbase, VoltDB, Alachisoft, GridGain, TmaxSoft, Oracle, SAP, Microsoft, Amazon, Exasol, Altibase, Apache, ArangoDB, Terracotta, McObject.
3. What are the main segments of the Distributed In-Memory Database?
The market segments include Application, Types.
4. Can you provide details about the market size?
The market size is estimated to be USD 9.96 billion as of 2022.
5. What are some drivers contributing to market growth?
N/A
6. What are the notable trends driving market growth?
N/A
7. Are there any restraints impacting market growth?
N/A
8. Can you provide examples of recent developments in the market?
N/A
9. What pricing options are available for accessing the report?
Pricing options include single-user, multi-user, and enterprise licenses priced at USD 4900.00, USD 7350.00, and USD 9800.00 respectively.
10. Is the market size provided in terms of value or volume?
The market size is provided in terms of value, measured in billion.
11. Are there any specific market keywords associated with the report?
Yes, the market keyword associated with the report is "Distributed In-Memory Database," which aids in identifying and referencing the specific market segment covered.
12. How do I determine which pricing option suits my needs best?
The pricing options vary based on user requirements and access needs. Individual users may opt for single-user licenses, while businesses requiring broader access may choose multi-user or enterprise licenses for cost-effective access to the report.
13. Are there any additional resources or data provided in the Distributed In-Memory Database report?
While the report offers comprehensive insights, it's advisable to review the specific contents or supplementary materials provided to ascertain if additional resources or data are available.
14. How can I stay updated on further developments or reports in the Distributed In-Memory Database?
To stay informed about further developments, trends, and reports in the Distributed In-Memory Database, consider subscribing to industry newsletters, following relevant companies and organizations, or regularly checking reputable industry news sources and publications.
Methodology
Step 1 - Identification of Relevant Samples Size from Population Database


Step 2 - Approaches for Defining Global Market Size (Value, Volume* & Price*)

Note*: In applicable scenarios
Step 3 - Data Sources
Primary Research
- Web Analytics
- Survey Reports
- Research Institute
- Latest Research Reports
- Opinion Leaders
Secondary Research
- Annual Reports
- White Paper
- Latest Press Release
- Industry Association
- Paid Database
- Investor Presentations

Step 4 - Data Triangulation
Involves using different sources of information in order to increase the validity of a study
These sources are likely to be stakeholders in a program - participants, other researchers, program staff, other community members, and so on.
Then we put all data in single framework & apply various statistical tools to find out the dynamic on the market.
During the analysis stage, feedback from the stakeholder groups would be compared to determine areas of agreement as well as areas of divergence