

Key Insights
The global cranberry market, valued at approximately $2.9 billion in 2025, is poised for robust expansion. This growth is propelled by escalating consumer preference for health-centric food and beverage options. An anticipated compound annual growth rate (CAGR) of 4.2% from 2025 to 2033 underscores a positive trajectory for industry stakeholders. Key growth catalysts include the surging popularity of cranberries in functional foods and dietary supplements, attributed to their well-documented antioxidant properties and health benefits, notably support for urinary tract health. Innovations in product diversification, such as dried cranberries, juice blends, and infused snacks, are broadening market reach across diverse consumer segments. While challenges like seasonal production and price fluctuations due to weather and harvest outcomes exist, they are increasingly offset by advancements in cultivation and processing technologies. The processed cranberry segment is projected to lead market share, driven by its extended shelf life and versatile applications. Geographically, North America currently commands the largest market presence, supported by established production hubs and high per capita consumption. However, rising awareness of cranberry benefits in the Asia Pacific and European regions is fueling significant market expansion.

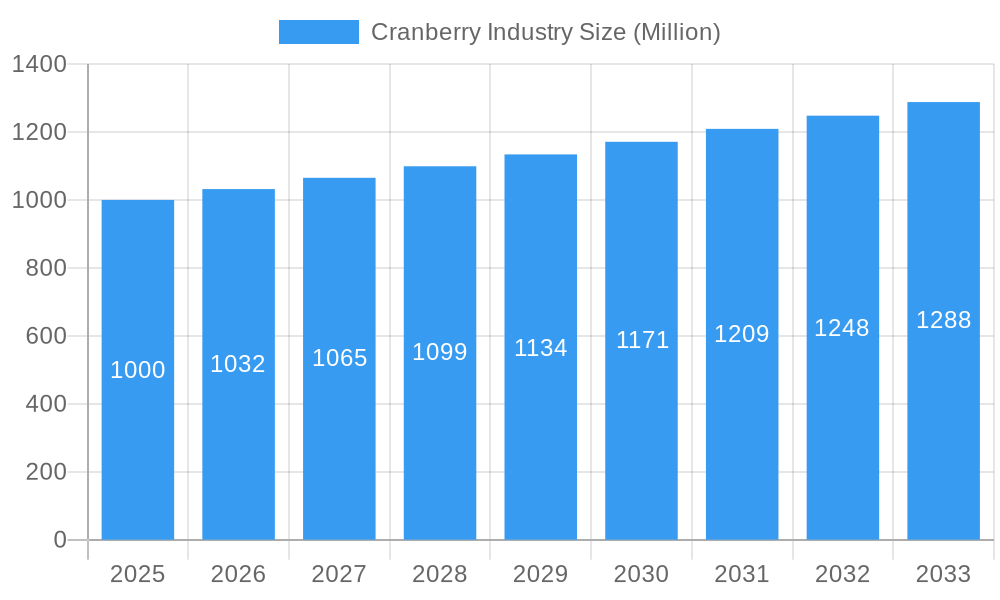
Cranberry Industry Market Size (In Billion)
Key industry participants, including Ocean Spray Cranberries, Inc. and Northland Cranberries, Inc., alongside cooperative associations, are actively pursuing product innovation, brand enhancement, and global market penetration. The competitive environment features a mix of multinational corporations and regional players. Sustained growth hinges on effective health-benefit-focused marketing, ongoing investment in research and development for novel products, and the capacity of producers to meet escalating global demand while prioritizing supply chain sustainability. Market segmentation by product type (fresh, processed, value-added) and application (food & beverage, dietary supplements, pharmaceuticals) offers granular insights into consumer preferences, enabling targeted market strategies. The forecast period of 2025-2033 presents substantial opportunities for advancement within the cranberry sector.
Cranberry Industry Company Market Share
Cranberry Industry Market Report: 2019-2033
This comprehensive report provides an in-depth analysis of the global cranberry industry, offering valuable insights for stakeholders seeking to understand market dynamics, future trends, and key players. With a study period spanning 2019-2033, a base year of 2025, and a forecast period of 2025-2033, this report presents a robust overview of historical performance and future projections, valuing the market in Millions.
Cranberry Industry Market Composition & Trends
The global cranberry market, valued at $XX Million in 2024, is characterized by a moderately concentrated landscape, with key players like Ocean Spray Cranberries, Inc. holding significant market share. However, the emergence of smaller, specialized producers is increasing competition. Innovation is driven by advancements in processing techniques, the development of value-added products, and a growing focus on health and wellness. Regulatory landscapes vary across regions, impacting production practices and labeling requirements. Substitute products, such as other berries, pose a competitive challenge, while the increasing consumer awareness of cranberry's health benefits drives demand. Mergers and acquisitions (M&A) activity has been moderate, with deal values ranging from $XX Million to $XX Million in recent years, primarily focused on expanding product portfolios and market reach.
- Market Share Distribution (2024): Ocean Spray Cranberries, Inc. (40%), Northland Cranberries, Inc. (10%), Others (50%)
- M&A Activity (2019-2024): XX deals totaling $XX Million.
- Key Innovation Catalysts: AI-driven compound profiling, advanced processing technologies, sustainable farming practices.
- End-User Profiles: Food & Beverage manufacturers, dietary supplement companies, pharmaceutical firms, individual consumers.
Cranberry Industry Evolution
The cranberry industry has experienced steady growth over the past five years, with a Compound Annual Growth Rate (CAGR) of XX% from 2019 to 2024. This growth is fueled by rising consumer demand for healthy and functional foods and beverages, coupled with increasing awareness of cranberries' health benefits. Technological advancements in cultivation, harvesting, and processing have enhanced efficiency and product quality. Consumer preferences are shifting towards convenient, value-added products like juices, dried cranberries, and supplements, presenting opportunities for innovation and market expansion. The industry is also facing challenges related to climate change, impacting yields and production costs. Future growth will depend on factors such as consumer demand, technological advancements, and successful adaptation to environmental challenges.
Leading Regions, Countries, or Segments in Cranberry Industry
The North American region, particularly the United States and Canada, remains the dominant player in the global cranberry industry, accounting for over XX% of global production in 2024. This dominance is driven by favorable climatic conditions, established production infrastructure, and strong domestic demand.
- By Product Type: Processed cranberries currently hold the largest market share, driven by high demand for cranberry sauce, juice, and other value-added products.
- By Application: The food and beverage sector accounts for the largest share of cranberry consumption, followed by dietary supplements and a growing pharmaceutical segment leveraging cranberry's health properties.
Key Drivers for North American Dominance:
- Established production infrastructure and expertise.
- Favorable climatic conditions suitable for cranberry cultivation.
- Strong domestic demand fueled by consumer awareness of health benefits.
- Government support and research initiatives promoting cranberry production.
Cranberry Industry Product Innovations
Recent innovations focus on enhancing the functional properties of cranberries, exploring their use in novel food and beverage applications, and developing convenient formats for consumers. This includes the introduction of new cranberry extracts with enhanced bioavailability and the development of functional foods incorporating cranberry ingredients to address specific health needs. Technological advancements in extraction and processing are improving the quality and yield of cranberry-derived ingredients.
Propelling Factors for Cranberry Growth
Technological advancements in cultivation, processing, and preservation techniques are enhancing efficiency and product quality. The growing consumer demand for healthy and functional foods is a significant driver, with cranberries increasingly recognized for their health benefits. Favorable government regulations and support for sustainable farming practices are also contributing to industry growth.
Obstacles in the Cranberry Industry Market
Supply chain disruptions, fluctuating raw material costs, and intense competition from other berry producers pose challenges. Climate change is impacting yields and increasing production costs. Stringent regulatory requirements regarding food safety and labeling add to operational complexities. Competition from substitute products limits market expansion.
Future Opportunities in Cranberry Industry
Expansion into new markets, particularly in Asia and Europe, presents significant opportunities. The development of novel cranberry-based products, utilizing innovative formulations and delivery systems, holds high potential. Leveraging the increasing demand for natural and functional ingredients in various food and beverage applications will drive further growth.
Major Players in the Cranberry Industry Ecosystem
- Ocean Spray Cranberries, Inc.
- Northland Cranberries, Inc.
- Cape Cod Cranberry Growers' Association
- Canadian Cranberry Growers Association
- Wisconsin Cranberry Cooperative
Key Developments in Cranberry Industry
- November 2021: Ocean Spray partners with Brightseed to utilize AI in profiling cranberry compounds and exploring health benefits.
- March 2022: Ocean Spray collaborates with Canomiks to use AI to certify cranberry's biological efficacy.
Strategic Cranberry Industry Market Forecast
The cranberry market is projected to experience significant growth over the forecast period, driven by the factors mentioned above. New product development, expanding consumer awareness, and exploration of novel applications will contribute to a robust market expansion, reaching an estimated value of $XX Million by 2033. Opportunities lie in capitalizing on emerging health trends and leveraging technology to enhance both production and consumer experience.
Cranberry Industry Segmentation
- 1. Production Analysis
- 2. Consumption Analysis
- 3. Import Market Analysis (Value & Volume)
- 4. Export Market Analysis (Value & Volume)
- 5. Price Trend Analysis
Cranberry Industry Segmentation By Geography
-
1. North America
- 1.1. United States
-
2. Europe
- 2.1. Germany
-
3. Asia Pacific
- 3.1. China
-
4. South America
- 4.1. Chile
-
5. Africa
- 5.1. South Africa

Cranberry Industry Regional Market Share
Geographic Coverage of Cranberry Industry
Cranberry Industry REPORT HIGHLIGHTS
| Aspects | Details |
|---|---|
| Study Period | 2020-2034 |
| Base Year | 2025 |
| Estimated Year | 2026 |
| Forecast Period | 2026-2034 |
| Historical Period | 2020-2025 |
| Growth Rate | CAGR of 4.2% from 2020-2034 |
| Segmentation |
|
Table of Contents
- 1. Introduction
- 1.1. Research Scope
- 1.2. Market Segmentation
- 1.3. Research Objective
- 1.4. Definitions and Assumptions
- 2. Executive Summary
- 2.1. Market Snapshot
- 3. Market Dynamics
- 3.1. Market Drivers
- 3.2. Market Restrains
- 3.3. Market Trends
- 3.4. Market Opportunities
- 4. Market Factor Analysis
- 4.1. Porters Five Forces
- 4.1.1. Bargaining Power of Suppliers
- 4.1.2. Bargaining Power of Buyers
- 4.1.3. Threat of New Entrants
- 4.1.4. Threat of Substitutes
- 4.1.5. Competitive Rivalry
- 4.2. PESTEL analysis
- 4.3. BCG Analysis
- 4.3.1. Stars (High Growth, High Market Share)
- 4.3.2. Cash Cows (Low Growth, High Market Share)
- 4.3.3. Question Mark (High Growth, Low Market Share)
- 4.3.4. Dogs (Low Growth, Low Market Share)
- 4.4. Ansoff Matrix Analysis
- 4.5. Supply Chain Analysis
- 4.6. Regulatory Landscape
- 4.7. Current Market Potential and Opportunity Assessment (TAM–SAM–SOM Framework)
- 4.8. DMV Analyst Note
- 4.1. Porters Five Forces
- 5. Market Analysis, Insights and Forecast 2021-2033
- 5.1. Market Analysis, Insights and Forecast - by Production Analysis
- 5.2. Market Analysis, Insights and Forecast - by Consumption Analysis
- 5.3. Market Analysis, Insights and Forecast - by Import Market Analysis (Value & Volume)
- 5.4. Market Analysis, Insights and Forecast - by Export Market Analysis (Value & Volume)
- 5.5. Market Analysis, Insights and Forecast - by Price Trend Analysis
- 5.6. Market Analysis, Insights and Forecast - by Region
- 5.6.1. North America
- 5.6.2. Europe
- 5.6.3. Asia Pacific
- 5.6.4. South America
- 5.6.5. Africa
- 6. Global Cranberry Industry Analysis, Insights and Forecast, 2021-2033
- 6.1. Market Analysis, Insights and Forecast - by Production Analysis
- 6.2. Market Analysis, Insights and Forecast - by Consumption Analysis
- 6.3. Market Analysis, Insights and Forecast - by Import Market Analysis (Value & Volume)
- 6.4. Market Analysis, Insights and Forecast - by Export Market Analysis (Value & Volume)
- 6.5. Market Analysis, Insights and Forecast - by Price Trend Analysis
- 7. North America Cranberry Industry Analysis, Insights and Forecast, 2020-2032
- 7.1. Market Analysis, Insights and Forecast - by Production Analysis
- 7.2. Market Analysis, Insights and Forecast - by Consumption Analysis
- 7.3. Market Analysis, Insights and Forecast - by Import Market Analysis (Value & Volume)
- 7.4. Market Analysis, Insights and Forecast - by Export Market Analysis (Value & Volume)
- 7.5. Market Analysis, Insights and Forecast - by Price Trend Analysis
- 8. Europe Cranberry Industry Analysis, Insights and Forecast, 2020-2032
- 8.1. Market Analysis, Insights and Forecast - by Production Analysis
- 8.2. Market Analysis, Insights and Forecast - by Consumption Analysis
- 8.3. Market Analysis, Insights and Forecast - by Import Market Analysis (Value & Volume)
- 8.4. Market Analysis, Insights and Forecast - by Export Market Analysis (Value & Volume)
- 8.5. Market Analysis, Insights and Forecast - by Price Trend Analysis
- 9. Asia Pacific Cranberry Industry Analysis, Insights and Forecast, 2020-2032
- 9.1. Market Analysis, Insights and Forecast - by Production Analysis
- 9.2. Market Analysis, Insights and Forecast - by Consumption Analysis
- 9.3. Market Analysis, Insights and Forecast - by Import Market Analysis (Value & Volume)
- 9.4. Market Analysis, Insights and Forecast - by Export Market Analysis (Value & Volume)
- 9.5. Market Analysis, Insights and Forecast - by Price Trend Analysis
- 10. South America Cranberry Industry Analysis, Insights and Forecast, 2020-2032
- 10.1. Market Analysis, Insights and Forecast - by Production Analysis
- 10.2. Market Analysis, Insights and Forecast - by Consumption Analysis
- 10.3. Market Analysis, Insights and Forecast - by Import Market Analysis (Value & Volume)
- 10.4. Market Analysis, Insights and Forecast - by Export Market Analysis (Value & Volume)
- 10.5. Market Analysis, Insights and Forecast - by Price Trend Analysis
- 11. Africa Cranberry Industry Analysis, Insights and Forecast, 2020-2032
- 11.1. Market Analysis, Insights and Forecast - by Production Analysis
- 11.2. Market Analysis, Insights and Forecast - by Consumption Analysis
- 11.3. Market Analysis, Insights and Forecast - by Import Market Analysis (Value & Volume)
- 11.4. Market Analysis, Insights and Forecast - by Export Market Analysis (Value & Volume)
- 11.5. Market Analysis, Insights and Forecast - by Price Trend Analysis
- 12. Competitive Analysis
- 12.1. Company Profiles
- 12.1.1 Ocean Spray Cranberries Inc.
- 12.1.1.1. Company Overview
- 12.1.1.2. Products
- 12.1.1.3. Company Financials
- 12.1.1.4. SWOT Analysis
- 12.1.2 Northland Cranberries Inc.
- 12.1.2.1. Company Overview
- 12.1.2.2. Products
- 12.1.2.3. Company Financials
- 12.1.2.4. SWOT Analysis
- 12.1.3 Cape Cod Cranberry Growers' Association
- 12.1.3.1. Company Overview
- 12.1.3.2. Products
- 12.1.3.3. Company Financials
- 12.1.3.4. SWOT Analysis
- 12.1.4 Canadian Cranberry Growers Association
- 12.1.4.1. Company Overview
- 12.1.4.2. Products
- 12.1.4.3. Company Financials
- 12.1.4.4. SWOT Analysis
- 12.1.5 Wisconsin Cranberry Cooperative
- 12.1.5.1. Company Overview
- 12.1.5.2. Products
- 12.1.5.3. Company Financials
- 12.1.5.4. SWOT Analysis
- 12.1.1 Ocean Spray Cranberries Inc.
- 12.2. Market Entropy
- 12.2.1 Company's Key Areas Served
- 12.2.2 Recent Developments
- 12.3. Company Market Share Analysis 2025
- 12.3.1 Top 5 Companies Market Share Analysis
- 12.3.2 Top 3 Companies Market Share Analysis
- 12.4. List of Potential Customers
- 13. Research Methodology
List of Figures
- Figure 1: Global Cranberry Industry Revenue Breakdown (billion, %) by Region 2025 & 2033
- Figure 2: North America Cranberry Industry Revenue (billion), by Production Analysis 2025 & 2033
- Figure 3: North America Cranberry Industry Revenue Share (%), by Production Analysis 2025 & 2033
- Figure 4: North America Cranberry Industry Revenue (billion), by Consumption Analysis 2025 & 2033
- Figure 5: North America Cranberry Industry Revenue Share (%), by Consumption Analysis 2025 & 2033
- Figure 6: North America Cranberry Industry Revenue (billion), by Import Market Analysis (Value & Volume) 2025 & 2033
- Figure 7: North America Cranberry Industry Revenue Share (%), by Import Market Analysis (Value & Volume) 2025 & 2033
- Figure 8: North America Cranberry Industry Revenue (billion), by Export Market Analysis (Value & Volume) 2025 & 2033
- Figure 9: North America Cranberry Industry Revenue Share (%), by Export Market Analysis (Value & Volume) 2025 & 2033
- Figure 10: North America Cranberry Industry Revenue (billion), by Price Trend Analysis 2025 & 2033
- Figure 11: North America Cranberry Industry Revenue Share (%), by Price Trend Analysis 2025 & 2033
- Figure 12: North America Cranberry Industry Revenue (billion), by Country 2025 & 2033
- Figure 13: North America Cranberry Industry Revenue Share (%), by Country 2025 & 2033
- Figure 14: Europe Cranberry Industry Revenue (billion), by Production Analysis 2025 & 2033
- Figure 15: Europe Cranberry Industry Revenue Share (%), by Production Analysis 2025 & 2033
- Figure 16: Europe Cranberry Industry Revenue (billion), by Consumption Analysis 2025 & 2033
- Figure 17: Europe Cranberry Industry Revenue Share (%), by Consumption Analysis 2025 & 2033
- Figure 18: Europe Cranberry Industry Revenue (billion), by Import Market Analysis (Value & Volume) 2025 & 2033
- Figure 19: Europe Cranberry Industry Revenue Share (%), by Import Market Analysis (Value & Volume) 2025 & 2033
- Figure 20: Europe Cranberry Industry Revenue (billion), by Export Market Analysis (Value & Volume) 2025 & 2033
- Figure 21: Europe Cranberry Industry Revenue Share (%), by Export Market Analysis (Value & Volume) 2025 & 2033
- Figure 22: Europe Cranberry Industry Revenue (billion), by Price Trend Analysis 2025 & 2033
- Figure 23: Europe Cranberry Industry Revenue Share (%), by Price Trend Analysis 2025 & 2033
- Figure 24: Europe Cranberry Industry Revenue (billion), by Country 2025 & 2033
- Figure 25: Europe Cranberry Industry Revenue Share (%), by Country 2025 & 2033
- Figure 26: Asia Pacific Cranberry Industry Revenue (billion), by Production Analysis 2025 & 2033
- Figure 27: Asia Pacific Cranberry Industry Revenue Share (%), by Production Analysis 2025 & 2033
- Figure 28: Asia Pacific Cranberry Industry Revenue (billion), by Consumption Analysis 2025 & 2033
- Figure 29: Asia Pacific Cranberry Industry Revenue Share (%), by Consumption Analysis 2025 & 2033
- Figure 30: Asia Pacific Cranberry Industry Revenue (billion), by Import Market Analysis (Value & Volume) 2025 & 2033
- Figure 31: Asia Pacific Cranberry Industry Revenue Share (%), by Import Market Analysis (Value & Volume) 2025 & 2033
- Figure 32: Asia Pacific Cranberry Industry Revenue (billion), by Export Market Analysis (Value & Volume) 2025 & 2033
- Figure 33: Asia Pacific Cranberry Industry Revenue Share (%), by Export Market Analysis (Value & Volume) 2025 & 2033
- Figure 34: Asia Pacific Cranberry Industry Revenue (billion), by Price Trend Analysis 2025 & 2033
- Figure 35: Asia Pacific Cranberry Industry Revenue Share (%), by Price Trend Analysis 2025 & 2033
- Figure 36: Asia Pacific Cranberry Industry Revenue (billion), by Country 2025 & 2033
- Figure 37: Asia Pacific Cranberry Industry Revenue Share (%), by Country 2025 & 2033
- Figure 38: South America Cranberry Industry Revenue (billion), by Production Analysis 2025 & 2033
- Figure 39: South America Cranberry Industry Revenue Share (%), by Production Analysis 2025 & 2033
- Figure 40: South America Cranberry Industry Revenue (billion), by Consumption Analysis 2025 & 2033
- Figure 41: South America Cranberry Industry Revenue Share (%), by Consumption Analysis 2025 & 2033
- Figure 42: South America Cranberry Industry Revenue (billion), by Import Market Analysis (Value & Volume) 2025 & 2033
- Figure 43: South America Cranberry Industry Revenue Share (%), by Import Market Analysis (Value & Volume) 2025 & 2033
- Figure 44: South America Cranberry Industry Revenue (billion), by Export Market Analysis (Value & Volume) 2025 & 2033
- Figure 45: South America Cranberry Industry Revenue Share (%), by Export Market Analysis (Value & Volume) 2025 & 2033
- Figure 46: South America Cranberry Industry Revenue (billion), by Price Trend Analysis 2025 & 2033
- Figure 47: South America Cranberry Industry Revenue Share (%), by Price Trend Analysis 2025 & 2033
- Figure 48: South America Cranberry Industry Revenue (billion), by Country 2025 & 2033
- Figure 49: South America Cranberry Industry Revenue Share (%), by Country 2025 & 2033
- Figure 50: Africa Cranberry Industry Revenue (billion), by Production Analysis 2025 & 2033
- Figure 51: Africa Cranberry Industry Revenue Share (%), by Production Analysis 2025 & 2033
- Figure 52: Africa Cranberry Industry Revenue (billion), by Consumption Analysis 2025 & 2033
- Figure 53: Africa Cranberry Industry Revenue Share (%), by Consumption Analysis 2025 & 2033
- Figure 54: Africa Cranberry Industry Revenue (billion), by Import Market Analysis (Value & Volume) 2025 & 2033
- Figure 55: Africa Cranberry Industry Revenue Share (%), by Import Market Analysis (Value & Volume) 2025 & 2033
- Figure 56: Africa Cranberry Industry Revenue (billion), by Export Market Analysis (Value & Volume) 2025 & 2033
- Figure 57: Africa Cranberry Industry Revenue Share (%), by Export Market Analysis (Value & Volume) 2025 & 2033
- Figure 58: Africa Cranberry Industry Revenue (billion), by Price Trend Analysis 2025 & 2033
- Figure 59: Africa Cranberry Industry Revenue Share (%), by Price Trend Analysis 2025 & 2033
- Figure 60: Africa Cranberry Industry Revenue (billion), by Country 2025 & 2033
- Figure 61: Africa Cranberry Industry Revenue Share (%), by Country 2025 & 2033
List of Tables
- Table 1: Global Cranberry Industry Revenue billion Forecast, by Production Analysis 2020 & 2033
- Table 2: Global Cranberry Industry Revenue billion Forecast, by Consumption Analysis 2020 & 2033
- Table 3: Global Cranberry Industry Revenue billion Forecast, by Import Market Analysis (Value & Volume) 2020 & 2033
- Table 4: Global Cranberry Industry Revenue billion Forecast, by Export Market Analysis (Value & Volume) 2020 & 2033
- Table 5: Global Cranberry Industry Revenue billion Forecast, by Price Trend Analysis 2020 & 2033
- Table 6: Global Cranberry Industry Revenue billion Forecast, by Region 2020 & 2033
- Table 7: Global Cranberry Industry Revenue billion Forecast, by Production Analysis 2020 & 2033
- Table 8: Global Cranberry Industry Revenue billion Forecast, by Consumption Analysis 2020 & 2033
- Table 9: Global Cranberry Industry Revenue billion Forecast, by Import Market Analysis (Value & Volume) 2020 & 2033
- Table 10: Global Cranberry Industry Revenue billion Forecast, by Export Market Analysis (Value & Volume) 2020 & 2033
- Table 11: Global Cranberry Industry Revenue billion Forecast, by Price Trend Analysis 2020 & 2033
- Table 12: Global Cranberry Industry Revenue billion Forecast, by Country 2020 & 2033
- Table 13: United States Cranberry Industry Revenue (billion) Forecast, by Application 2020 & 2033
- Table 14: Global Cranberry Industry Revenue billion Forecast, by Production Analysis 2020 & 2033
- Table 15: Global Cranberry Industry Revenue billion Forecast, by Consumption Analysis 2020 & 2033
- Table 16: Global Cranberry Industry Revenue billion Forecast, by Import Market Analysis (Value & Volume) 2020 & 2033
- Table 17: Global Cranberry Industry Revenue billion Forecast, by Export Market Analysis (Value & Volume) 2020 & 2033
- Table 18: Global Cranberry Industry Revenue billion Forecast, by Price Trend Analysis 2020 & 2033
- Table 19: Global Cranberry Industry Revenue billion Forecast, by Country 2020 & 2033
- Table 20: Germany Cranberry Industry Revenue (billion) Forecast, by Application 2020 & 2033
- Table 21: Global Cranberry Industry Revenue billion Forecast, by Production Analysis 2020 & 2033
- Table 22: Global Cranberry Industry Revenue billion Forecast, by Consumption Analysis 2020 & 2033
- Table 23: Global Cranberry Industry Revenue billion Forecast, by Import Market Analysis (Value & Volume) 2020 & 2033
- Table 24: Global Cranberry Industry Revenue billion Forecast, by Export Market Analysis (Value & Volume) 2020 & 2033
- Table 25: Global Cranberry Industry Revenue billion Forecast, by Price Trend Analysis 2020 & 2033
- Table 26: Global Cranberry Industry Revenue billion Forecast, by Country 2020 & 2033
- Table 27: China Cranberry Industry Revenue (billion) Forecast, by Application 2020 & 2033
- Table 28: Global Cranberry Industry Revenue billion Forecast, by Production Analysis 2020 & 2033
- Table 29: Global Cranberry Industry Revenue billion Forecast, by Consumption Analysis 2020 & 2033
- Table 30: Global Cranberry Industry Revenue billion Forecast, by Import Market Analysis (Value & Volume) 2020 & 2033
- Table 31: Global Cranberry Industry Revenue billion Forecast, by Export Market Analysis (Value & Volume) 2020 & 2033
- Table 32: Global Cranberry Industry Revenue billion Forecast, by Price Trend Analysis 2020 & 2033
- Table 33: Global Cranberry Industry Revenue billion Forecast, by Country 2020 & 2033
- Table 34: Chile Cranberry Industry Revenue (billion) Forecast, by Application 2020 & 2033
- Table 35: Global Cranberry Industry Revenue billion Forecast, by Production Analysis 2020 & 2033
- Table 36: Global Cranberry Industry Revenue billion Forecast, by Consumption Analysis 2020 & 2033
- Table 37: Global Cranberry Industry Revenue billion Forecast, by Import Market Analysis (Value & Volume) 2020 & 2033
- Table 38: Global Cranberry Industry Revenue billion Forecast, by Export Market Analysis (Value & Volume) 2020 & 2033
- Table 39: Global Cranberry Industry Revenue billion Forecast, by Price Trend Analysis 2020 & 2033
- Table 40: Global Cranberry Industry Revenue billion Forecast, by Country 2020 & 2033
- Table 41: South Africa Cranberry Industry Revenue (billion) Forecast, by Application 2020 & 2033
Frequently Asked Questions
1. What is the projected Compound Annual Growth Rate (CAGR) of the Cranberry Industry?
The projected CAGR is approximately 4.2%.
2. Which companies are prominent players in the Cranberry Industry?
Key companies in the market include Ocean Spray Cranberries, Inc. , Northland Cranberries, Inc. , Cape Cod Cranberry Growers' Association , Canadian Cranberry Growers Association, Wisconsin Cranberry Cooperative .
3. What are the main segments of the Cranberry Industry?
The market segments include Production Analysis, Consumption Analysis, Import Market Analysis (Value & Volume), Export Market Analysis (Value & Volume), Price Trend Analysis.
4. Can you provide details about the market size?
The market size is estimated to be USD 2.9 billion as of 2022.
5. What are some drivers contributing to market growth?
Rise in Percentage of Area Harvested Under Almond Cultivation; Demand for Healthy Snacking Options.
6. What are the notable trends driving market growth?
Increasing Demand from Processing Industry.
7. Are there any restraints impacting market growth?
Water Scarcity in Almond Producing Regions; Drop in the Prices of Almonds.
8. Can you provide examples of recent developments in the market?
March 2022: Ocean Spray Cranberries, Inc., the agricultural cooperative owned by more than 700 farmer families, and Canomiks, a startup technology company transforming the functional food and beverage industry, announced research leveraging Canomiks' A.I. based technology platform to test and certify the biological efficacy of the cranberry. The relationship with Canomiks, through Ocean Spray's existing partnership with the incubator Plug and Play, enables the company further to validate the superfruit nature of cranberry's biological efficacy.
9. What pricing options are available for accessing the report?
Pricing options include single-user, multi-user, and enterprise licenses priced at USD 4750, USD 5250, and USD 8750 respectively.
10. Is the market size provided in terms of value or volume?
The market size is provided in terms of value, measured in billion.
11. Are there any specific market keywords associated with the report?
Yes, the market keyword associated with the report is "Cranberry Industry," which aids in identifying and referencing the specific market segment covered.
12. How do I determine which pricing option suits my needs best?
The pricing options vary based on user requirements and access needs. Individual users may opt for single-user licenses, while businesses requiring broader access may choose multi-user or enterprise licenses for cost-effective access to the report.
13. Are there any additional resources or data provided in the Cranberry Industry report?
While the report offers comprehensive insights, it's advisable to review the specific contents or supplementary materials provided to ascertain if additional resources or data are available.
14. How can I stay updated on further developments or reports in the Cranberry Industry?
To stay informed about further developments, trends, and reports in the Cranberry Industry, consider subscribing to industry newsletters, following relevant companies and organizations, or regularly checking reputable industry news sources and publications.
Methodology
Step 1 - Identification of Relevant Samples Size from Population Database


Step 2 - Approaches for Defining Global Market Size (Value, Volume* & Price*)

Note*: In applicable scenarios
Step 3 - Data Sources
Primary Research
- Web Analytics
- Survey Reports
- Research Institute
- Latest Research Reports
- Opinion Leaders
Secondary Research
- Annual Reports
- White Paper
- Latest Press Release
- Industry Association
- Paid Database
- Investor Presentations

Step 4 - Data Triangulation
Involves using different sources of information in order to increase the validity of a study
These sources are likely to be stakeholders in a program - participants, other researchers, program staff, other community members, and so on.
Then we put all data in single framework & apply various statistical tools to find out the dynamic on the market.
During the analysis stage, feedback from the stakeholder groups would be compared to determine areas of agreement as well as areas of divergence