

Key Insights
The global blood meal market, valued at approximately $1.29 billion in 2025, is projected for robust expansion, driven by escalating demand for sustainable and cost-effective animal feed and fertilizer solutions. A Compound Annual Growth Rate (CAGR) of 3.63% from 2025 to 2033 signals significant market growth, particularly within the animal feed sector. Key growth drivers include a rising global population and increased demand for protein-rich animal products. Poultry feed currently dominates the market due to blood meal's high protein content and its positive effects on poultry health and productivity. The market is segmented by source (porcine, poultry, ruminant) and application (poultry, porcine, ruminant, aqua feed, pest deterrent, organic fertilizer), offering opportunities for specialized product development and targeted marketing. Growing awareness of sustainable agricultural practices and the pursuit of environmentally friendly fertilizer alternatives further support market expansion. While regulatory challenges and raw material cost volatility may present hurdles, the long-term outlook for the blood meal market remains strong, bolstered by ongoing innovation in processing and application technologies.
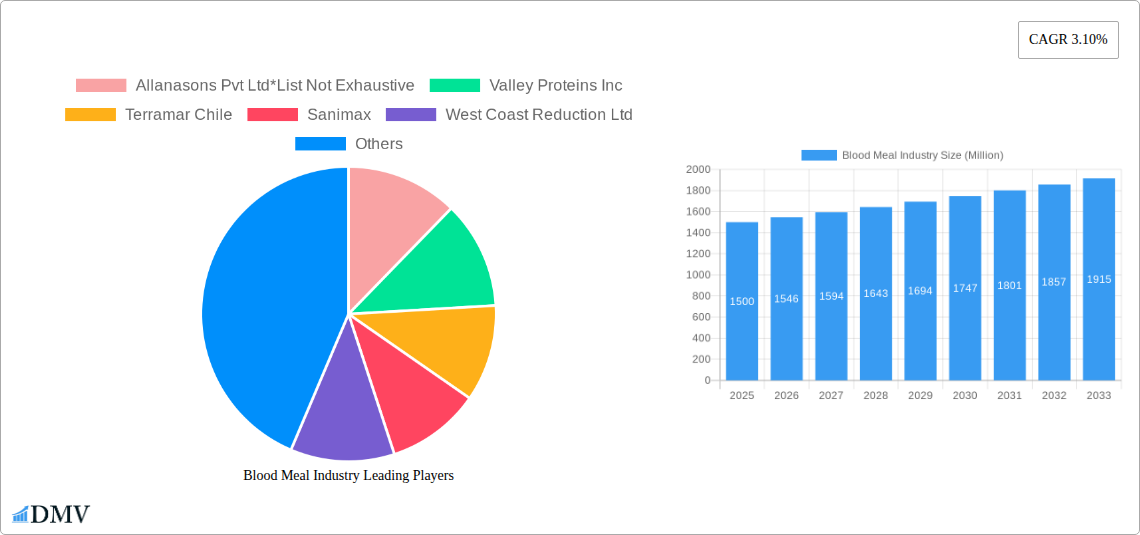
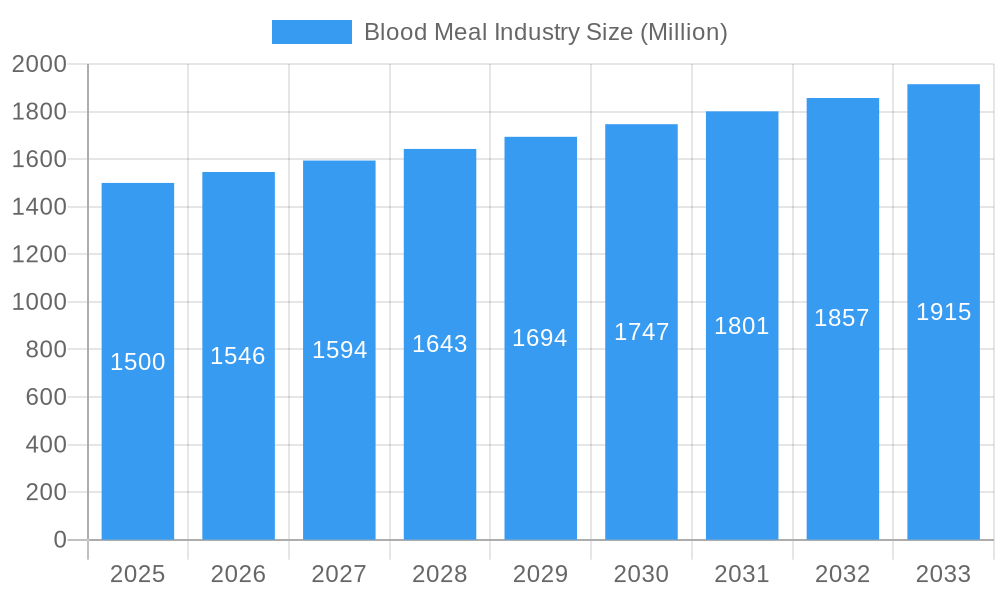
Blood Meal Industry Market Size (In Billion)
Despite potential constraints, such as stringent regional regulations on blood meal sourcing and processing, several factors indicate a promising market future. The growing interest in organic and sustainable agriculture significantly boosts demand for blood meal as a natural fertilizer. Emerging research into blood meal's efficacy as a natural pest deterrent also presents substantial market potential. Leading industry players, including Allanasons Pvt Ltd, Valley Proteins Inc, and Darling Ingredients, are instrumental in driving innovation and market expansion. Regional growth disparities are expected, with North America and Asia Pacific anticipated to lead due to extensive agricultural sectors and rising consumer demand for animal products. Continued development of efficient and hygienic processing techniques will be crucial for navigating regulatory complexities and ensuring sustainable market growth.
Blood Meal Industry Company Market Share
Blood Meal Industry: A Comprehensive Market Report (2019-2033)
This insightful report provides a comprehensive analysis of the global blood meal industry, offering crucial insights for stakeholders seeking to navigate this dynamic market. The study covers the period 2019-2033, with a base year of 2025 and a forecast period of 2025-2033. The report meticulously examines market size, growth trajectories, key players, and emerging trends, providing actionable intelligence for strategic decision-making. With a focus on key segments including porcine, poultry, and ruminant blood, and applications spanning animal feed (poultry, porcine, ruminant, aqua), natural pest deterrent, and organic fertilizer, this report is an indispensable resource for investors, industry professionals, and researchers. The total market value is projected to reach xx Million by 2033.
Blood Meal Industry Market Composition & Trends
This section delves into the competitive landscape of the blood meal industry, analyzing market concentration, innovation drivers, regulatory frameworks, substitute products, end-user profiles, and significant M&A activities. The market is characterized by a moderate level of concentration, with several key players holding substantial market share. However, smaller, regional players also contribute significantly to the overall market volume.
- Market Share Distribution: Darling Ingredients holds an estimated xx% market share, followed by Valley Proteins Inc. with xx%, and other players such as Sanimax and West Coast Reduction Ltd. each holding approximately xx% (2025 estimates). The remaining share is dispersed among numerous smaller companies.
- M&A Activity: Significant mergers and acquisitions have shaped the industry's landscape. For instance, Darling Ingredients' acquisition of Fasa Group in May 2022 for USD 560 Million significantly expanded its global reach. This highlights the strategic importance of consolidating market share and gaining access to new technologies and markets. The total value of M&A deals in the blood meal industry from 2019 to 2024 was approximately xx Million USD.
- Innovation Catalysts: Growing demand for sustainable and cost-effective animal feed and fertilizer solutions is a major catalyst for innovation within the industry. The focus is on improving processing techniques for higher yield, expanding applications beyond traditional animal feed, and developing more environmentally friendly production methods.
- Regulatory Landscape: Regulations related to animal feed safety and environmental protection vary across different regions, impacting the industry's operational dynamics and influencing the cost structure. This adds a layer of complexity for companies operating in multiple jurisdictions.
- Substitute Products: Soybean meal and other protein sources compete with blood meal as animal feed ingredients, posing a constant competitive pressure. However, the unique nutritional profile of blood meal provides a competitive edge in certain applications.
Blood Meal Industry Industry Evolution
The blood meal industry has witnessed a period of steady growth from 2019 to 2024, driven by factors such as rising global meat production, increasing demand for animal feed, and the growing acceptance of blood meal as a sustainable agricultural input. The market experienced a Compound Annual Growth Rate (CAGR) of xx% during this period. Technological advancements have also played a crucial role, leading to more efficient processing techniques and improved product quality. Consumer demand for sustainably sourced animal feed and organic fertilizers is driving the market toward more environmentally conscious production methods. Innovation in processing technologies, such as enhanced drying and sterilization methods, is improving the quality and safety of blood meal products. The market is expected to maintain a CAGR of xx% from 2025 to 2033, reaching xx Million USD by 2033. This growth is influenced by increasing investments in sustainable agriculture and animal feed solutions, coupled with favorable regulatory environments in key regions. The shift towards more sustainable and environmentally friendly agricultural practices is further bolstering the demand for blood meal as an eco-friendly organic fertilizer.
Leading Regions, Countries, or Segments in Blood Meal Industry
The North American region currently dominates the global blood meal market, driven by high meat production, established processing infrastructure, and strong regulatory frameworks. Within this region, the United States holds a significant market share. However, other regions, particularly in Asia and Europe, are demonstrating considerable growth potential.
Key Drivers:
- High Meat Production: Regions with high meat production (North America, Europe, Asia) naturally generate large volumes of blood byproduct, providing a readily available raw material for blood meal production.
- Investment Trends: Significant investments in animal feed processing and sustainable agriculture are propelling growth in various regions.
- Regulatory Support: Supportive government policies and regulations promoting sustainable agricultural practices are boosting market adoption in several key countries.
Dominance Factors: North America's dominance stems from established processing capacity, readily available raw materials from significant livestock populations, and a well-developed distribution network. The region benefits from technological advancements and economies of scale, giving North American producers a competitive advantage. Europe is a significant market due to established agricultural practices and regulatory frameworks.
Blood Meal Industry Product Innovations
Recent innovations in the blood meal industry have focused on enhancing product quality and expanding application areas. These include the development of specialized blood meal formulations with improved nutrient profiles for specific animal feed applications, as well as the refinement of processes to reduce odor and improve handling. Advanced drying and sterilization techniques are resulting in products with longer shelf life and improved safety. The focus on sustainability and environmental friendliness is driving innovations in reducing the carbon footprint of blood meal production, enhancing its marketability as a sustainable agricultural solution.
Propelling Factors for Blood Meal Industry Growth
Several factors are contributing to the growth of the blood meal industry. Technological advancements are enhancing efficiency and product quality. The rising global meat production provides an abundant source of raw material. Growing awareness of the benefits of blood meal as a sustainable and cost-effective fertilizer is expanding its application beyond animal feed. Supportive government policies and regulations in some regions are further incentivizing the production and use of blood meal.
Obstacles in the Blood Meal Industry Market
Challenges to growth include fluctuating raw material prices (blood availability linked to livestock cycles), varying regulations across different geographies that can create compliance hurdles, and competition from substitute protein sources. Supply chain disruptions, particularly in the wake of global events, can impact raw material availability and lead to production delays. Furthermore, concerns related to potential contaminants in blood meal and the need for consistent product quality management pose ongoing challenges.
Future Opportunities in Blood Meal Industry
Future opportunities lie in expanding into new geographical markets, particularly in developing economies with growing livestock sectors. The development of novel blood meal-based products with enhanced functional properties and applications in niche markets presents considerable potential. Technological advancements in processing, storage and transportation can improve efficiency and reduce cost. Finally, growing consumer demand for sustainable products will benefit the blood meal industry.
Major Players in the Blood Meal Industry Ecosystem
- Allanasons Pvt Ltd List Not Exhaustive
- Valley Proteins Inc
- Terramar Chile
- Sanimax
- West Coast Reduction Ltd
- Darling Ingredients
- Boyer Valley Company LLC
- Agro-industrial Complex Backa Topola LTD
- The Fetrell Company
Key Developments in Blood Meal Industry Industry
- May 2022: Darling Ingredients acquired Fasa Group for USD 560 Million, significantly expanding its global footprint and product offerings. This strategic move enhanced Darling Ingredients’ market position and diversified its product portfolio.
- January 2020: Darling Ingredients acquired 100% equity in EnviroFlight, increasing its investment in innovative specialty proteins and feed sustainability. This acquisition demonstrated a commitment to sustainable practices and innovation within the blood meal sector.
Strategic Blood Meal Industry Market Forecast
The blood meal industry is poised for sustained growth driven by the increasing demand for sustainable and cost-effective protein sources for animal feed and fertilizers. Technological advancements, coupled with the expanding global livestock sector, are key catalysts for this growth. The focus on sustainable agriculture and reducing the environmental impact of animal farming will further fuel the demand for blood meal as a sustainable and efficient alternative. The market is expected to experience significant expansion in the coming years, particularly in regions with growing meat production and supportive regulatory frameworks.
Blood Meal Industry Segmentation
- 1. Production Analysis
- 2. Consumption Analysis
- 3. Import Market Analysis (Value & Volume)
- 4. Export Market Analysis (Value & Volume)
- 5. Price Trend Analysis
Blood Meal Industry Segmentation By Geography
-
1. North America
- 1.1. United States
- 1.2. Canada
- 1.3. Mexico
-
2. South America
- 2.1. Brazil
- 2.2. Argentina
- 2.3. Rest of South America
-
3. Europe
- 3.1. United Kingdom
- 3.2. Germany
- 3.3. France
- 3.4. Italy
- 3.5. Spain
- 3.6. Russia
- 3.7. Benelux
- 3.8. Nordics
- 3.9. Rest of Europe
-
4. Middle East & Africa
- 4.1. Turkey
- 4.2. Israel
- 4.3. GCC
- 4.4. North Africa
- 4.5. South Africa
- 4.6. Rest of Middle East & Africa
-
5. Asia Pacific
- 5.1. China
- 5.2. India
- 5.3. Japan
- 5.4. South Korea
- 5.5. ASEAN
- 5.6. Oceania
- 5.7. Rest of Asia Pacific
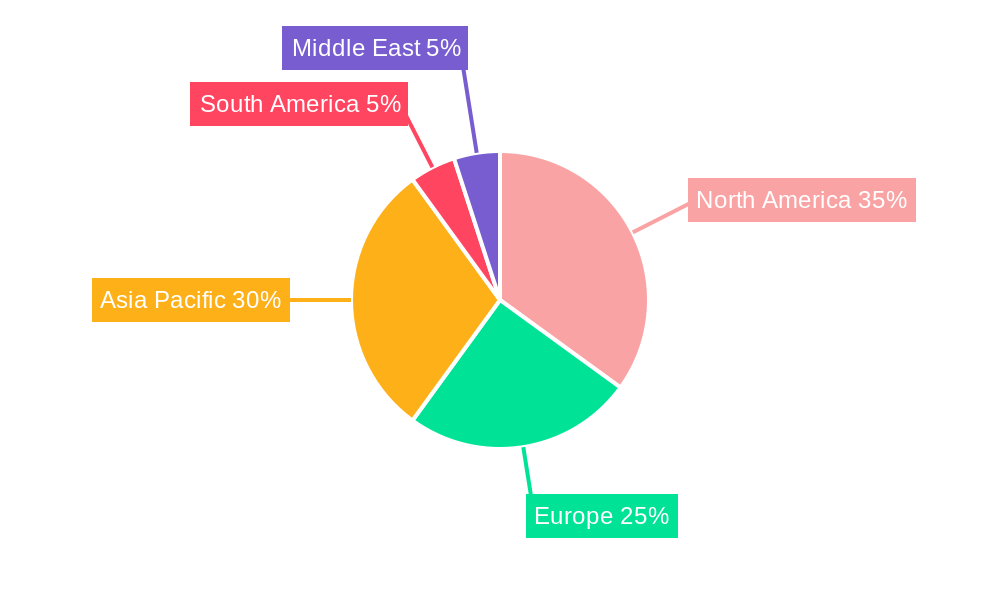
Blood Meal Industry Regional Market Share
Geographic Coverage of Blood Meal Industry
Blood Meal Industry REPORT HIGHLIGHTS
| Aspects | Details |
|---|---|
| Study Period | 2020-2034 |
| Base Year | 2025 |
| Estimated Year | 2026 |
| Forecast Period | 2026-2034 |
| Historical Period | 2020-2025 |
| Growth Rate | CAGR of 3.63% from 2020-2034 |
| Segmentation |
|
Table of Contents
- 1. Introduction
- 1.1. Research Scope
- 1.2. Market Segmentation
- 1.3. Research Objective
- 1.4. Definitions and Assumptions
- 2. Executive Summary
- 2.1. Market Snapshot
- 3. Market Dynamics
- 3.1. Market Drivers
- 3.2. Market Restrains
- 3.3. Market Trends
- 3.4. Market Opportunities
- 4. Market Factor Analysis
- 4.1. Porters Five Forces
- 4.1.1. Bargaining Power of Suppliers
- 4.1.2. Bargaining Power of Buyers
- 4.1.3. Threat of New Entrants
- 4.1.4. Threat of Substitutes
- 4.1.5. Competitive Rivalry
- 4.2. PESTEL analysis
- 4.3. BCG Analysis
- 4.3.1. Stars (High Growth, High Market Share)
- 4.3.2. Cash Cows (Low Growth, High Market Share)
- 4.3.3. Question Mark (High Growth, Low Market Share)
- 4.3.4. Dogs (Low Growth, Low Market Share)
- 4.4. Ansoff Matrix Analysis
- 4.5. Supply Chain Analysis
- 4.6. Regulatory Landscape
- 4.7. Current Market Potential and Opportunity Assessment (TAM–SAM–SOM Framework)
- 4.8. DMV Analyst Note
- 4.1. Porters Five Forces
- 5. Market Analysis, Insights and Forecast 2021-2033
- 5.1. Market Analysis, Insights and Forecast - by Production Analysis
- 5.2. Market Analysis, Insights and Forecast - by Consumption Analysis
- 5.3. Market Analysis, Insights and Forecast - by Import Market Analysis (Value & Volume)
- 5.4. Market Analysis, Insights and Forecast - by Export Market Analysis (Value & Volume)
- 5.5. Market Analysis, Insights and Forecast - by Price Trend Analysis
- 5.6. Market Analysis, Insights and Forecast - by Region
- 5.6.1. North America
- 5.6.2. South America
- 5.6.3. Europe
- 5.6.4. Middle East & Africa
- 5.6.5. Asia Pacific
- 6. Global Blood Meal Industry Analysis, Insights and Forecast, 2021-2033
- 6.1. Market Analysis, Insights and Forecast - by Production Analysis
- 6.2. Market Analysis, Insights and Forecast - by Consumption Analysis
- 6.3. Market Analysis, Insights and Forecast - by Import Market Analysis (Value & Volume)
- 6.4. Market Analysis, Insights and Forecast - by Export Market Analysis (Value & Volume)
- 6.5. Market Analysis, Insights and Forecast - by Price Trend Analysis
- 7. North America Blood Meal Industry Analysis, Insights and Forecast, 2020-2032
- 7.1. Market Analysis, Insights and Forecast - by Production Analysis
- 7.2. Market Analysis, Insights and Forecast - by Consumption Analysis
- 7.3. Market Analysis, Insights and Forecast - by Import Market Analysis (Value & Volume)
- 7.4. Market Analysis, Insights and Forecast - by Export Market Analysis (Value & Volume)
- 7.5. Market Analysis, Insights and Forecast - by Price Trend Analysis
- 8. South America Blood Meal Industry Analysis, Insights and Forecast, 2020-2032
- 8.1. Market Analysis, Insights and Forecast - by Production Analysis
- 8.2. Market Analysis, Insights and Forecast - by Consumption Analysis
- 8.3. Market Analysis, Insights and Forecast - by Import Market Analysis (Value & Volume)
- 8.4. Market Analysis, Insights and Forecast - by Export Market Analysis (Value & Volume)
- 8.5. Market Analysis, Insights and Forecast - by Price Trend Analysis
- 9. Europe Blood Meal Industry Analysis, Insights and Forecast, 2020-2032
- 9.1. Market Analysis, Insights and Forecast - by Production Analysis
- 9.2. Market Analysis, Insights and Forecast - by Consumption Analysis
- 9.3. Market Analysis, Insights and Forecast - by Import Market Analysis (Value & Volume)
- 9.4. Market Analysis, Insights and Forecast - by Export Market Analysis (Value & Volume)
- 9.5. Market Analysis, Insights and Forecast - by Price Trend Analysis
- 10. Middle East & Africa Blood Meal Industry Analysis, Insights and Forecast, 2020-2032
- 10.1. Market Analysis, Insights and Forecast - by Production Analysis
- 10.2. Market Analysis, Insights and Forecast - by Consumption Analysis
- 10.3. Market Analysis, Insights and Forecast - by Import Market Analysis (Value & Volume)
- 10.4. Market Analysis, Insights and Forecast - by Export Market Analysis (Value & Volume)
- 10.5. Market Analysis, Insights and Forecast - by Price Trend Analysis
- 11. Asia Pacific Blood Meal Industry Analysis, Insights and Forecast, 2020-2032
- 11.1. Market Analysis, Insights and Forecast - by Production Analysis
- 11.2. Market Analysis, Insights and Forecast - by Consumption Analysis
- 11.3. Market Analysis, Insights and Forecast - by Import Market Analysis (Value & Volume)
- 11.4. Market Analysis, Insights and Forecast - by Export Market Analysis (Value & Volume)
- 11.5. Market Analysis, Insights and Forecast - by Price Trend Analysis
- 12. Competitive Analysis
- 12.1. Company Profiles
- 12.1.1 Allanasons Pvt Ltd*List Not Exhaustive
- 12.1.1.1. Company Overview
- 12.1.1.2. Products
- 12.1.1.3. Company Financials
- 12.1.1.4. SWOT Analysis
- 12.1.2 Valley Proteins Inc
- 12.1.2.1. Company Overview
- 12.1.2.2. Products
- 12.1.2.3. Company Financials
- 12.1.2.4. SWOT Analysis
- 12.1.3 Terramar Chile
- 12.1.3.1. Company Overview
- 12.1.3.2. Products
- 12.1.3.3. Company Financials
- 12.1.3.4. SWOT Analysis
- 12.1.4 Sanimax
- 12.1.4.1. Company Overview
- 12.1.4.2. Products
- 12.1.4.3. Company Financials
- 12.1.4.4. SWOT Analysis
- 12.1.5 West Coast Reduction Ltd
- 12.1.5.1. Company Overview
- 12.1.5.2. Products
- 12.1.5.3. Company Financials
- 12.1.5.4. SWOT Analysis
- 12.1.6 Darling Ingredients
- 12.1.6.1. Company Overview
- 12.1.6.2. Products
- 12.1.6.3. Company Financials
- 12.1.6.4. SWOT Analysis
- 12.1.7 Boyer Valley Company LLC
- 12.1.7.1. Company Overview
- 12.1.7.2. Products
- 12.1.7.3. Company Financials
- 12.1.7.4. SWOT Analysis
- 12.1.8 Agro-industrial Complex Backa Topola LTD
- 12.1.8.1. Company Overview
- 12.1.8.2. Products
- 12.1.8.3. Company Financials
- 12.1.8.4. SWOT Analysis
- 12.1.9 The Fetrell Company
- 12.1.9.1. Company Overview
- 12.1.9.2. Products
- 12.1.9.3. Company Financials
- 12.1.9.4. SWOT Analysis
- 12.1.1 Allanasons Pvt Ltd*List Not Exhaustive
- 12.2. Market Entropy
- 12.2.1 Company's Key Areas Served
- 12.2.2 Recent Developments
- 12.3. Company Market Share Analysis 2025
- 12.3.1 Top 5 Companies Market Share Analysis
- 12.3.2 Top 3 Companies Market Share Analysis
- 12.4. List of Potential Customers
- 13. Research Methodology
List of Figures
- Figure 1: Global Blood Meal Industry Revenue Breakdown (billion, %) by Region 2025 & 2033
- Figure 2: North America Blood Meal Industry Revenue (billion), by Production Analysis 2025 & 2033
- Figure 3: North America Blood Meal Industry Revenue Share (%), by Production Analysis 2025 & 2033
- Figure 4: North America Blood Meal Industry Revenue (billion), by Consumption Analysis 2025 & 2033
- Figure 5: North America Blood Meal Industry Revenue Share (%), by Consumption Analysis 2025 & 2033
- Figure 6: North America Blood Meal Industry Revenue (billion), by Import Market Analysis (Value & Volume) 2025 & 2033
- Figure 7: North America Blood Meal Industry Revenue Share (%), by Import Market Analysis (Value & Volume) 2025 & 2033
- Figure 8: North America Blood Meal Industry Revenue (billion), by Export Market Analysis (Value & Volume) 2025 & 2033
- Figure 9: North America Blood Meal Industry Revenue Share (%), by Export Market Analysis (Value & Volume) 2025 & 2033
- Figure 10: North America Blood Meal Industry Revenue (billion), by Price Trend Analysis 2025 & 2033
- Figure 11: North America Blood Meal Industry Revenue Share (%), by Price Trend Analysis 2025 & 2033
- Figure 12: North America Blood Meal Industry Revenue (billion), by Country 2025 & 2033
- Figure 13: North America Blood Meal Industry Revenue Share (%), by Country 2025 & 2033
- Figure 14: South America Blood Meal Industry Revenue (billion), by Production Analysis 2025 & 2033
- Figure 15: South America Blood Meal Industry Revenue Share (%), by Production Analysis 2025 & 2033
- Figure 16: South America Blood Meal Industry Revenue (billion), by Consumption Analysis 2025 & 2033
- Figure 17: South America Blood Meal Industry Revenue Share (%), by Consumption Analysis 2025 & 2033
- Figure 18: South America Blood Meal Industry Revenue (billion), by Import Market Analysis (Value & Volume) 2025 & 2033
- Figure 19: South America Blood Meal Industry Revenue Share (%), by Import Market Analysis (Value & Volume) 2025 & 2033
- Figure 20: South America Blood Meal Industry Revenue (billion), by Export Market Analysis (Value & Volume) 2025 & 2033
- Figure 21: South America Blood Meal Industry Revenue Share (%), by Export Market Analysis (Value & Volume) 2025 & 2033
- Figure 22: South America Blood Meal Industry Revenue (billion), by Price Trend Analysis 2025 & 2033
- Figure 23: South America Blood Meal Industry Revenue Share (%), by Price Trend Analysis 2025 & 2033
- Figure 24: South America Blood Meal Industry Revenue (billion), by Country 2025 & 2033
- Figure 25: South America Blood Meal Industry Revenue Share (%), by Country 2025 & 2033
- Figure 26: Europe Blood Meal Industry Revenue (billion), by Production Analysis 2025 & 2033
- Figure 27: Europe Blood Meal Industry Revenue Share (%), by Production Analysis 2025 & 2033
- Figure 28: Europe Blood Meal Industry Revenue (billion), by Consumption Analysis 2025 & 2033
- Figure 29: Europe Blood Meal Industry Revenue Share (%), by Consumption Analysis 2025 & 2033
- Figure 30: Europe Blood Meal Industry Revenue (billion), by Import Market Analysis (Value & Volume) 2025 & 2033
- Figure 31: Europe Blood Meal Industry Revenue Share (%), by Import Market Analysis (Value & Volume) 2025 & 2033
- Figure 32: Europe Blood Meal Industry Revenue (billion), by Export Market Analysis (Value & Volume) 2025 & 2033
- Figure 33: Europe Blood Meal Industry Revenue Share (%), by Export Market Analysis (Value & Volume) 2025 & 2033
- Figure 34: Europe Blood Meal Industry Revenue (billion), by Price Trend Analysis 2025 & 2033
- Figure 35: Europe Blood Meal Industry Revenue Share (%), by Price Trend Analysis 2025 & 2033
- Figure 36: Europe Blood Meal Industry Revenue (billion), by Country 2025 & 2033
- Figure 37: Europe Blood Meal Industry Revenue Share (%), by Country 2025 & 2033
- Figure 38: Middle East & Africa Blood Meal Industry Revenue (billion), by Production Analysis 2025 & 2033
- Figure 39: Middle East & Africa Blood Meal Industry Revenue Share (%), by Production Analysis 2025 & 2033
- Figure 40: Middle East & Africa Blood Meal Industry Revenue (billion), by Consumption Analysis 2025 & 2033
- Figure 41: Middle East & Africa Blood Meal Industry Revenue Share (%), by Consumption Analysis 2025 & 2033
- Figure 42: Middle East & Africa Blood Meal Industry Revenue (billion), by Import Market Analysis (Value & Volume) 2025 & 2033
- Figure 43: Middle East & Africa Blood Meal Industry Revenue Share (%), by Import Market Analysis (Value & Volume) 2025 & 2033
- Figure 44: Middle East & Africa Blood Meal Industry Revenue (billion), by Export Market Analysis (Value & Volume) 2025 & 2033
- Figure 45: Middle East & Africa Blood Meal Industry Revenue Share (%), by Export Market Analysis (Value & Volume) 2025 & 2033
- Figure 46: Middle East & Africa Blood Meal Industry Revenue (billion), by Price Trend Analysis 2025 & 2033
- Figure 47: Middle East & Africa Blood Meal Industry Revenue Share (%), by Price Trend Analysis 2025 & 2033
- Figure 48: Middle East & Africa Blood Meal Industry Revenue (billion), by Country 2025 & 2033
- Figure 49: Middle East & Africa Blood Meal Industry Revenue Share (%), by Country 2025 & 2033
- Figure 50: Asia Pacific Blood Meal Industry Revenue (billion), by Production Analysis 2025 & 2033
- Figure 51: Asia Pacific Blood Meal Industry Revenue Share (%), by Production Analysis 2025 & 2033
- Figure 52: Asia Pacific Blood Meal Industry Revenue (billion), by Consumption Analysis 2025 & 2033
- Figure 53: Asia Pacific Blood Meal Industry Revenue Share (%), by Consumption Analysis 2025 & 2033
- Figure 54: Asia Pacific Blood Meal Industry Revenue (billion), by Import Market Analysis (Value & Volume) 2025 & 2033
- Figure 55: Asia Pacific Blood Meal Industry Revenue Share (%), by Import Market Analysis (Value & Volume) 2025 & 2033
- Figure 56: Asia Pacific Blood Meal Industry Revenue (billion), by Export Market Analysis (Value & Volume) 2025 & 2033
- Figure 57: Asia Pacific Blood Meal Industry Revenue Share (%), by Export Market Analysis (Value & Volume) 2025 & 2033
- Figure 58: Asia Pacific Blood Meal Industry Revenue (billion), by Price Trend Analysis 2025 & 2033
- Figure 59: Asia Pacific Blood Meal Industry Revenue Share (%), by Price Trend Analysis 2025 & 2033
- Figure 60: Asia Pacific Blood Meal Industry Revenue (billion), by Country 2025 & 2033
- Figure 61: Asia Pacific Blood Meal Industry Revenue Share (%), by Country 2025 & 2033
List of Tables
- Table 1: Global Blood Meal Industry Revenue billion Forecast, by Production Analysis 2020 & 2033
- Table 2: Global Blood Meal Industry Revenue billion Forecast, by Consumption Analysis 2020 & 2033
- Table 3: Global Blood Meal Industry Revenue billion Forecast, by Import Market Analysis (Value & Volume) 2020 & 2033
- Table 4: Global Blood Meal Industry Revenue billion Forecast, by Export Market Analysis (Value & Volume) 2020 & 2033
- Table 5: Global Blood Meal Industry Revenue billion Forecast, by Price Trend Analysis 2020 & 2033
- Table 6: Global Blood Meal Industry Revenue billion Forecast, by Region 2020 & 2033
- Table 7: Global Blood Meal Industry Revenue billion Forecast, by Production Analysis 2020 & 2033
- Table 8: Global Blood Meal Industry Revenue billion Forecast, by Consumption Analysis 2020 & 2033
- Table 9: Global Blood Meal Industry Revenue billion Forecast, by Import Market Analysis (Value & Volume) 2020 & 2033
- Table 10: Global Blood Meal Industry Revenue billion Forecast, by Export Market Analysis (Value & Volume) 2020 & 2033
- Table 11: Global Blood Meal Industry Revenue billion Forecast, by Price Trend Analysis 2020 & 2033
- Table 12: Global Blood Meal Industry Revenue billion Forecast, by Country 2020 & 2033
- Table 13: United States Blood Meal Industry Revenue (billion) Forecast, by Application 2020 & 2033
- Table 14: Canada Blood Meal Industry Revenue (billion) Forecast, by Application 2020 & 2033
- Table 15: Mexico Blood Meal Industry Revenue (billion) Forecast, by Application 2020 & 2033
- Table 16: Global Blood Meal Industry Revenue billion Forecast, by Production Analysis 2020 & 2033
- Table 17: Global Blood Meal Industry Revenue billion Forecast, by Consumption Analysis 2020 & 2033
- Table 18: Global Blood Meal Industry Revenue billion Forecast, by Import Market Analysis (Value & Volume) 2020 & 2033
- Table 19: Global Blood Meal Industry Revenue billion Forecast, by Export Market Analysis (Value & Volume) 2020 & 2033
- Table 20: Global Blood Meal Industry Revenue billion Forecast, by Price Trend Analysis 2020 & 2033
- Table 21: Global Blood Meal Industry Revenue billion Forecast, by Country 2020 & 2033
- Table 22: Brazil Blood Meal Industry Revenue (billion) Forecast, by Application 2020 & 2033
- Table 23: Argentina Blood Meal Industry Revenue (billion) Forecast, by Application 2020 & 2033
- Table 24: Rest of South America Blood Meal Industry Revenue (billion) Forecast, by Application 2020 & 2033
- Table 25: Global Blood Meal Industry Revenue billion Forecast, by Production Analysis 2020 & 2033
- Table 26: Global Blood Meal Industry Revenue billion Forecast, by Consumption Analysis 2020 & 2033
- Table 27: Global Blood Meal Industry Revenue billion Forecast, by Import Market Analysis (Value & Volume) 2020 & 2033
- Table 28: Global Blood Meal Industry Revenue billion Forecast, by Export Market Analysis (Value & Volume) 2020 & 2033
- Table 29: Global Blood Meal Industry Revenue billion Forecast, by Price Trend Analysis 2020 & 2033
- Table 30: Global Blood Meal Industry Revenue billion Forecast, by Country 2020 & 2033
- Table 31: United Kingdom Blood Meal Industry Revenue (billion) Forecast, by Application 2020 & 2033
- Table 32: Germany Blood Meal Industry Revenue (billion) Forecast, by Application 2020 & 2033
- Table 33: France Blood Meal Industry Revenue (billion) Forecast, by Application 2020 & 2033
- Table 34: Italy Blood Meal Industry Revenue (billion) Forecast, by Application 2020 & 2033
- Table 35: Spain Blood Meal Industry Revenue (billion) Forecast, by Application 2020 & 2033
- Table 36: Russia Blood Meal Industry Revenue (billion) Forecast, by Application 2020 & 2033
- Table 37: Benelux Blood Meal Industry Revenue (billion) Forecast, by Application 2020 & 2033
- Table 38: Nordics Blood Meal Industry Revenue (billion) Forecast, by Application 2020 & 2033
- Table 39: Rest of Europe Blood Meal Industry Revenue (billion) Forecast, by Application 2020 & 2033
- Table 40: Global Blood Meal Industry Revenue billion Forecast, by Production Analysis 2020 & 2033
- Table 41: Global Blood Meal Industry Revenue billion Forecast, by Consumption Analysis 2020 & 2033
- Table 42: Global Blood Meal Industry Revenue billion Forecast, by Import Market Analysis (Value & Volume) 2020 & 2033
- Table 43: Global Blood Meal Industry Revenue billion Forecast, by Export Market Analysis (Value & Volume) 2020 & 2033
- Table 44: Global Blood Meal Industry Revenue billion Forecast, by Price Trend Analysis 2020 & 2033
- Table 45: Global Blood Meal Industry Revenue billion Forecast, by Country 2020 & 2033
- Table 46: Turkey Blood Meal Industry Revenue (billion) Forecast, by Application 2020 & 2033
- Table 47: Israel Blood Meal Industry Revenue (billion) Forecast, by Application 2020 & 2033
- Table 48: GCC Blood Meal Industry Revenue (billion) Forecast, by Application 2020 & 2033
- Table 49: North Africa Blood Meal Industry Revenue (billion) Forecast, by Application 2020 & 2033
- Table 50: South Africa Blood Meal Industry Revenue (billion) Forecast, by Application 2020 & 2033
- Table 51: Rest of Middle East & Africa Blood Meal Industry Revenue (billion) Forecast, by Application 2020 & 2033
- Table 52: Global Blood Meal Industry Revenue billion Forecast, by Production Analysis 2020 & 2033
- Table 53: Global Blood Meal Industry Revenue billion Forecast, by Consumption Analysis 2020 & 2033
- Table 54: Global Blood Meal Industry Revenue billion Forecast, by Import Market Analysis (Value & Volume) 2020 & 2033
- Table 55: Global Blood Meal Industry Revenue billion Forecast, by Export Market Analysis (Value & Volume) 2020 & 2033
- Table 56: Global Blood Meal Industry Revenue billion Forecast, by Price Trend Analysis 2020 & 2033
- Table 57: Global Blood Meal Industry Revenue billion Forecast, by Country 2020 & 2033
- Table 58: China Blood Meal Industry Revenue (billion) Forecast, by Application 2020 & 2033
- Table 59: India Blood Meal Industry Revenue (billion) Forecast, by Application 2020 & 2033
- Table 60: Japan Blood Meal Industry Revenue (billion) Forecast, by Application 2020 & 2033
- Table 61: South Korea Blood Meal Industry Revenue (billion) Forecast, by Application 2020 & 2033
- Table 62: ASEAN Blood Meal Industry Revenue (billion) Forecast, by Application 2020 & 2033
- Table 63: Oceania Blood Meal Industry Revenue (billion) Forecast, by Application 2020 & 2033
- Table 64: Rest of Asia Pacific Blood Meal Industry Revenue (billion) Forecast, by Application 2020 & 2033
Frequently Asked Questions
1. What is the projected Compound Annual Growth Rate (CAGR) of the Blood Meal Industry?
The projected CAGR is approximately 3.63%.
2. Which companies are prominent players in the Blood Meal Industry?
Key companies in the market include Allanasons Pvt Ltd*List Not Exhaustive, Valley Proteins Inc, Terramar Chile, Sanimax, West Coast Reduction Ltd, Darling Ingredients, Boyer Valley Company LLC, Agro-industrial Complex Backa Topola LTD, The Fetrell Company.
3. What are the main segments of the Blood Meal Industry?
The market segments include Production Analysis, Consumption Analysis, Import Market Analysis (Value & Volume), Export Market Analysis (Value & Volume), Price Trend Analysis.
4. Can you provide details about the market size?
The market size is estimated to be USD 1.29 billion as of 2022.
5. What are some drivers contributing to market growth?
Adoption of Organic and Eco-friendly Farming Practices; Declining Area of Arable Land and Rising Food Security Concerns.
6. What are the notable trends driving market growth?
Growing Demand for Animal Meat is creating Market Opportunities.
7. Are there any restraints impacting market growth?
High Demand for Conventional and Synthetic Products; Lack of Awareness and Other Factors Limiting the Adoption of Agricultural Inoculants.
8. Can you provide examples of recent developments in the market?
May 2022: Darling Ingredients acquired Fasa Group for USD 560 million to expand its geographical presence and new product offerings in the global blood meal market.
9. What pricing options are available for accessing the report?
Pricing options include single-user, multi-user, and enterprise licenses priced at USD 4750, USD 5250, and USD 8750 respectively.
10. Is the market size provided in terms of value or volume?
The market size is provided in terms of value, measured in billion.
11. Are there any specific market keywords associated with the report?
Yes, the market keyword associated with the report is "Blood Meal Industry," which aids in identifying and referencing the specific market segment covered.
12. How do I determine which pricing option suits my needs best?
The pricing options vary based on user requirements and access needs. Individual users may opt for single-user licenses, while businesses requiring broader access may choose multi-user or enterprise licenses for cost-effective access to the report.
13. Are there any additional resources or data provided in the Blood Meal Industry report?
While the report offers comprehensive insights, it's advisable to review the specific contents or supplementary materials provided to ascertain if additional resources or data are available.
14. How can I stay updated on further developments or reports in the Blood Meal Industry?
To stay informed about further developments, trends, and reports in the Blood Meal Industry, consider subscribing to industry newsletters, following relevant companies and organizations, or regularly checking reputable industry news sources and publications.
Methodology
Step 1 - Identification of Relevant Samples Size from Population Database


Step 2 - Approaches for Defining Global Market Size (Value, Volume* & Price*)

Note*: In applicable scenarios
Step 3 - Data Sources
Primary Research
- Web Analytics
- Survey Reports
- Research Institute
- Latest Research Reports
- Opinion Leaders
Secondary Research
- Annual Reports
- White Paper
- Latest Press Release
- Industry Association
- Paid Database
- Investor Presentations

Step 4 - Data Triangulation
Involves using different sources of information in order to increase the validity of a study
These sources are likely to be stakeholders in a program - participants, other researchers, program staff, other community members, and so on.
Then we put all data in single framework & apply various statistical tools to find out the dynamic on the market.
During the analysis stage, feedback from the stakeholder groups would be compared to determine areas of agreement as well as areas of divergence