

Key Insights
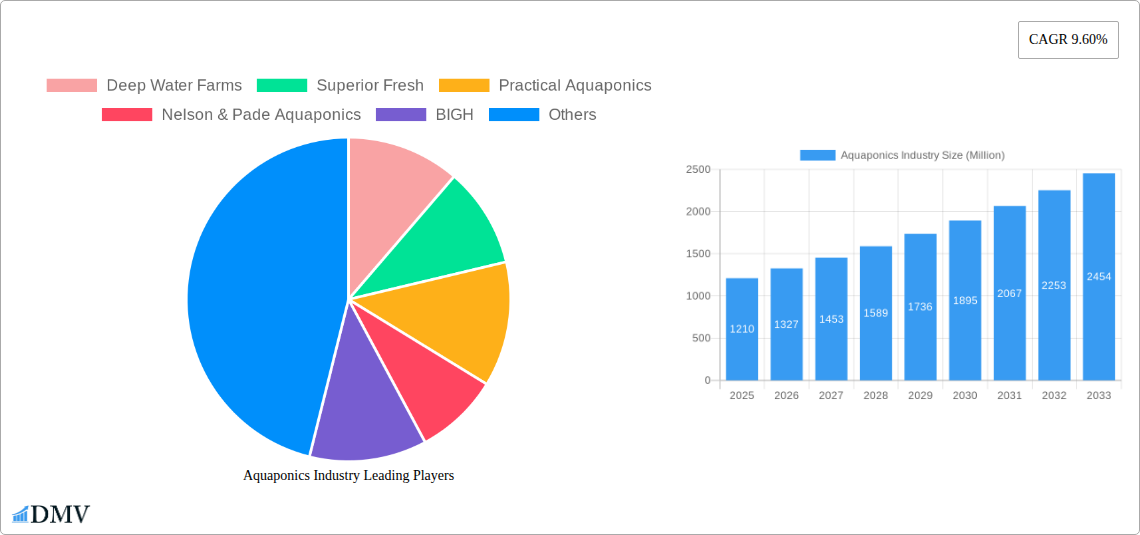
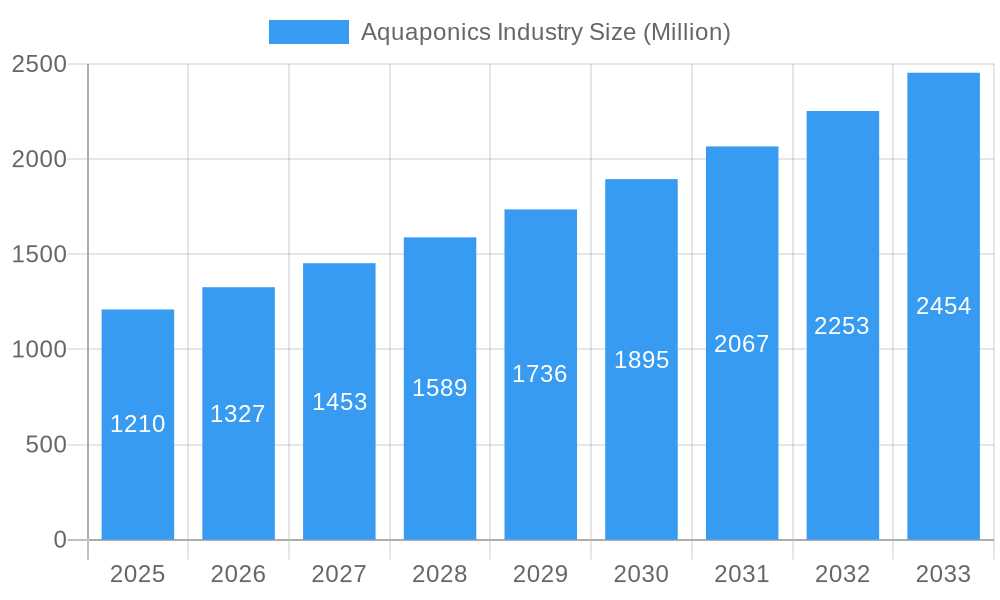
The global aquaponics market, valued at $1.21 billion in 2025, is projected to experience robust growth, driven by increasing consumer demand for sustainable and eco-friendly food production methods. A Compound Annual Growth Rate (CAGR) of 9.60% from 2025 to 2033 indicates significant market expansion. Key drivers include rising concerns about food security and the environmental impact of conventional farming, coupled with growing consumer awareness of the health benefits associated with aquaponics-produced food. The market is segmented by various factors, including the type of ebb and flow system (e.g., Nutrient Film Technique, Deep Water Culture), facility type (greenhouses, vertical farms), fish species (tilapia, catfish, carp, etc.), and growing system. Technological advancements in aquaponics systems, such as automated controls and optimized water management, are further boosting market growth. While challenges exist, such as the high initial investment costs and the need for specialized knowledge, the overall market outlook remains positive.
Aquaponics Industry Market Size (In Billion)
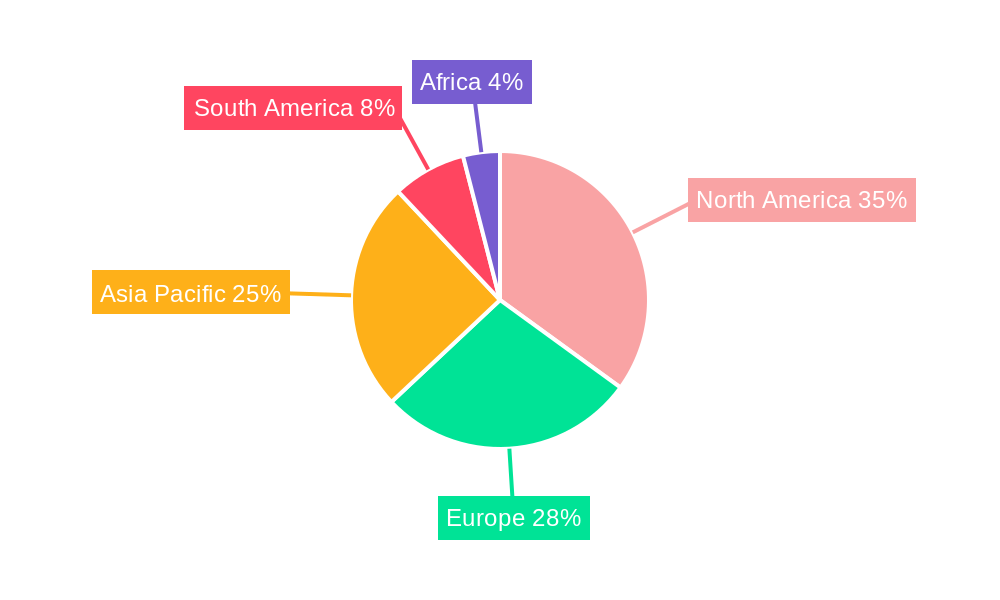
The increasing adoption of aquaponics in both commercial and residential settings fuels market expansion. North America and Europe currently hold significant market shares, driven by strong consumer interest and government support for sustainable agriculture. However, Asia-Pacific is poised for rapid growth due to its large population and expanding aquaculture sector. The diverse range of fish and plant species suitable for aquaponics offers opportunities for diversification and specialization within the market. Companies are focusing on developing innovative systems and expanding their product offerings to cater to the growing demand. The future growth of the aquaponics market hinges on overcoming challenges related to scalability, technological advancements to reduce costs, and raising consumer awareness, particularly in emerging markets.
Aquaponics Industry Company Market Share
Aquaponics Industry Market Report: 2019-2033
This comprehensive report provides a detailed analysis of the global aquaponics industry, projecting a market value exceeding $XX Million by 2033. The study period covers 2019-2033, with 2025 serving as the base and estimated year. The report offers invaluable insights for stakeholders, investors, and industry participants seeking to understand market dynamics, future trends, and growth opportunities within this burgeoning sector. It incorporates detailed analysis across various segments, including fish types, facility types, and growing systems, highlighting key players and their strategic maneuvers.
Aquaponics Industry Market Composition & Trends
This section evaluates the competitive landscape of the aquaponics market, examining market concentration, innovation drivers, regulatory factors, substitute products, end-user profiles, and mergers and acquisitions (M&A) activity. The global aquaponics market exhibits a moderately fragmented structure, with several key players and numerous smaller operators. Market share distribution in 2025 is estimated as follows: Deep Water Farms (10%), Superior Fresh (8%), Practical Aquaponics (7%), and others accounting for the remaining 75%. Innovation in areas such as automation, water purification, and integrated systems is driving market growth. Regulatory frameworks concerning water usage, waste management, and food safety significantly influence market expansion. Competition from conventional agriculture and hydroponics necessitates continuous innovation and cost optimization. M&A activities within the industry are expected to accelerate, driven by consolidation efforts and access to new technologies. The total value of M&A deals between 2019 and 2024 is estimated at $XX Million.
- Market Concentration: Moderately Fragmented
- Innovation Catalysts: Automation, water purification, integrated systems
- Regulatory Landscape: Water usage, waste management, food safety regulations
- Substitute Products: Conventional agriculture, hydroponics
- End-User Profiles: Commercial farms, restaurants, individual consumers
- M&A Activity: Significant consolidation expected, with total deal value (2019-2024) estimated at $XX Million.
Aquaponics Industry Evolution
The aquaponics industry has witnessed significant evolution since 2019, marked by increasing market awareness, technological advancements, and evolving consumer preferences. From 2019 to 2024, the market experienced a Compound Annual Growth Rate (CAGR) of XX%, driven by rising demand for sustainable food production and increasing consumer awareness of environmental sustainability. Technological advancements, such as automated systems and improved water management technologies, have significantly enhanced efficiency and reduced operational costs. Consumer demand for locally sourced, fresh produce and environmentally friendly food production methods is another critical factor driving market growth. We forecast a CAGR of XX% from 2025 to 2033, reaching a market value exceeding $XX Million by 2033. This growth will be fueled by advancements in vertical farming, increasing adoption of innovative growing systems, and expansion into new geographical markets. The adoption rate of aquaponics systems across commercial and individual consumers is projected to reach XX% by 2033.
Leading Regions, Countries, or Segments in Aquaponics Industry
The North American region currently dominates the global aquaponics market, driven by significant investments in research and development, supportive government policies, and a high demand for sustainably produced food. Within North America, the United States holds the largest market share. Among segments, the Ebb and Flow (Flood and Drain) system holds the largest market share due to its relative simplicity and cost-effectiveness. Indoor vertical farms are rapidly gaining traction due to their high yield potential and ability to operate in urban areas. Tilapia remains the most commonly used fish species, owing to its fast growth rate and high tolerance for varied conditions. Media-filled beds continue to be the most widely adopted growing system due to its versatility and ease of implementation.
- Key Drivers for North American Dominance:
- High investment in R&D
- Supportive government policies and funding
- High consumer demand for sustainable food
- Established distribution networks
- Dominant Segments:
- Growing System: Media-Filled Beds
- Fish Type: Tilapia
- Facility Type: Poly or Glass Greenhouses
- Aquaponics System: Ebb and Flow (Flood and Drain)
Aquaponics Industry Product Innovations
Recent innovations in aquaponics include the development of automated control systems, improved water filtration technologies, and the integration of renewable energy sources. These innovations have resulted in increased efficiency, reduced operational costs, and enhanced sustainability. Companies are focusing on developing modular and scalable systems that cater to diverse needs, from small-scale home aquaponics setups to large-scale commercial operations. Unique selling propositions focus on yield optimization, minimized water usage, and ease of operation.
Propelling Factors for Aquaponics Industry Growth
The aquaponics industry's growth is fueled by several factors. Technological advancements, such as automation and improved water management, enhance efficiency and reduce operational costs. Government incentives and supportive policies in many countries promote the adoption of sustainable agricultural practices. Growing consumer awareness of environmental sustainability and demand for locally sourced, fresh produce further accelerate market growth. The increasing availability of affordable and reliable technology is also lowering the barriers to entry for both small-scale and large-scale operations.
Obstacles in the Aquaponics Industry Market
Challenges facing the aquaponics industry include the relatively high initial investment costs, limited access to financing, and complex technical expertise needed for successful operation. Supply chain disruptions, particularly in specialized equipment and fish feed, can significantly impact profitability. Intense competition from conventional agricultural practices poses a considerable hurdle. Furthermore, evolving regulatory landscapes concerning water usage, waste management, and food safety introduce operational complexities and uncertainties.
Future Opportunities in Aquaponics Industry
Future opportunities include expanding into new geographical markets, particularly in developing countries with limited access to fresh produce. The development of integrated, multi-species aquaponics systems holds significant potential. Exploring new markets for aquaponic products, such as high-value crops, can enhance profitability. Developing and deploying user-friendly automated systems and efficient, low-cost recirculating aquaculture systems will broaden access to the technology.
Major Players in the Aquaponics Industry Ecosystem
- Deep Water Farms
- Superior Fresh
- Practical Aquaponics
- Nelson & Pade Aquaponics
- BIGH
- ECF Farm Berli
- Garden City Aquaponics Inc
- Aquaponics USA
- Madhavi Farms
- Ouroboros Farms
- Pentair Aquatic Eco-System Inc (PAES)
Key Developments in Aquaponics Industry Industry
- 2021-Q3: Deep Water Farms launched a new automated aquaponics system.
- 2022-Q1: Superior Fresh acquired a smaller aquaponics competitor, expanding its market share.
- 2023-Q2: Several significant government grants were awarded to support aquaponics research and development initiatives.
- 2024-Q4: A major industry conference showcased innovative technologies and fostered collaborations. (Further developments to be added based on available data).
Strategic Aquaponics Industry Market Forecast
The aquaponics industry is poised for significant growth in the coming years. Continuous technological advancements and increasing consumer demand for sustainable and healthy food will drive market expansion. New market entrants and strategic partnerships will further fuel growth. The global market is expected to witness strong growth, driven by several catalysts such as increasing consumer awareness, supportive government policies, and the development of more efficient and scalable systems. The expanding market will present opportunities for both established players and new entrants, paving the way for continued innovation and wider adoption of aquaponics technologies.
Aquaponics Industry Segmentation
- 1. Production Analysis
- 2. Consumption Analysis
- 3. Import Market Analysis (Value & Volume)
- 4. Export Market Analysis (Value & Volume)
- 5. Price Trend Analysis
Aquaponics Industry Segmentation By Geography
-
1. North America
- 1.1. United States
- 1.2. Canada
- 1.3. Mexico
-
2. South America
- 2.1. Brazil
- 2.2. Argentina
- 2.3. Rest of South America
-
3. Europe
- 3.1. United Kingdom
- 3.2. Germany
- 3.3. France
- 3.4. Italy
- 3.5. Spain
- 3.6. Russia
- 3.7. Benelux
- 3.8. Nordics
- 3.9. Rest of Europe
-
4. Middle East & Africa
- 4.1. Turkey
- 4.2. Israel
- 4.3. GCC
- 4.4. North Africa
- 4.5. South Africa
- 4.6. Rest of Middle East & Africa
-
5. Asia Pacific
- 5.1. China
- 5.2. India
- 5.3. Japan
- 5.4. South Korea
- 5.5. ASEAN
- 5.6. Oceania
- 5.7. Rest of Asia Pacific
Aquaponics Industry Regional Market Share
Geographic Coverage of Aquaponics Industry
Aquaponics Industry REPORT HIGHLIGHTS
| Aspects | Details |
|---|---|
| Study Period | 2020-2034 |
| Base Year | 2025 |
| Estimated Year | 2026 |
| Forecast Period | 2026-2034 |
| Historical Period | 2020-2025 |
| Growth Rate | CAGR of 9.60% from 2020-2034 |
| Segmentation |
|
Table of Contents
- 1. Introduction
- 1.1. Research Scope
- 1.2. Market Segmentation
- 1.3. Research Objective
- 1.4. Definitions and Assumptions
- 2. Executive Summary
- 2.1. Market Snapshot
- 3. Market Dynamics
- 3.1. Market Drivers
- 3.2. Market Restrains
- 3.3. Market Trends
- 3.4. Market Opportunities
- 4. Market Factor Analysis
- 4.1. Porters Five Forces
- 4.1.1. Bargaining Power of Suppliers
- 4.1.2. Bargaining Power of Buyers
- 4.1.3. Threat of New Entrants
- 4.1.4. Threat of Substitutes
- 4.1.5. Competitive Rivalry
- 4.2. PESTEL analysis
- 4.3. BCG Analysis
- 4.3.1. Stars (High Growth, High Market Share)
- 4.3.2. Cash Cows (Low Growth, High Market Share)
- 4.3.3. Question Mark (High Growth, Low Market Share)
- 4.3.4. Dogs (Low Growth, Low Market Share)
- 4.4. Ansoff Matrix Analysis
- 4.5. Supply Chain Analysis
- 4.6. Regulatory Landscape
- 4.7. Current Market Potential and Opportunity Assessment (TAM–SAM–SOM Framework)
- 4.8. DMV Analyst Note
- 4.1. Porters Five Forces
- 5. Market Analysis, Insights and Forecast 2021-2033
- 5.1. Market Analysis, Insights and Forecast - by Production Analysis
- 5.2. Market Analysis, Insights and Forecast - by Consumption Analysis
- 5.3. Market Analysis, Insights and Forecast - by Import Market Analysis (Value & Volume)
- 5.4. Market Analysis, Insights and Forecast - by Export Market Analysis (Value & Volume)
- 5.5. Market Analysis, Insights and Forecast - by Price Trend Analysis
- 5.6. Market Analysis, Insights and Forecast - by Region
- 5.6.1. North America
- 5.6.2. South America
- 5.6.3. Europe
- 5.6.4. Middle East & Africa
- 5.6.5. Asia Pacific
- 6. Global Aquaponics Industry Analysis, Insights and Forecast, 2021-2033
- 6.1. Market Analysis, Insights and Forecast - by Production Analysis
- 6.2. Market Analysis, Insights and Forecast - by Consumption Analysis
- 6.3. Market Analysis, Insights and Forecast - by Import Market Analysis (Value & Volume)
- 6.4. Market Analysis, Insights and Forecast - by Export Market Analysis (Value & Volume)
- 6.5. Market Analysis, Insights and Forecast - by Price Trend Analysis
- 7. North America Aquaponics Industry Analysis, Insights and Forecast, 2020-2032
- 7.1. Market Analysis, Insights and Forecast - by Production Analysis
- 7.2. Market Analysis, Insights and Forecast - by Consumption Analysis
- 7.3. Market Analysis, Insights and Forecast - by Import Market Analysis (Value & Volume)
- 7.4. Market Analysis, Insights and Forecast - by Export Market Analysis (Value & Volume)
- 7.5. Market Analysis, Insights and Forecast - by Price Trend Analysis
- 8. South America Aquaponics Industry Analysis, Insights and Forecast, 2020-2032
- 8.1. Market Analysis, Insights and Forecast - by Production Analysis
- 8.2. Market Analysis, Insights and Forecast - by Consumption Analysis
- 8.3. Market Analysis, Insights and Forecast - by Import Market Analysis (Value & Volume)
- 8.4. Market Analysis, Insights and Forecast - by Export Market Analysis (Value & Volume)
- 8.5. Market Analysis, Insights and Forecast - by Price Trend Analysis
- 9. Europe Aquaponics Industry Analysis, Insights and Forecast, 2020-2032
- 9.1. Market Analysis, Insights and Forecast - by Production Analysis
- 9.2. Market Analysis, Insights and Forecast - by Consumption Analysis
- 9.3. Market Analysis, Insights and Forecast - by Import Market Analysis (Value & Volume)
- 9.4. Market Analysis, Insights and Forecast - by Export Market Analysis (Value & Volume)
- 9.5. Market Analysis, Insights and Forecast - by Price Trend Analysis
- 10. Middle East & Africa Aquaponics Industry Analysis, Insights and Forecast, 2020-2032
- 10.1. Market Analysis, Insights and Forecast - by Production Analysis
- 10.2. Market Analysis, Insights and Forecast - by Consumption Analysis
- 10.3. Market Analysis, Insights and Forecast - by Import Market Analysis (Value & Volume)
- 10.4. Market Analysis, Insights and Forecast - by Export Market Analysis (Value & Volume)
- 10.5. Market Analysis, Insights and Forecast - by Price Trend Analysis
- 11. Asia Pacific Aquaponics Industry Analysis, Insights and Forecast, 2020-2032
- 11.1. Market Analysis, Insights and Forecast - by Production Analysis
- 11.2. Market Analysis, Insights and Forecast - by Consumption Analysis
- 11.3. Market Analysis, Insights and Forecast - by Import Market Analysis (Value & Volume)
- 11.4. Market Analysis, Insights and Forecast - by Export Market Analysis (Value & Volume)
- 11.5. Market Analysis, Insights and Forecast - by Price Trend Analysis
- 12. Competitive Analysis
- 12.1. Company Profiles
- 12.1.1 Deep Water Farms
- 12.1.1.1. Company Overview
- 12.1.1.2. Products
- 12.1.1.3. Company Financials
- 12.1.1.4. SWOT Analysis
- 12.1.2 Superior Fresh
- 12.1.2.1. Company Overview
- 12.1.2.2. Products
- 12.1.2.3. Company Financials
- 12.1.2.4. SWOT Analysis
- 12.1.3 Practical Aquaponics
- 12.1.3.1. Company Overview
- 12.1.3.2. Products
- 12.1.3.3. Company Financials
- 12.1.3.4. SWOT Analysis
- 12.1.4 Nelson & Pade Aquaponics
- 12.1.4.1. Company Overview
- 12.1.4.2. Products
- 12.1.4.3. Company Financials
- 12.1.4.4. SWOT Analysis
- 12.1.5 BIGH
- 12.1.5.1. Company Overview
- 12.1.5.2. Products
- 12.1.5.3. Company Financials
- 12.1.5.4. SWOT Analysis
- 12.1.6 ECF Farm Berli
- 12.1.6.1. Company Overview
- 12.1.6.2. Products
- 12.1.6.3. Company Financials
- 12.1.6.4. SWOT Analysis
- 12.1.7 Garden City Aquaponics Inc
- 12.1.7.1. Company Overview
- 12.1.7.2. Products
- 12.1.7.3. Company Financials
- 12.1.7.4. SWOT Analysis
- 12.1.8 Aquaponics USA
- 12.1.8.1. Company Overview
- 12.1.8.2. Products
- 12.1.8.3. Company Financials
- 12.1.8.4. SWOT Analysis
- 12.1.9 Madhavi Farms
- 12.1.9.1. Company Overview
- 12.1.9.2. Products
- 12.1.9.3. Company Financials
- 12.1.9.4. SWOT Analysis
- 12.1.10 Ouroboros Farms
- 12.1.10.1. Company Overview
- 12.1.10.2. Products
- 12.1.10.3. Company Financials
- 12.1.10.4. SWOT Analysis
- 12.1.11 Pentair Aquatic Eco-System Inc (PAES)
- 12.1.11.1. Company Overview
- 12.1.11.2. Products
- 12.1.11.3. Company Financials
- 12.1.11.4. SWOT Analysis
- 12.1.1 Deep Water Farms
- 12.2. Market Entropy
- 12.2.1 Company's Key Areas Served
- 12.2.2 Recent Developments
- 12.3. Company Market Share Analysis 2025
- 12.3.1 Top 5 Companies Market Share Analysis
- 12.3.2 Top 3 Companies Market Share Analysis
- 12.4. List of Potential Customers
- 13. Research Methodology
List of Figures
- Figure 1: Global Aquaponics Industry Revenue Breakdown (Million, %) by Region 2025 & 2033
- Figure 2: North America Aquaponics Industry Revenue (Million), by Production Analysis 2025 & 2033
- Figure 3: North America Aquaponics Industry Revenue Share (%), by Production Analysis 2025 & 2033
- Figure 4: North America Aquaponics Industry Revenue (Million), by Consumption Analysis 2025 & 2033
- Figure 5: North America Aquaponics Industry Revenue Share (%), by Consumption Analysis 2025 & 2033
- Figure 6: North America Aquaponics Industry Revenue (Million), by Import Market Analysis (Value & Volume) 2025 & 2033
- Figure 7: North America Aquaponics Industry Revenue Share (%), by Import Market Analysis (Value & Volume) 2025 & 2033
- Figure 8: North America Aquaponics Industry Revenue (Million), by Export Market Analysis (Value & Volume) 2025 & 2033
- Figure 9: North America Aquaponics Industry Revenue Share (%), by Export Market Analysis (Value & Volume) 2025 & 2033
- Figure 10: North America Aquaponics Industry Revenue (Million), by Price Trend Analysis 2025 & 2033
- Figure 11: North America Aquaponics Industry Revenue Share (%), by Price Trend Analysis 2025 & 2033
- Figure 12: North America Aquaponics Industry Revenue (Million), by Country 2025 & 2033
- Figure 13: North America Aquaponics Industry Revenue Share (%), by Country 2025 & 2033
- Figure 14: South America Aquaponics Industry Revenue (Million), by Production Analysis 2025 & 2033
- Figure 15: South America Aquaponics Industry Revenue Share (%), by Production Analysis 2025 & 2033
- Figure 16: South America Aquaponics Industry Revenue (Million), by Consumption Analysis 2025 & 2033
- Figure 17: South America Aquaponics Industry Revenue Share (%), by Consumption Analysis 2025 & 2033
- Figure 18: South America Aquaponics Industry Revenue (Million), by Import Market Analysis (Value & Volume) 2025 & 2033
- Figure 19: South America Aquaponics Industry Revenue Share (%), by Import Market Analysis (Value & Volume) 2025 & 2033
- Figure 20: South America Aquaponics Industry Revenue (Million), by Export Market Analysis (Value & Volume) 2025 & 2033
- Figure 21: South America Aquaponics Industry Revenue Share (%), by Export Market Analysis (Value & Volume) 2025 & 2033
- Figure 22: South America Aquaponics Industry Revenue (Million), by Price Trend Analysis 2025 & 2033
- Figure 23: South America Aquaponics Industry Revenue Share (%), by Price Trend Analysis 2025 & 2033
- Figure 24: South America Aquaponics Industry Revenue (Million), by Country 2025 & 2033
- Figure 25: South America Aquaponics Industry Revenue Share (%), by Country 2025 & 2033
- Figure 26: Europe Aquaponics Industry Revenue (Million), by Production Analysis 2025 & 2033
- Figure 27: Europe Aquaponics Industry Revenue Share (%), by Production Analysis 2025 & 2033
- Figure 28: Europe Aquaponics Industry Revenue (Million), by Consumption Analysis 2025 & 2033
- Figure 29: Europe Aquaponics Industry Revenue Share (%), by Consumption Analysis 2025 & 2033
- Figure 30: Europe Aquaponics Industry Revenue (Million), by Import Market Analysis (Value & Volume) 2025 & 2033
- Figure 31: Europe Aquaponics Industry Revenue Share (%), by Import Market Analysis (Value & Volume) 2025 & 2033
- Figure 32: Europe Aquaponics Industry Revenue (Million), by Export Market Analysis (Value & Volume) 2025 & 2033
- Figure 33: Europe Aquaponics Industry Revenue Share (%), by Export Market Analysis (Value & Volume) 2025 & 2033
- Figure 34: Europe Aquaponics Industry Revenue (Million), by Price Trend Analysis 2025 & 2033
- Figure 35: Europe Aquaponics Industry Revenue Share (%), by Price Trend Analysis 2025 & 2033
- Figure 36: Europe Aquaponics Industry Revenue (Million), by Country 2025 & 2033
- Figure 37: Europe Aquaponics Industry Revenue Share (%), by Country 2025 & 2033
- Figure 38: Middle East & Africa Aquaponics Industry Revenue (Million), by Production Analysis 2025 & 2033
- Figure 39: Middle East & Africa Aquaponics Industry Revenue Share (%), by Production Analysis 2025 & 2033
- Figure 40: Middle East & Africa Aquaponics Industry Revenue (Million), by Consumption Analysis 2025 & 2033
- Figure 41: Middle East & Africa Aquaponics Industry Revenue Share (%), by Consumption Analysis 2025 & 2033
- Figure 42: Middle East & Africa Aquaponics Industry Revenue (Million), by Import Market Analysis (Value & Volume) 2025 & 2033
- Figure 43: Middle East & Africa Aquaponics Industry Revenue Share (%), by Import Market Analysis (Value & Volume) 2025 & 2033
- Figure 44: Middle East & Africa Aquaponics Industry Revenue (Million), by Export Market Analysis (Value & Volume) 2025 & 2033
- Figure 45: Middle East & Africa Aquaponics Industry Revenue Share (%), by Export Market Analysis (Value & Volume) 2025 & 2033
- Figure 46: Middle East & Africa Aquaponics Industry Revenue (Million), by Price Trend Analysis 2025 & 2033
- Figure 47: Middle East & Africa Aquaponics Industry Revenue Share (%), by Price Trend Analysis 2025 & 2033
- Figure 48: Middle East & Africa Aquaponics Industry Revenue (Million), by Country 2025 & 2033
- Figure 49: Middle East & Africa Aquaponics Industry Revenue Share (%), by Country 2025 & 2033
- Figure 50: Asia Pacific Aquaponics Industry Revenue (Million), by Production Analysis 2025 & 2033
- Figure 51: Asia Pacific Aquaponics Industry Revenue Share (%), by Production Analysis 2025 & 2033
- Figure 52: Asia Pacific Aquaponics Industry Revenue (Million), by Consumption Analysis 2025 & 2033
- Figure 53: Asia Pacific Aquaponics Industry Revenue Share (%), by Consumption Analysis 2025 & 2033
- Figure 54: Asia Pacific Aquaponics Industry Revenue (Million), by Import Market Analysis (Value & Volume) 2025 & 2033
- Figure 55: Asia Pacific Aquaponics Industry Revenue Share (%), by Import Market Analysis (Value & Volume) 2025 & 2033
- Figure 56: Asia Pacific Aquaponics Industry Revenue (Million), by Export Market Analysis (Value & Volume) 2025 & 2033
- Figure 57: Asia Pacific Aquaponics Industry Revenue Share (%), by Export Market Analysis (Value & Volume) 2025 & 2033
- Figure 58: Asia Pacific Aquaponics Industry Revenue (Million), by Price Trend Analysis 2025 & 2033
- Figure 59: Asia Pacific Aquaponics Industry Revenue Share (%), by Price Trend Analysis 2025 & 2033
- Figure 60: Asia Pacific Aquaponics Industry Revenue (Million), by Country 2025 & 2033
- Figure 61: Asia Pacific Aquaponics Industry Revenue Share (%), by Country 2025 & 2033
List of Tables
- Table 1: Global Aquaponics Industry Revenue Million Forecast, by Production Analysis 2020 & 2033
- Table 2: Global Aquaponics Industry Revenue Million Forecast, by Consumption Analysis 2020 & 2033
- Table 3: Global Aquaponics Industry Revenue Million Forecast, by Import Market Analysis (Value & Volume) 2020 & 2033
- Table 4: Global Aquaponics Industry Revenue Million Forecast, by Export Market Analysis (Value & Volume) 2020 & 2033
- Table 5: Global Aquaponics Industry Revenue Million Forecast, by Price Trend Analysis 2020 & 2033
- Table 6: Global Aquaponics Industry Revenue Million Forecast, by Region 2020 & 2033
- Table 7: Global Aquaponics Industry Revenue Million Forecast, by Production Analysis 2020 & 2033
- Table 8: Global Aquaponics Industry Revenue Million Forecast, by Consumption Analysis 2020 & 2033
- Table 9: Global Aquaponics Industry Revenue Million Forecast, by Import Market Analysis (Value & Volume) 2020 & 2033
- Table 10: Global Aquaponics Industry Revenue Million Forecast, by Export Market Analysis (Value & Volume) 2020 & 2033
- Table 11: Global Aquaponics Industry Revenue Million Forecast, by Price Trend Analysis 2020 & 2033
- Table 12: Global Aquaponics Industry Revenue Million Forecast, by Country 2020 & 2033
- Table 13: United States Aquaponics Industry Revenue (Million) Forecast, by Application 2020 & 2033
- Table 14: Canada Aquaponics Industry Revenue (Million) Forecast, by Application 2020 & 2033
- Table 15: Mexico Aquaponics Industry Revenue (Million) Forecast, by Application 2020 & 2033
- Table 16: Global Aquaponics Industry Revenue Million Forecast, by Production Analysis 2020 & 2033
- Table 17: Global Aquaponics Industry Revenue Million Forecast, by Consumption Analysis 2020 & 2033
- Table 18: Global Aquaponics Industry Revenue Million Forecast, by Import Market Analysis (Value & Volume) 2020 & 2033
- Table 19: Global Aquaponics Industry Revenue Million Forecast, by Export Market Analysis (Value & Volume) 2020 & 2033
- Table 20: Global Aquaponics Industry Revenue Million Forecast, by Price Trend Analysis 2020 & 2033
- Table 21: Global Aquaponics Industry Revenue Million Forecast, by Country 2020 & 2033
- Table 22: Brazil Aquaponics Industry Revenue (Million) Forecast, by Application 2020 & 2033
- Table 23: Argentina Aquaponics Industry Revenue (Million) Forecast, by Application 2020 & 2033
- Table 24: Rest of South America Aquaponics Industry Revenue (Million) Forecast, by Application 2020 & 2033
- Table 25: Global Aquaponics Industry Revenue Million Forecast, by Production Analysis 2020 & 2033
- Table 26: Global Aquaponics Industry Revenue Million Forecast, by Consumption Analysis 2020 & 2033
- Table 27: Global Aquaponics Industry Revenue Million Forecast, by Import Market Analysis (Value & Volume) 2020 & 2033
- Table 28: Global Aquaponics Industry Revenue Million Forecast, by Export Market Analysis (Value & Volume) 2020 & 2033
- Table 29: Global Aquaponics Industry Revenue Million Forecast, by Price Trend Analysis 2020 & 2033
- Table 30: Global Aquaponics Industry Revenue Million Forecast, by Country 2020 & 2033
- Table 31: United Kingdom Aquaponics Industry Revenue (Million) Forecast, by Application 2020 & 2033
- Table 32: Germany Aquaponics Industry Revenue (Million) Forecast, by Application 2020 & 2033
- Table 33: France Aquaponics Industry Revenue (Million) Forecast, by Application 2020 & 2033
- Table 34: Italy Aquaponics Industry Revenue (Million) Forecast, by Application 2020 & 2033
- Table 35: Spain Aquaponics Industry Revenue (Million) Forecast, by Application 2020 & 2033
- Table 36: Russia Aquaponics Industry Revenue (Million) Forecast, by Application 2020 & 2033
- Table 37: Benelux Aquaponics Industry Revenue (Million) Forecast, by Application 2020 & 2033
- Table 38: Nordics Aquaponics Industry Revenue (Million) Forecast, by Application 2020 & 2033
- Table 39: Rest of Europe Aquaponics Industry Revenue (Million) Forecast, by Application 2020 & 2033
- Table 40: Global Aquaponics Industry Revenue Million Forecast, by Production Analysis 2020 & 2033
- Table 41: Global Aquaponics Industry Revenue Million Forecast, by Consumption Analysis 2020 & 2033
- Table 42: Global Aquaponics Industry Revenue Million Forecast, by Import Market Analysis (Value & Volume) 2020 & 2033
- Table 43: Global Aquaponics Industry Revenue Million Forecast, by Export Market Analysis (Value & Volume) 2020 & 2033
- Table 44: Global Aquaponics Industry Revenue Million Forecast, by Price Trend Analysis 2020 & 2033
- Table 45: Global Aquaponics Industry Revenue Million Forecast, by Country 2020 & 2033
- Table 46: Turkey Aquaponics Industry Revenue (Million) Forecast, by Application 2020 & 2033
- Table 47: Israel Aquaponics Industry Revenue (Million) Forecast, by Application 2020 & 2033
- Table 48: GCC Aquaponics Industry Revenue (Million) Forecast, by Application 2020 & 2033
- Table 49: North Africa Aquaponics Industry Revenue (Million) Forecast, by Application 2020 & 2033
- Table 50: South Africa Aquaponics Industry Revenue (Million) Forecast, by Application 2020 & 2033
- Table 51: Rest of Middle East & Africa Aquaponics Industry Revenue (Million) Forecast, by Application 2020 & 2033
- Table 52: Global Aquaponics Industry Revenue Million Forecast, by Production Analysis 2020 & 2033
- Table 53: Global Aquaponics Industry Revenue Million Forecast, by Consumption Analysis 2020 & 2033
- Table 54: Global Aquaponics Industry Revenue Million Forecast, by Import Market Analysis (Value & Volume) 2020 & 2033
- Table 55: Global Aquaponics Industry Revenue Million Forecast, by Export Market Analysis (Value & Volume) 2020 & 2033
- Table 56: Global Aquaponics Industry Revenue Million Forecast, by Price Trend Analysis 2020 & 2033
- Table 57: Global Aquaponics Industry Revenue Million Forecast, by Country 2020 & 2033
- Table 58: China Aquaponics Industry Revenue (Million) Forecast, by Application 2020 & 2033
- Table 59: India Aquaponics Industry Revenue (Million) Forecast, by Application 2020 & 2033
- Table 60: Japan Aquaponics Industry Revenue (Million) Forecast, by Application 2020 & 2033
- Table 61: South Korea Aquaponics Industry Revenue (Million) Forecast, by Application 2020 & 2033
- Table 62: ASEAN Aquaponics Industry Revenue (Million) Forecast, by Application 2020 & 2033
- Table 63: Oceania Aquaponics Industry Revenue (Million) Forecast, by Application 2020 & 2033
- Table 64: Rest of Asia Pacific Aquaponics Industry Revenue (Million) Forecast, by Application 2020 & 2033
Frequently Asked Questions
1. What is the projected Compound Annual Growth Rate (CAGR) of the Aquaponics Industry?
The projected CAGR is approximately 9.60%.
2. Which companies are prominent players in the Aquaponics Industry?
Key companies in the market include Deep Water Farms, Superior Fresh, Practical Aquaponics, Nelson & Pade Aquaponics, BIGH, ECF Farm Berli, Garden City Aquaponics Inc, Aquaponics USA, Madhavi Farms, Ouroboros Farms, Pentair Aquatic Eco-System Inc (PAES).
3. What are the main segments of the Aquaponics Industry?
The market segments include Production Analysis, Consumption Analysis, Import Market Analysis (Value & Volume), Export Market Analysis (Value & Volume), Price Trend Analysis.
4. Can you provide details about the market size?
The market size is estimated to be USD 1.21 Million as of 2022.
5. What are some drivers contributing to market growth?
High Cost of Farm Labors; Increasing Consumption of Grain Crops.
6. What are the notable trends driving market growth?
Substantial Demand for Organic Produce Driving the Market.
7. Are there any restraints impacting market growth?
High Cost of Combine Harvesters; Small and Fragmented Land Holdings.
8. Can you provide examples of recent developments in the market?
N/A
9. What pricing options are available for accessing the report?
Pricing options include single-user, multi-user, and enterprise licenses priced at USD 4750, USD 5250, and USD 8750 respectively.
10. Is the market size provided in terms of value or volume?
The market size is provided in terms of value, measured in Million.
11. Are there any specific market keywords associated with the report?
Yes, the market keyword associated with the report is "Aquaponics Industry," which aids in identifying and referencing the specific market segment covered.
12. How do I determine which pricing option suits my needs best?
The pricing options vary based on user requirements and access needs. Individual users may opt for single-user licenses, while businesses requiring broader access may choose multi-user or enterprise licenses for cost-effective access to the report.
13. Are there any additional resources or data provided in the Aquaponics Industry report?
While the report offers comprehensive insights, it's advisable to review the specific contents or supplementary materials provided to ascertain if additional resources or data are available.
14. How can I stay updated on further developments or reports in the Aquaponics Industry?
To stay informed about further developments, trends, and reports in the Aquaponics Industry, consider subscribing to industry newsletters, following relevant companies and organizations, or regularly checking reputable industry news sources and publications.
Methodology
Step 1 - Identification of Relevant Samples Size from Population Database


Step 2 - Approaches for Defining Global Market Size (Value, Volume* & Price*)

Note*: In applicable scenarios
Step 3 - Data Sources
Primary Research
- Web Analytics
- Survey Reports
- Research Institute
- Latest Research Reports
- Opinion Leaders
Secondary Research
- Annual Reports
- White Paper
- Latest Press Release
- Industry Association
- Paid Database
- Investor Presentations

Step 4 - Data Triangulation
Involves using different sources of information in order to increase the validity of a study
These sources are likely to be stakeholders in a program - participants, other researchers, program staff, other community members, and so on.
Then we put all data in single framework & apply various statistical tools to find out the dynamic on the market.
During the analysis stage, feedback from the stakeholder groups would be compared to determine areas of agreement as well as areas of divergence