

Key Insights
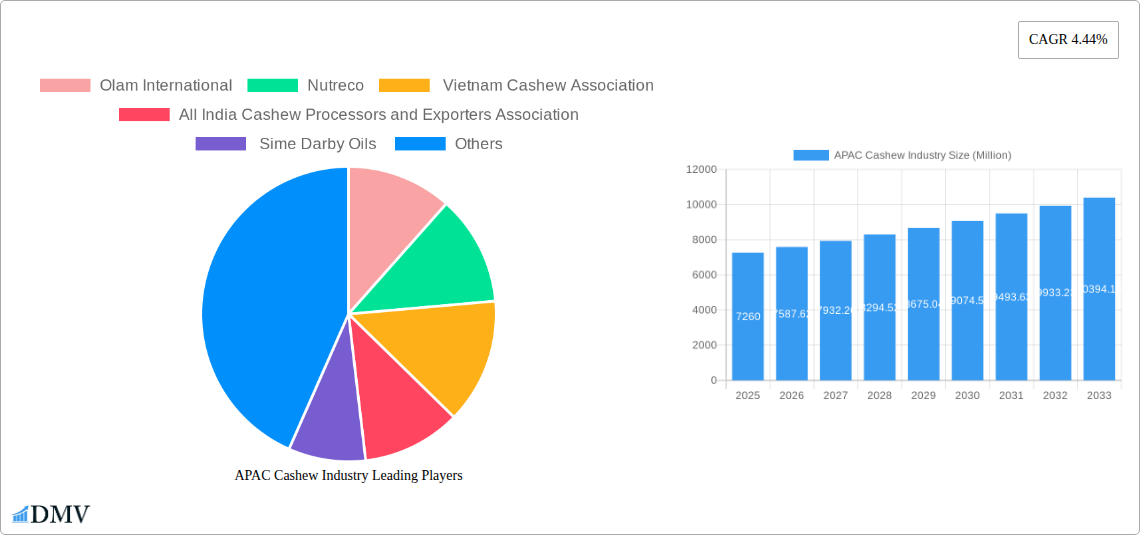
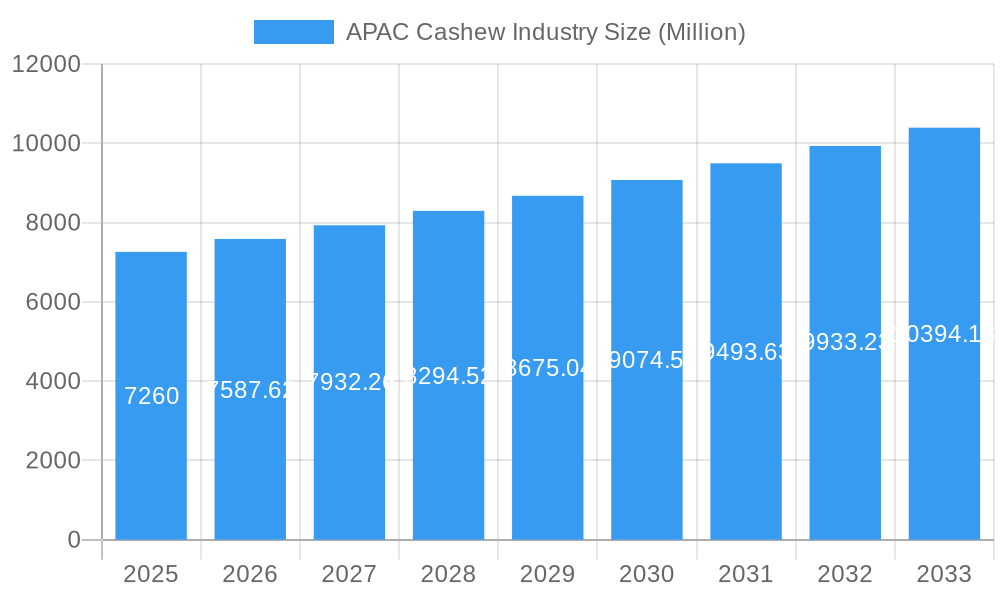
The Asia-Pacific (APAC) cashew industry, valued at $7.26 billion in 2025, is projected for robust growth, exhibiting a Compound Annual Growth Rate (CAGR) of 4.44% from 2025 to 2033. This expansion is driven by several factors. Rising disposable incomes across the region, particularly in burgeoning middle classes of countries like India and China, fuel increased demand for nutritious snacks and confectionery products containing cashews. The growing popularity of cashew-based nutraceuticals, capitalizing on the health benefits associated with cashews, further propels market growth. Furthermore, the increasing adoption of online retail channels provides convenient access to cashew products, expanding market reach and boosting sales. However, challenges exist, including fluctuating cashew prices influenced by weather patterns and global supply chain disruptions. Competition from other nuts and seeds also exerts pressure on market share. Nevertheless, the region's vast population and the trend toward healthier eating habits strongly support a positive outlook for the APAC cashew industry throughout the forecast period.
APAC Cashew Industry Market Size (In Billion)
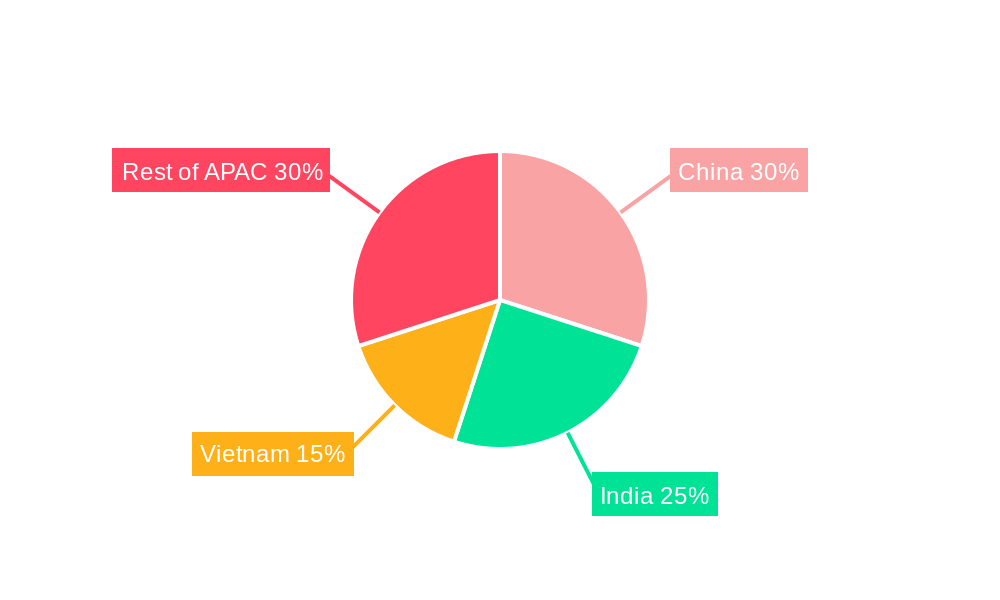
Within the APAC region, several key markets contribute significantly to the overall growth. China and India, two of the world's most populous nations, stand out as major consumers and, increasingly, producers of cashews. Vietnam, a significant exporter, plays a crucial role in the global supply chain. Other countries in the region, including South Korea, Japan, and Australia, also demonstrate substantial, albeit varied, levels of cashew consumption, reflecting diverse dietary preferences and economic conditions. The segmentation of the market, encompassing raw and processed cashews destined for food, confectionery, and nutraceutical industries, distributed via retail, food service, and online channels, offers diverse opportunities for growth and strategic maneuvering within the APAC cashew market. The continued evolution of consumer preferences and technological advancements within food processing and distribution will shape the future trajectory of this dynamic industry.
APAC Cashew Industry Company Market Share
APAC Cashew Industry: A Comprehensive Market Report (2019-2033)
This insightful report provides a detailed analysis of the Asia-Pacific Cashew industry, offering a comprehensive overview of market dynamics, key players, and future growth prospects. Covering the period from 2019 to 2033, with a base year of 2025 and a forecast period of 2025-2033, this study is an invaluable resource for stakeholders seeking to understand and capitalize on opportunities within this lucrative sector. The report meticulously examines the market's evolution, identifies key growth drivers and obstacles, and explores future opportunities, providing actionable insights for informed decision-making. With a focus on market segmentation by type (Raw Cashew Nuts, Processed Cashew Nuts), application (Food Industry, Confectionery Industry, Nutraceutical Industry), and distribution channel (Retail, Food Service, Online), this report presents a granular view of the APAC cashew market. The value of the Indian cashew processing industry exceeded USD 300,000 Million in 2022, showcasing the immense potential of this sector.
APAC Cashew Industry Market Composition & Trends
This section analyzes the competitive landscape of the APAC cashew industry, examining market concentration, innovation drivers, regulatory frameworks, substitute products, end-user profiles, and merger and acquisition (M&A) activities. We delve into market share distribution among key players, providing insights into the strategies employed by leading companies like Olam International, Nutreco, and Sime Darby Oils. The report also quantifies the value of significant M&A deals within the industry, highlighting their impact on market consolidation and competitive dynamics. The evolving regulatory landscape and its influence on market access and operations are thoroughly investigated. Furthermore, the report assesses the threat posed by substitute products and analyses the changing preferences of end-users across various segments.
- Market Share Distribution: Olam International holds an estimated xx% market share, followed by Nutreco at xx% and Sime Darby Oils at xx%. Smaller players account for the remaining xx%. (Note: Precise figures are unavailable for public disclosure, hence estimated values).
- M&A Activity: Since 2019, xx M&A deals valued at approximately USD xx Million have been recorded, largely driven by consolidation efforts among processors and expansion into new markets. Detailed breakdown of deals and their impact is included in the report.
- Innovation Catalysts: Technological advancements in processing, packaging, and traceability are driving innovation, while increasing consumer demand for sustainable and ethically sourced cashews is a major influence.
- Regulatory Landscape: Varying regulations across APAC nations impact cashew trade and processing significantly. The report details specific regulations and their implications for market entry and operation.
APAC Cashew Industry Industry Evolution
This section charts the growth trajectory of the APAC cashew industry, analyzing market expansion, technological breakthroughs, and the shift in consumer preferences from 2019 to the projected year 2033. It explores the impact of technological advancements on production efficiency, processing techniques, and product innovation. The changing consumer landscape, including health-conscious trends and evolving consumption patterns, are considered in detail. Data points such as year-on-year growth rates and adoption rates of new technologies will be presented graphically and in tabular formats for clear understanding.
- Market Growth Trajectories: The APAC cashew market experienced a Compound Annual Growth Rate (CAGR) of xx% during 2019-2024, projected to reach a CAGR of xx% during 2025-2033.
- Technological Advancements: Automation in cashew processing, improved quality control measures, and the adoption of sustainable farming practices are key technological drivers.
- Shifting Consumer Demands: Growing preference for healthier snacks and functional foods, coupled with increased awareness of ethical sourcing and sustainability, are influencing consumer purchasing decisions.
Leading Regions, Countries, or Segments in APAC Cashew Industry
This section pinpoints the leading regions, countries, and segments within the APAC cashew industry, analyzing their dominance factors. We identify the key drivers fueling growth in these segments through in-depth analysis and detailed bullet points, including investment trends, government support, and competitive advantages.
- Dominant Region: India currently holds the dominant position in both production and processing, driven by favorable climatic conditions and a large labor pool. Vietnam also plays a significant role as a major exporter.
- Key Drivers:
- India: Government initiatives like MIDH and RKVY, along with established infrastructure and processing capabilities, contribute to India’s leadership.
- Vietnam: Favorable government policies, access to global markets, and increasing investment in modern processing facilities are key drivers for Vietnam.
- Processed Cashew Nuts: The processed cashew segment dominates due to higher value addition and diverse application in various industries.
- Food Industry: Remains the largest application segment, driven by increasing demand for convenient and healthy snacking options.
APAC Cashew Industry Product Innovations
Recent innovations encompass advancements in processing techniques leading to improved cashew quality, shelf life, and flavor profiles. New product formats, such as ready-to-eat cashew snacks and cashew-based ingredients for various food products, are also gaining traction. The development of value-added products like cashew milk and cashew butter is another important trend. Furthermore, a focus on traceability and sustainability is shaping product development, catering to increasingly discerning consumers.
Propelling Factors for APAC Cashew Industry Growth
Several factors drive the growth of the APAC cashew industry. Rising disposable incomes and changing lifestyles have boosted demand for convenient and nutritious snacks. Favorable government policies promoting agricultural development and increased investment in processing infrastructure have enhanced production capabilities. Technological advancements have improved efficiency and quality, while growing health consciousness among consumers has further fueled demand for cashews as a healthy snack option.
Obstacles in the APAP Cashew Industry Market
Challenges confronting the APAC cashew industry include volatile raw material prices, fluctuating exchange rates, and potential supply chain disruptions. Seasonal variations in cashew production can also impact supply stability. Furthermore, intense competition, particularly from established players, requires ongoing innovation and strategic adjustments. Lastly, stringent food safety and quality standards necessitate significant investment in advanced processing technology and quality control.
Future Opportunities in APAC Cashew Industry
Future growth opportunities are presented by exploring new markets in the region, especially within emerging economies. Developing innovative cashew-based products targeting health-conscious consumers and expanding into value-added applications will further unlock growth potentials. Leveraging e-commerce platforms to access a wider customer base and implementing sustainable farming and processing practices will attract environmentally conscious buyers.
Major Players in the APAC Cashew Industry Ecosystem
- Olam International
- Nutreco
- Vietnam Cashew Association
- All India Cashew Processors and Exporters Association
- Sime Darby Oils
Key Developments in APAC Cashew Industry Industry
- January 2023: The Indian cashew processing industry's revenue exceeded USD 300,000 Million, marking a 15% year-on-year growth.
- July 2022: DAC&FW initiatives under MIDH and RKVY expanded cashew cultivation by 1.20 lakh hectares.
- February 2021: The DAE in Bangladesh launched a project to increase cashew cultivation and processing mill investments.
Strategic APAC Cashew Industry Market Forecast
The APAC cashew market is poised for robust growth, driven by increasing consumer demand, favorable government policies, and technological advancements. The market's expansion will be influenced by continued innovation in product development, a focus on sustainable practices, and the exploration of new market segments. This growth trajectory will create significant opportunities for industry players, necessitating strategic planning and proactive adaptation to evolving market dynamics.
APAC Cashew Industry Segmentation
- 1. Production Analysis
- 2. Consumption Analysis
- 3. Import Market Analysis (Value & Volume)
- 4. Export Market Analysis (Value & Volume)
- 5. Price Trend Analysis
APAC Cashew Industry Segmentation By Geography
- 1. China
- 2. Vietnam
- 3. India
- 4. Indonesia
- 5. Sri Lanka
- 6. Japan
- 7. Philippines
APAC Cashew Industry Regional Market Share
Geographic Coverage of APAC Cashew Industry
APAC Cashew Industry REPORT HIGHLIGHTS
| Aspects | Details |
|---|---|
| Study Period | 2020-2034 |
| Base Year | 2025 |
| Estimated Year | 2026 |
| Forecast Period | 2026-2034 |
| Historical Period | 2020-2025 |
| Growth Rate | CAGR of 4.44% from 2020-2034 |
| Segmentation |
|
Table of Contents
- 1. Introduction
- 1.1. Research Scope
- 1.2. Market Segmentation
- 1.3. Research Objective
- 1.4. Definitions and Assumptions
- 2. Executive Summary
- 2.1. Market Snapshot
- 3. Market Dynamics
- 3.1. Market Drivers
- 3.2. Market Restrains
- 3.3. Market Trends
- 3.4. Market Opportunities
- 4. Market Factor Analysis
- 4.1. Porters Five Forces
- 4.1.1. Bargaining Power of Suppliers
- 4.1.2. Bargaining Power of Buyers
- 4.1.3. Threat of New Entrants
- 4.1.4. Threat of Substitutes
- 4.1.5. Competitive Rivalry
- 4.2. PESTEL analysis
- 4.3. BCG Analysis
- 4.3.1. Stars (High Growth, High Market Share)
- 4.3.2. Cash Cows (Low Growth, High Market Share)
- 4.3.3. Question Mark (High Growth, Low Market Share)
- 4.3.4. Dogs (Low Growth, Low Market Share)
- 4.4. Ansoff Matrix Analysis
- 4.5. Supply Chain Analysis
- 4.6. Regulatory Landscape
- 4.7. Current Market Potential and Opportunity Assessment (TAM–SAM–SOM Framework)
- 4.8. DMV Analyst Note
- 4.1. Porters Five Forces
- 5. Market Analysis, Insights and Forecast 2021-2033
- 5.1. Market Analysis, Insights and Forecast - by Production Analysis
- 5.2. Market Analysis, Insights and Forecast - by Consumption Analysis
- 5.3. Market Analysis, Insights and Forecast - by Import Market Analysis (Value & Volume)
- 5.4. Market Analysis, Insights and Forecast - by Export Market Analysis (Value & Volume)
- 5.5. Market Analysis, Insights and Forecast - by Price Trend Analysis
- 5.6. Market Analysis, Insights and Forecast - by Region
- 5.6.1. China
- 5.6.2. Vietnam
- 5.6.3. India
- 5.6.4. Indonesia
- 5.6.5. Sri Lanka
- 5.6.6. Japan
- 5.6.7. Philippines
- 6. Global APAC Cashew Industry Analysis, Insights and Forecast, 2021-2033
- 6.1. Market Analysis, Insights and Forecast - by Production Analysis
- 6.2. Market Analysis, Insights and Forecast - by Consumption Analysis
- 6.3. Market Analysis, Insights and Forecast - by Import Market Analysis (Value & Volume)
- 6.4. Market Analysis, Insights and Forecast - by Export Market Analysis (Value & Volume)
- 6.5. Market Analysis, Insights and Forecast - by Price Trend Analysis
- 7. China APAC Cashew Industry Analysis, Insights and Forecast, 2020-2032
- 7.1. Market Analysis, Insights and Forecast - by Production Analysis
- 7.2. Market Analysis, Insights and Forecast - by Consumption Analysis
- 7.3. Market Analysis, Insights and Forecast - by Import Market Analysis (Value & Volume)
- 7.4. Market Analysis, Insights and Forecast - by Export Market Analysis (Value & Volume)
- 7.5. Market Analysis, Insights and Forecast - by Price Trend Analysis
- 8. Vietnam APAC Cashew Industry Analysis, Insights and Forecast, 2020-2032
- 8.1. Market Analysis, Insights and Forecast - by Production Analysis
- 8.2. Market Analysis, Insights and Forecast - by Consumption Analysis
- 8.3. Market Analysis, Insights and Forecast - by Import Market Analysis (Value & Volume)
- 8.4. Market Analysis, Insights and Forecast - by Export Market Analysis (Value & Volume)
- 8.5. Market Analysis, Insights and Forecast - by Price Trend Analysis
- 9. India APAC Cashew Industry Analysis, Insights and Forecast, 2020-2032
- 9.1. Market Analysis, Insights and Forecast - by Production Analysis
- 9.2. Market Analysis, Insights and Forecast - by Consumption Analysis
- 9.3. Market Analysis, Insights and Forecast - by Import Market Analysis (Value & Volume)
- 9.4. Market Analysis, Insights and Forecast - by Export Market Analysis (Value & Volume)
- 9.5. Market Analysis, Insights and Forecast - by Price Trend Analysis
- 10. Indonesia APAC Cashew Industry Analysis, Insights and Forecast, 2020-2032
- 10.1. Market Analysis, Insights and Forecast - by Production Analysis
- 10.2. Market Analysis, Insights and Forecast - by Consumption Analysis
- 10.3. Market Analysis, Insights and Forecast - by Import Market Analysis (Value & Volume)
- 10.4. Market Analysis, Insights and Forecast - by Export Market Analysis (Value & Volume)
- 10.5. Market Analysis, Insights and Forecast - by Price Trend Analysis
- 11. Sri Lanka APAC Cashew Industry Analysis, Insights and Forecast, 2020-2032
- 11.1. Market Analysis, Insights and Forecast - by Production Analysis
- 11.2. Market Analysis, Insights and Forecast - by Consumption Analysis
- 11.3. Market Analysis, Insights and Forecast - by Import Market Analysis (Value & Volume)
- 11.4. Market Analysis, Insights and Forecast - by Export Market Analysis (Value & Volume)
- 11.5. Market Analysis, Insights and Forecast - by Price Trend Analysis
- 12. Japan APAC Cashew Industry Analysis, Insights and Forecast, 2020-2032
- 12.1. Market Analysis, Insights and Forecast - by Production Analysis
- 12.2. Market Analysis, Insights and Forecast - by Consumption Analysis
- 12.3. Market Analysis, Insights and Forecast - by Import Market Analysis (Value & Volume)
- 12.4. Market Analysis, Insights and Forecast - by Export Market Analysis (Value & Volume)
- 12.5. Market Analysis, Insights and Forecast - by Price Trend Analysis
- 13. Philippines APAC Cashew Industry Analysis, Insights and Forecast, 2020-2032
- 13.1. Market Analysis, Insights and Forecast - by Production Analysis
- 13.2. Market Analysis, Insights and Forecast - by Consumption Analysis
- 13.3. Market Analysis, Insights and Forecast - by Import Market Analysis (Value & Volume)
- 13.4. Market Analysis, Insights and Forecast - by Export Market Analysis (Value & Volume)
- 13.5. Market Analysis, Insights and Forecast - by Price Trend Analysis
- 14. Competitive Analysis
- 14.1. Company Profiles
- 14.1.1 Olam International
- 14.1.1.1. Company Overview
- 14.1.1.2. Products
- 14.1.1.3. Company Financials
- 14.1.1.4. SWOT Analysis
- 14.1.2 Nutreco
- 14.1.2.1. Company Overview
- 14.1.2.2. Products
- 14.1.2.3. Company Financials
- 14.1.2.4. SWOT Analysis
- 14.1.3 Vietnam Cashew Association
- 14.1.3.1. Company Overview
- 14.1.3.2. Products
- 14.1.3.3. Company Financials
- 14.1.3.4. SWOT Analysis
- 14.1.4 All India Cashew Processors and Exporters Association
- 14.1.4.1. Company Overview
- 14.1.4.2. Products
- 14.1.4.3. Company Financials
- 14.1.4.4. SWOT Analysis
- 14.1.5 Sime Darby Oils
- 14.1.5.1. Company Overview
- 14.1.5.2. Products
- 14.1.5.3. Company Financials
- 14.1.5.4. SWOT Analysis
- 14.1.1 Olam International
- 14.2. Market Entropy
- 14.2.1 Company's Key Areas Served
- 14.2.2 Recent Developments
- 14.3. Company Market Share Analysis 2025
- 14.3.1 Top 5 Companies Market Share Analysis
- 14.3.2 Top 3 Companies Market Share Analysis
- 14.4. List of Potential Customers
- 15. Research Methodology
List of Figures
- Figure 1: Global APAC Cashew Industry Revenue Breakdown (Million, %) by Region 2025 & 2033
- Figure 2: Global APAC Cashew Industry Volume Breakdown (Kiloton, %) by Region 2025 & 2033
- Figure 3: China APAC Cashew Industry Revenue (Million), by Production Analysis 2025 & 2033
- Figure 4: China APAC Cashew Industry Volume (Kiloton), by Production Analysis 2025 & 2033
- Figure 5: China APAC Cashew Industry Revenue Share (%), by Production Analysis 2025 & 2033
- Figure 6: China APAC Cashew Industry Volume Share (%), by Production Analysis 2025 & 2033
- Figure 7: China APAC Cashew Industry Revenue (Million), by Consumption Analysis 2025 & 2033
- Figure 8: China APAC Cashew Industry Volume (Kiloton), by Consumption Analysis 2025 & 2033
- Figure 9: China APAC Cashew Industry Revenue Share (%), by Consumption Analysis 2025 & 2033
- Figure 10: China APAC Cashew Industry Volume Share (%), by Consumption Analysis 2025 & 2033
- Figure 11: China APAC Cashew Industry Revenue (Million), by Import Market Analysis (Value & Volume) 2025 & 2033
- Figure 12: China APAC Cashew Industry Volume (Kiloton), by Import Market Analysis (Value & Volume) 2025 & 2033
- Figure 13: China APAC Cashew Industry Revenue Share (%), by Import Market Analysis (Value & Volume) 2025 & 2033
- Figure 14: China APAC Cashew Industry Volume Share (%), by Import Market Analysis (Value & Volume) 2025 & 2033
- Figure 15: China APAC Cashew Industry Revenue (Million), by Export Market Analysis (Value & Volume) 2025 & 2033
- Figure 16: China APAC Cashew Industry Volume (Kiloton), by Export Market Analysis (Value & Volume) 2025 & 2033
- Figure 17: China APAC Cashew Industry Revenue Share (%), by Export Market Analysis (Value & Volume) 2025 & 2033
- Figure 18: China APAC Cashew Industry Volume Share (%), by Export Market Analysis (Value & Volume) 2025 & 2033
- Figure 19: China APAC Cashew Industry Revenue (Million), by Price Trend Analysis 2025 & 2033
- Figure 20: China APAC Cashew Industry Volume (Kiloton), by Price Trend Analysis 2025 & 2033
- Figure 21: China APAC Cashew Industry Revenue Share (%), by Price Trend Analysis 2025 & 2033
- Figure 22: China APAC Cashew Industry Volume Share (%), by Price Trend Analysis 2025 & 2033
- Figure 23: China APAC Cashew Industry Revenue (Million), by Country 2025 & 2033
- Figure 24: China APAC Cashew Industry Volume (Kiloton), by Country 2025 & 2033
- Figure 25: China APAC Cashew Industry Revenue Share (%), by Country 2025 & 2033
- Figure 26: China APAC Cashew Industry Volume Share (%), by Country 2025 & 2033
- Figure 27: Vietnam APAC Cashew Industry Revenue (Million), by Production Analysis 2025 & 2033
- Figure 28: Vietnam APAC Cashew Industry Volume (Kiloton), by Production Analysis 2025 & 2033
- Figure 29: Vietnam APAC Cashew Industry Revenue Share (%), by Production Analysis 2025 & 2033
- Figure 30: Vietnam APAC Cashew Industry Volume Share (%), by Production Analysis 2025 & 2033
- Figure 31: Vietnam APAC Cashew Industry Revenue (Million), by Consumption Analysis 2025 & 2033
- Figure 32: Vietnam APAC Cashew Industry Volume (Kiloton), by Consumption Analysis 2025 & 2033
- Figure 33: Vietnam APAC Cashew Industry Revenue Share (%), by Consumption Analysis 2025 & 2033
- Figure 34: Vietnam APAC Cashew Industry Volume Share (%), by Consumption Analysis 2025 & 2033
- Figure 35: Vietnam APAC Cashew Industry Revenue (Million), by Import Market Analysis (Value & Volume) 2025 & 2033
- Figure 36: Vietnam APAC Cashew Industry Volume (Kiloton), by Import Market Analysis (Value & Volume) 2025 & 2033
- Figure 37: Vietnam APAC Cashew Industry Revenue Share (%), by Import Market Analysis (Value & Volume) 2025 & 2033
- Figure 38: Vietnam APAC Cashew Industry Volume Share (%), by Import Market Analysis (Value & Volume) 2025 & 2033
- Figure 39: Vietnam APAC Cashew Industry Revenue (Million), by Export Market Analysis (Value & Volume) 2025 & 2033
- Figure 40: Vietnam APAC Cashew Industry Volume (Kiloton), by Export Market Analysis (Value & Volume) 2025 & 2033
- Figure 41: Vietnam APAC Cashew Industry Revenue Share (%), by Export Market Analysis (Value & Volume) 2025 & 2033
- Figure 42: Vietnam APAC Cashew Industry Volume Share (%), by Export Market Analysis (Value & Volume) 2025 & 2033
- Figure 43: Vietnam APAC Cashew Industry Revenue (Million), by Price Trend Analysis 2025 & 2033
- Figure 44: Vietnam APAC Cashew Industry Volume (Kiloton), by Price Trend Analysis 2025 & 2033
- Figure 45: Vietnam APAC Cashew Industry Revenue Share (%), by Price Trend Analysis 2025 & 2033
- Figure 46: Vietnam APAC Cashew Industry Volume Share (%), by Price Trend Analysis 2025 & 2033
- Figure 47: Vietnam APAC Cashew Industry Revenue (Million), by Country 2025 & 2033
- Figure 48: Vietnam APAC Cashew Industry Volume (Kiloton), by Country 2025 & 2033
- Figure 49: Vietnam APAC Cashew Industry Revenue Share (%), by Country 2025 & 2033
- Figure 50: Vietnam APAC Cashew Industry Volume Share (%), by Country 2025 & 2033
- Figure 51: India APAC Cashew Industry Revenue (Million), by Production Analysis 2025 & 2033
- Figure 52: India APAC Cashew Industry Volume (Kiloton), by Production Analysis 2025 & 2033
- Figure 53: India APAC Cashew Industry Revenue Share (%), by Production Analysis 2025 & 2033
- Figure 54: India APAC Cashew Industry Volume Share (%), by Production Analysis 2025 & 2033
- Figure 55: India APAC Cashew Industry Revenue (Million), by Consumption Analysis 2025 & 2033
- Figure 56: India APAC Cashew Industry Volume (Kiloton), by Consumption Analysis 2025 & 2033
- Figure 57: India APAC Cashew Industry Revenue Share (%), by Consumption Analysis 2025 & 2033
- Figure 58: India APAC Cashew Industry Volume Share (%), by Consumption Analysis 2025 & 2033
- Figure 59: India APAC Cashew Industry Revenue (Million), by Import Market Analysis (Value & Volume) 2025 & 2033
- Figure 60: India APAC Cashew Industry Volume (Kiloton), by Import Market Analysis (Value & Volume) 2025 & 2033
- Figure 61: India APAC Cashew Industry Revenue Share (%), by Import Market Analysis (Value & Volume) 2025 & 2033
- Figure 62: India APAC Cashew Industry Volume Share (%), by Import Market Analysis (Value & Volume) 2025 & 2033
- Figure 63: India APAC Cashew Industry Revenue (Million), by Export Market Analysis (Value & Volume) 2025 & 2033
- Figure 64: India APAC Cashew Industry Volume (Kiloton), by Export Market Analysis (Value & Volume) 2025 & 2033
- Figure 65: India APAC Cashew Industry Revenue Share (%), by Export Market Analysis (Value & Volume) 2025 & 2033
- Figure 66: India APAC Cashew Industry Volume Share (%), by Export Market Analysis (Value & Volume) 2025 & 2033
- Figure 67: India APAC Cashew Industry Revenue (Million), by Price Trend Analysis 2025 & 2033
- Figure 68: India APAC Cashew Industry Volume (Kiloton), by Price Trend Analysis 2025 & 2033
- Figure 69: India APAC Cashew Industry Revenue Share (%), by Price Trend Analysis 2025 & 2033
- Figure 70: India APAC Cashew Industry Volume Share (%), by Price Trend Analysis 2025 & 2033
- Figure 71: India APAC Cashew Industry Revenue (Million), by Country 2025 & 2033
- Figure 72: India APAC Cashew Industry Volume (Kiloton), by Country 2025 & 2033
- Figure 73: India APAC Cashew Industry Revenue Share (%), by Country 2025 & 2033
- Figure 74: India APAC Cashew Industry Volume Share (%), by Country 2025 & 2033
- Figure 75: Indonesia APAC Cashew Industry Revenue (Million), by Production Analysis 2025 & 2033
- Figure 76: Indonesia APAC Cashew Industry Volume (Kiloton), by Production Analysis 2025 & 2033
- Figure 77: Indonesia APAC Cashew Industry Revenue Share (%), by Production Analysis 2025 & 2033
- Figure 78: Indonesia APAC Cashew Industry Volume Share (%), by Production Analysis 2025 & 2033
- Figure 79: Indonesia APAC Cashew Industry Revenue (Million), by Consumption Analysis 2025 & 2033
- Figure 80: Indonesia APAC Cashew Industry Volume (Kiloton), by Consumption Analysis 2025 & 2033
- Figure 81: Indonesia APAC Cashew Industry Revenue Share (%), by Consumption Analysis 2025 & 2033
- Figure 82: Indonesia APAC Cashew Industry Volume Share (%), by Consumption Analysis 2025 & 2033
- Figure 83: Indonesia APAC Cashew Industry Revenue (Million), by Import Market Analysis (Value & Volume) 2025 & 2033
- Figure 84: Indonesia APAC Cashew Industry Volume (Kiloton), by Import Market Analysis (Value & Volume) 2025 & 2033
- Figure 85: Indonesia APAC Cashew Industry Revenue Share (%), by Import Market Analysis (Value & Volume) 2025 & 2033
- Figure 86: Indonesia APAC Cashew Industry Volume Share (%), by Import Market Analysis (Value & Volume) 2025 & 2033
- Figure 87: Indonesia APAC Cashew Industry Revenue (Million), by Export Market Analysis (Value & Volume) 2025 & 2033
- Figure 88: Indonesia APAC Cashew Industry Volume (Kiloton), by Export Market Analysis (Value & Volume) 2025 & 2033
- Figure 89: Indonesia APAC Cashew Industry Revenue Share (%), by Export Market Analysis (Value & Volume) 2025 & 2033
- Figure 90: Indonesia APAC Cashew Industry Volume Share (%), by Export Market Analysis (Value & Volume) 2025 & 2033
- Figure 91: Indonesia APAC Cashew Industry Revenue (Million), by Price Trend Analysis 2025 & 2033
- Figure 92: Indonesia APAC Cashew Industry Volume (Kiloton), by Price Trend Analysis 2025 & 2033
- Figure 93: Indonesia APAC Cashew Industry Revenue Share (%), by Price Trend Analysis 2025 & 2033
- Figure 94: Indonesia APAC Cashew Industry Volume Share (%), by Price Trend Analysis 2025 & 2033
- Figure 95: Indonesia APAC Cashew Industry Revenue (Million), by Country 2025 & 2033
- Figure 96: Indonesia APAC Cashew Industry Volume (Kiloton), by Country 2025 & 2033
- Figure 97: Indonesia APAC Cashew Industry Revenue Share (%), by Country 2025 & 2033
- Figure 98: Indonesia APAC Cashew Industry Volume Share (%), by Country 2025 & 2033
- Figure 99: Sri Lanka APAC Cashew Industry Revenue (Million), by Production Analysis 2025 & 2033
- Figure 100: Sri Lanka APAC Cashew Industry Volume (Kiloton), by Production Analysis 2025 & 2033
- Figure 101: Sri Lanka APAC Cashew Industry Revenue Share (%), by Production Analysis 2025 & 2033
- Figure 102: Sri Lanka APAC Cashew Industry Volume Share (%), by Production Analysis 2025 & 2033
- Figure 103: Sri Lanka APAC Cashew Industry Revenue (Million), by Consumption Analysis 2025 & 2033
- Figure 104: Sri Lanka APAC Cashew Industry Volume (Kiloton), by Consumption Analysis 2025 & 2033
- Figure 105: Sri Lanka APAC Cashew Industry Revenue Share (%), by Consumption Analysis 2025 & 2033
- Figure 106: Sri Lanka APAC Cashew Industry Volume Share (%), by Consumption Analysis 2025 & 2033
- Figure 107: Sri Lanka APAC Cashew Industry Revenue (Million), by Import Market Analysis (Value & Volume) 2025 & 2033
- Figure 108: Sri Lanka APAC Cashew Industry Volume (Kiloton), by Import Market Analysis (Value & Volume) 2025 & 2033
- Figure 109: Sri Lanka APAC Cashew Industry Revenue Share (%), by Import Market Analysis (Value & Volume) 2025 & 2033
- Figure 110: Sri Lanka APAC Cashew Industry Volume Share (%), by Import Market Analysis (Value & Volume) 2025 & 2033
- Figure 111: Sri Lanka APAC Cashew Industry Revenue (Million), by Export Market Analysis (Value & Volume) 2025 & 2033
- Figure 112: Sri Lanka APAC Cashew Industry Volume (Kiloton), by Export Market Analysis (Value & Volume) 2025 & 2033
- Figure 113: Sri Lanka APAC Cashew Industry Revenue Share (%), by Export Market Analysis (Value & Volume) 2025 & 2033
- Figure 114: Sri Lanka APAC Cashew Industry Volume Share (%), by Export Market Analysis (Value & Volume) 2025 & 2033
- Figure 115: Sri Lanka APAC Cashew Industry Revenue (Million), by Price Trend Analysis 2025 & 2033
- Figure 116: Sri Lanka APAC Cashew Industry Volume (Kiloton), by Price Trend Analysis 2025 & 2033
- Figure 117: Sri Lanka APAC Cashew Industry Revenue Share (%), by Price Trend Analysis 2025 & 2033
- Figure 118: Sri Lanka APAC Cashew Industry Volume Share (%), by Price Trend Analysis 2025 & 2033
- Figure 119: Sri Lanka APAC Cashew Industry Revenue (Million), by Country 2025 & 2033
- Figure 120: Sri Lanka APAC Cashew Industry Volume (Kiloton), by Country 2025 & 2033
- Figure 121: Sri Lanka APAC Cashew Industry Revenue Share (%), by Country 2025 & 2033
- Figure 122: Sri Lanka APAC Cashew Industry Volume Share (%), by Country 2025 & 2033
- Figure 123: Japan APAC Cashew Industry Revenue (Million), by Production Analysis 2025 & 2033
- Figure 124: Japan APAC Cashew Industry Volume (Kiloton), by Production Analysis 2025 & 2033
- Figure 125: Japan APAC Cashew Industry Revenue Share (%), by Production Analysis 2025 & 2033
- Figure 126: Japan APAC Cashew Industry Volume Share (%), by Production Analysis 2025 & 2033
- Figure 127: Japan APAC Cashew Industry Revenue (Million), by Consumption Analysis 2025 & 2033
- Figure 128: Japan APAC Cashew Industry Volume (Kiloton), by Consumption Analysis 2025 & 2033
- Figure 129: Japan APAC Cashew Industry Revenue Share (%), by Consumption Analysis 2025 & 2033
- Figure 130: Japan APAC Cashew Industry Volume Share (%), by Consumption Analysis 2025 & 2033
- Figure 131: Japan APAC Cashew Industry Revenue (Million), by Import Market Analysis (Value & Volume) 2025 & 2033
- Figure 132: Japan APAC Cashew Industry Volume (Kiloton), by Import Market Analysis (Value & Volume) 2025 & 2033
- Figure 133: Japan APAC Cashew Industry Revenue Share (%), by Import Market Analysis (Value & Volume) 2025 & 2033
- Figure 134: Japan APAC Cashew Industry Volume Share (%), by Import Market Analysis (Value & Volume) 2025 & 2033
- Figure 135: Japan APAC Cashew Industry Revenue (Million), by Export Market Analysis (Value & Volume) 2025 & 2033
- Figure 136: Japan APAC Cashew Industry Volume (Kiloton), by Export Market Analysis (Value & Volume) 2025 & 2033
- Figure 137: Japan APAC Cashew Industry Revenue Share (%), by Export Market Analysis (Value & Volume) 2025 & 2033
- Figure 138: Japan APAC Cashew Industry Volume Share (%), by Export Market Analysis (Value & Volume) 2025 & 2033
- Figure 139: Japan APAC Cashew Industry Revenue (Million), by Price Trend Analysis 2025 & 2033
- Figure 140: Japan APAC Cashew Industry Volume (Kiloton), by Price Trend Analysis 2025 & 2033
- Figure 141: Japan APAC Cashew Industry Revenue Share (%), by Price Trend Analysis 2025 & 2033
- Figure 142: Japan APAC Cashew Industry Volume Share (%), by Price Trend Analysis 2025 & 2033
- Figure 143: Japan APAC Cashew Industry Revenue (Million), by Country 2025 & 2033
- Figure 144: Japan APAC Cashew Industry Volume (Kiloton), by Country 2025 & 2033
- Figure 145: Japan APAC Cashew Industry Revenue Share (%), by Country 2025 & 2033
- Figure 146: Japan APAC Cashew Industry Volume Share (%), by Country 2025 & 2033
- Figure 147: Philippines APAC Cashew Industry Revenue (Million), by Production Analysis 2025 & 2033
- Figure 148: Philippines APAC Cashew Industry Volume (Kiloton), by Production Analysis 2025 & 2033
- Figure 149: Philippines APAC Cashew Industry Revenue Share (%), by Production Analysis 2025 & 2033
- Figure 150: Philippines APAC Cashew Industry Volume Share (%), by Production Analysis 2025 & 2033
- Figure 151: Philippines APAC Cashew Industry Revenue (Million), by Consumption Analysis 2025 & 2033
- Figure 152: Philippines APAC Cashew Industry Volume (Kiloton), by Consumption Analysis 2025 & 2033
- Figure 153: Philippines APAC Cashew Industry Revenue Share (%), by Consumption Analysis 2025 & 2033
- Figure 154: Philippines APAC Cashew Industry Volume Share (%), by Consumption Analysis 2025 & 2033
- Figure 155: Philippines APAC Cashew Industry Revenue (Million), by Import Market Analysis (Value & Volume) 2025 & 2033
- Figure 156: Philippines APAC Cashew Industry Volume (Kiloton), by Import Market Analysis (Value & Volume) 2025 & 2033
- Figure 157: Philippines APAC Cashew Industry Revenue Share (%), by Import Market Analysis (Value & Volume) 2025 & 2033
- Figure 158: Philippines APAC Cashew Industry Volume Share (%), by Import Market Analysis (Value & Volume) 2025 & 2033
- Figure 159: Philippines APAC Cashew Industry Revenue (Million), by Export Market Analysis (Value & Volume) 2025 & 2033
- Figure 160: Philippines APAC Cashew Industry Volume (Kiloton), by Export Market Analysis (Value & Volume) 2025 & 2033
- Figure 161: Philippines APAC Cashew Industry Revenue Share (%), by Export Market Analysis (Value & Volume) 2025 & 2033
- Figure 162: Philippines APAC Cashew Industry Volume Share (%), by Export Market Analysis (Value & Volume) 2025 & 2033
- Figure 163: Philippines APAC Cashew Industry Revenue (Million), by Price Trend Analysis 2025 & 2033
- Figure 164: Philippines APAC Cashew Industry Volume (Kiloton), by Price Trend Analysis 2025 & 2033
- Figure 165: Philippines APAC Cashew Industry Revenue Share (%), by Price Trend Analysis 2025 & 2033
- Figure 166: Philippines APAC Cashew Industry Volume Share (%), by Price Trend Analysis 2025 & 2033
- Figure 167: Philippines APAC Cashew Industry Revenue (Million), by Country 2025 & 2033
- Figure 168: Philippines APAC Cashew Industry Volume (Kiloton), by Country 2025 & 2033
- Figure 169: Philippines APAC Cashew Industry Revenue Share (%), by Country 2025 & 2033
- Figure 170: Philippines APAC Cashew Industry Volume Share (%), by Country 2025 & 2033
List of Tables
- Table 1: Global APAC Cashew Industry Revenue Million Forecast, by Production Analysis 2020 & 2033
- Table 2: Global APAC Cashew Industry Volume Kiloton Forecast, by Production Analysis 2020 & 2033
- Table 3: Global APAC Cashew Industry Revenue Million Forecast, by Consumption Analysis 2020 & 2033
- Table 4: Global APAC Cashew Industry Volume Kiloton Forecast, by Consumption Analysis 2020 & 2033
- Table 5: Global APAC Cashew Industry Revenue Million Forecast, by Import Market Analysis (Value & Volume) 2020 & 2033
- Table 6: Global APAC Cashew Industry Volume Kiloton Forecast, by Import Market Analysis (Value & Volume) 2020 & 2033
- Table 7: Global APAC Cashew Industry Revenue Million Forecast, by Export Market Analysis (Value & Volume) 2020 & 2033
- Table 8: Global APAC Cashew Industry Volume Kiloton Forecast, by Export Market Analysis (Value & Volume) 2020 & 2033
- Table 9: Global APAC Cashew Industry Revenue Million Forecast, by Price Trend Analysis 2020 & 2033
- Table 10: Global APAC Cashew Industry Volume Kiloton Forecast, by Price Trend Analysis 2020 & 2033
- Table 11: Global APAC Cashew Industry Revenue Million Forecast, by Region 2020 & 2033
- Table 12: Global APAC Cashew Industry Volume Kiloton Forecast, by Region 2020 & 2033
- Table 13: Global APAC Cashew Industry Revenue Million Forecast, by Production Analysis 2020 & 2033
- Table 14: Global APAC Cashew Industry Volume Kiloton Forecast, by Production Analysis 2020 & 2033
- Table 15: Global APAC Cashew Industry Revenue Million Forecast, by Consumption Analysis 2020 & 2033
- Table 16: Global APAC Cashew Industry Volume Kiloton Forecast, by Consumption Analysis 2020 & 2033
- Table 17: Global APAC Cashew Industry Revenue Million Forecast, by Import Market Analysis (Value & Volume) 2020 & 2033
- Table 18: Global APAC Cashew Industry Volume Kiloton Forecast, by Import Market Analysis (Value & Volume) 2020 & 2033
- Table 19: Global APAC Cashew Industry Revenue Million Forecast, by Export Market Analysis (Value & Volume) 2020 & 2033
- Table 20: Global APAC Cashew Industry Volume Kiloton Forecast, by Export Market Analysis (Value & Volume) 2020 & 2033
- Table 21: Global APAC Cashew Industry Revenue Million Forecast, by Price Trend Analysis 2020 & 2033
- Table 22: Global APAC Cashew Industry Volume Kiloton Forecast, by Price Trend Analysis 2020 & 2033
- Table 23: Global APAC Cashew Industry Revenue Million Forecast, by Country 2020 & 2033
- Table 24: Global APAC Cashew Industry Volume Kiloton Forecast, by Country 2020 & 2033
- Table 25: Global APAC Cashew Industry Revenue Million Forecast, by Production Analysis 2020 & 2033
- Table 26: Global APAC Cashew Industry Volume Kiloton Forecast, by Production Analysis 2020 & 2033
- Table 27: Global APAC Cashew Industry Revenue Million Forecast, by Consumption Analysis 2020 & 2033
- Table 28: Global APAC Cashew Industry Volume Kiloton Forecast, by Consumption Analysis 2020 & 2033
- Table 29: Global APAC Cashew Industry Revenue Million Forecast, by Import Market Analysis (Value & Volume) 2020 & 2033
- Table 30: Global APAC Cashew Industry Volume Kiloton Forecast, by Import Market Analysis (Value & Volume) 2020 & 2033
- Table 31: Global APAC Cashew Industry Revenue Million Forecast, by Export Market Analysis (Value & Volume) 2020 & 2033
- Table 32: Global APAC Cashew Industry Volume Kiloton Forecast, by Export Market Analysis (Value & Volume) 2020 & 2033
- Table 33: Global APAC Cashew Industry Revenue Million Forecast, by Price Trend Analysis 2020 & 2033
- Table 34: Global APAC Cashew Industry Volume Kiloton Forecast, by Price Trend Analysis 2020 & 2033
- Table 35: Global APAC Cashew Industry Revenue Million Forecast, by Country 2020 & 2033
- Table 36: Global APAC Cashew Industry Volume Kiloton Forecast, by Country 2020 & 2033
- Table 37: Global APAC Cashew Industry Revenue Million Forecast, by Production Analysis 2020 & 2033
- Table 38: Global APAC Cashew Industry Volume Kiloton Forecast, by Production Analysis 2020 & 2033
- Table 39: Global APAC Cashew Industry Revenue Million Forecast, by Consumption Analysis 2020 & 2033
- Table 40: Global APAC Cashew Industry Volume Kiloton Forecast, by Consumption Analysis 2020 & 2033
- Table 41: Global APAC Cashew Industry Revenue Million Forecast, by Import Market Analysis (Value & Volume) 2020 & 2033
- Table 42: Global APAC Cashew Industry Volume Kiloton Forecast, by Import Market Analysis (Value & Volume) 2020 & 2033
- Table 43: Global APAC Cashew Industry Revenue Million Forecast, by Export Market Analysis (Value & Volume) 2020 & 2033
- Table 44: Global APAC Cashew Industry Volume Kiloton Forecast, by Export Market Analysis (Value & Volume) 2020 & 2033
- Table 45: Global APAC Cashew Industry Revenue Million Forecast, by Price Trend Analysis 2020 & 2033
- Table 46: Global APAC Cashew Industry Volume Kiloton Forecast, by Price Trend Analysis 2020 & 2033
- Table 47: Global APAC Cashew Industry Revenue Million Forecast, by Country 2020 & 2033
- Table 48: Global APAC Cashew Industry Volume Kiloton Forecast, by Country 2020 & 2033
- Table 49: Global APAC Cashew Industry Revenue Million Forecast, by Production Analysis 2020 & 2033
- Table 50: Global APAC Cashew Industry Volume Kiloton Forecast, by Production Analysis 2020 & 2033
- Table 51: Global APAC Cashew Industry Revenue Million Forecast, by Consumption Analysis 2020 & 2033
- Table 52: Global APAC Cashew Industry Volume Kiloton Forecast, by Consumption Analysis 2020 & 2033
- Table 53: Global APAC Cashew Industry Revenue Million Forecast, by Import Market Analysis (Value & Volume) 2020 & 2033
- Table 54: Global APAC Cashew Industry Volume Kiloton Forecast, by Import Market Analysis (Value & Volume) 2020 & 2033
- Table 55: Global APAC Cashew Industry Revenue Million Forecast, by Export Market Analysis (Value & Volume) 2020 & 2033
- Table 56: Global APAC Cashew Industry Volume Kiloton Forecast, by Export Market Analysis (Value & Volume) 2020 & 2033
- Table 57: Global APAC Cashew Industry Revenue Million Forecast, by Price Trend Analysis 2020 & 2033
- Table 58: Global APAC Cashew Industry Volume Kiloton Forecast, by Price Trend Analysis 2020 & 2033
- Table 59: Global APAC Cashew Industry Revenue Million Forecast, by Country 2020 & 2033
- Table 60: Global APAC Cashew Industry Volume Kiloton Forecast, by Country 2020 & 2033
- Table 61: Global APAC Cashew Industry Revenue Million Forecast, by Production Analysis 2020 & 2033
- Table 62: Global APAC Cashew Industry Volume Kiloton Forecast, by Production Analysis 2020 & 2033
- Table 63: Global APAC Cashew Industry Revenue Million Forecast, by Consumption Analysis 2020 & 2033
- Table 64: Global APAC Cashew Industry Volume Kiloton Forecast, by Consumption Analysis 2020 & 2033
- Table 65: Global APAC Cashew Industry Revenue Million Forecast, by Import Market Analysis (Value & Volume) 2020 & 2033
- Table 66: Global APAC Cashew Industry Volume Kiloton Forecast, by Import Market Analysis (Value & Volume) 2020 & 2033
- Table 67: Global APAC Cashew Industry Revenue Million Forecast, by Export Market Analysis (Value & Volume) 2020 & 2033
- Table 68: Global APAC Cashew Industry Volume Kiloton Forecast, by Export Market Analysis (Value & Volume) 2020 & 2033
- Table 69: Global APAC Cashew Industry Revenue Million Forecast, by Price Trend Analysis 2020 & 2033
- Table 70: Global APAC Cashew Industry Volume Kiloton Forecast, by Price Trend Analysis 2020 & 2033
- Table 71: Global APAC Cashew Industry Revenue Million Forecast, by Country 2020 & 2033
- Table 72: Global APAC Cashew Industry Volume Kiloton Forecast, by Country 2020 & 2033
- Table 73: Global APAC Cashew Industry Revenue Million Forecast, by Production Analysis 2020 & 2033
- Table 74: Global APAC Cashew Industry Volume Kiloton Forecast, by Production Analysis 2020 & 2033
- Table 75: Global APAC Cashew Industry Revenue Million Forecast, by Consumption Analysis 2020 & 2033
- Table 76: Global APAC Cashew Industry Volume Kiloton Forecast, by Consumption Analysis 2020 & 2033
- Table 77: Global APAC Cashew Industry Revenue Million Forecast, by Import Market Analysis (Value & Volume) 2020 & 2033
- Table 78: Global APAC Cashew Industry Volume Kiloton Forecast, by Import Market Analysis (Value & Volume) 2020 & 2033
- Table 79: Global APAC Cashew Industry Revenue Million Forecast, by Export Market Analysis (Value & Volume) 2020 & 2033
- Table 80: Global APAC Cashew Industry Volume Kiloton Forecast, by Export Market Analysis (Value & Volume) 2020 & 2033
- Table 81: Global APAC Cashew Industry Revenue Million Forecast, by Price Trend Analysis 2020 & 2033
- Table 82: Global APAC Cashew Industry Volume Kiloton Forecast, by Price Trend Analysis 2020 & 2033
- Table 83: Global APAC Cashew Industry Revenue Million Forecast, by Country 2020 & 2033
- Table 84: Global APAC Cashew Industry Volume Kiloton Forecast, by Country 2020 & 2033
- Table 85: Global APAC Cashew Industry Revenue Million Forecast, by Production Analysis 2020 & 2033
- Table 86: Global APAC Cashew Industry Volume Kiloton Forecast, by Production Analysis 2020 & 2033
- Table 87: Global APAC Cashew Industry Revenue Million Forecast, by Consumption Analysis 2020 & 2033
- Table 88: Global APAC Cashew Industry Volume Kiloton Forecast, by Consumption Analysis 2020 & 2033
- Table 89: Global APAC Cashew Industry Revenue Million Forecast, by Import Market Analysis (Value & Volume) 2020 & 2033
- Table 90: Global APAC Cashew Industry Volume Kiloton Forecast, by Import Market Analysis (Value & Volume) 2020 & 2033
- Table 91: Global APAC Cashew Industry Revenue Million Forecast, by Export Market Analysis (Value & Volume) 2020 & 2033
- Table 92: Global APAC Cashew Industry Volume Kiloton Forecast, by Export Market Analysis (Value & Volume) 2020 & 2033
- Table 93: Global APAC Cashew Industry Revenue Million Forecast, by Price Trend Analysis 2020 & 2033
- Table 94: Global APAC Cashew Industry Volume Kiloton Forecast, by Price Trend Analysis 2020 & 2033
- Table 95: Global APAC Cashew Industry Revenue Million Forecast, by Country 2020 & 2033
- Table 96: Global APAC Cashew Industry Volume Kiloton Forecast, by Country 2020 & 2033
Frequently Asked Questions
1. What is the projected Compound Annual Growth Rate (CAGR) of the APAC Cashew Industry?
The projected CAGR is approximately 4.44%.
2. Which companies are prominent players in the APAC Cashew Industry?
Key companies in the market include Olam International, Nutreco, Vietnam Cashew Association , All India Cashew Processors and Exporters Association, Sime Darby Oils .
3. What are the main segments of the APAC Cashew Industry?
The market segments include Production Analysis, Consumption Analysis, Import Market Analysis (Value & Volume), Export Market Analysis (Value & Volume), Price Trend Analysis.
4. Can you provide details about the market size?
The market size is estimated to be USD 7.26 Million as of 2022.
5. What are some drivers contributing to market growth?
Rising Consumption of Cashew Nuts as a Healthy Snack; Increasing Government initiatives; Growing Cashew Nut Imports in The United States.
6. What are the notable trends driving market growth?
Increased Cashew Application in Food Industry to boost the Market.
7. Are there any restraints impacting market growth?
Hazardous Climatic Condition Hinders Cashew Production; Stringent Regulations Related To Food Quality Standards.
8. Can you provide examples of recent developments in the market?
January 2023: According to CRISIL (an Indian consulting firm offering ratings, analysis, risk, and policy advice) and a branch of S&P Global, the Indian cashew processing industry is driving demand for cashews, which extended beyond USD 300,000 million in 2022, an increase of 15% year-on-year growth in revenue.
9. What pricing options are available for accessing the report?
Pricing options include single-user, multi-user, and enterprise licenses priced at USD 4750, USD 5250, and USD 8750 respectively.
10. Is the market size provided in terms of value or volume?
The market size is provided in terms of value, measured in Million and volume, measured in Kiloton.
11. Are there any specific market keywords associated with the report?
Yes, the market keyword associated with the report is "APAC Cashew Industry," which aids in identifying and referencing the specific market segment covered.
12. How do I determine which pricing option suits my needs best?
The pricing options vary based on user requirements and access needs. Individual users may opt for single-user licenses, while businesses requiring broader access may choose multi-user or enterprise licenses for cost-effective access to the report.
13. Are there any additional resources or data provided in the APAC Cashew Industry report?
While the report offers comprehensive insights, it's advisable to review the specific contents or supplementary materials provided to ascertain if additional resources or data are available.
14. How can I stay updated on further developments or reports in the APAC Cashew Industry?
To stay informed about further developments, trends, and reports in the APAC Cashew Industry, consider subscribing to industry newsletters, following relevant companies and organizations, or regularly checking reputable industry news sources and publications.
Methodology
Step 1 - Identification of Relevant Samples Size from Population Database


Step 2 - Approaches for Defining Global Market Size (Value, Volume* & Price*)

Note*: In applicable scenarios
Step 3 - Data Sources
Primary Research
- Web Analytics
- Survey Reports
- Research Institute
- Latest Research Reports
- Opinion Leaders
Secondary Research
- Annual Reports
- White Paper
- Latest Press Release
- Industry Association
- Paid Database
- Investor Presentations

Step 4 - Data Triangulation
Involves using different sources of information in order to increase the validity of a study
These sources are likely to be stakeholders in a program - participants, other researchers, program staff, other community members, and so on.
Then we put all data in single framework & apply various statistical tools to find out the dynamic on the market.
During the analysis stage, feedback from the stakeholder groups would be compared to determine areas of agreement as well as areas of divergence