

Key Insights
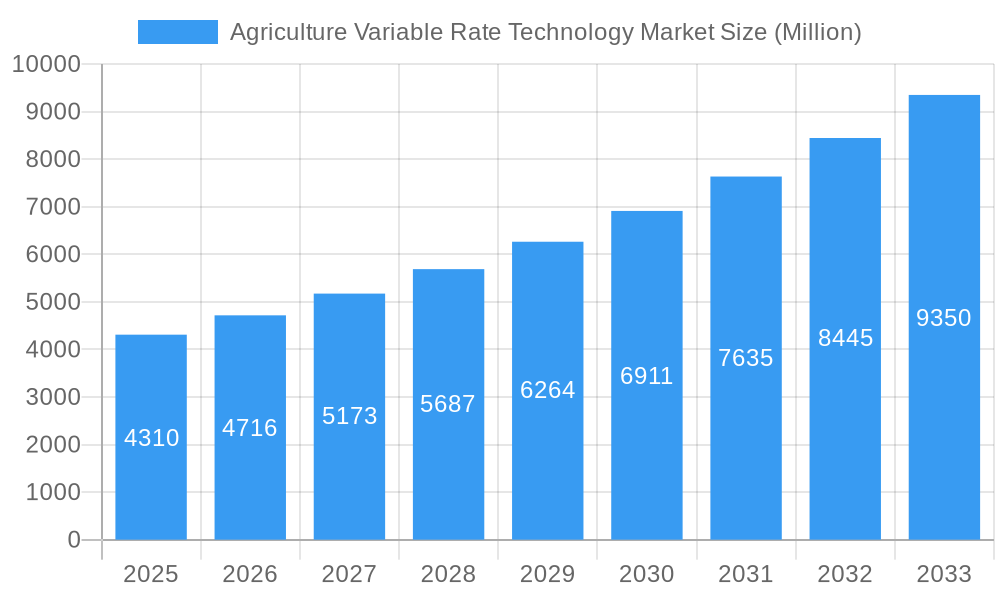
The Agriculture Variable Rate Technology (VRT) market is experiencing robust growth, projected to reach $4.31 billion in 2025 and exhibiting a Compound Annual Growth Rate (CAGR) of 9.40% from 2025 to 2033. This expansion is driven by several key factors. Firstly, the increasing need for precision agriculture to optimize resource utilization and enhance crop yields is a significant catalyst. Farmers are increasingly adopting VRT solutions to address challenges like water scarcity, fertilizer overuse, and pest management, leading to improved profitability and environmental sustainability. Technological advancements, such as the integration of GPS, sensors, and data analytics, are further fueling market growth by enabling more accurate and efficient application of inputs. Furthermore, government initiatives promoting sustainable agricultural practices and precision farming technologies in various regions are fostering market adoption. The segment encompassing fertilizers and crop protection chemicals constitutes a substantial portion of the VRT market, given the precision application requirements of these inputs. Growth in this segment is largely attributed to the increasing demand for optimized nutrient and pesticide application, minimizing environmental impact and maximizing returns.
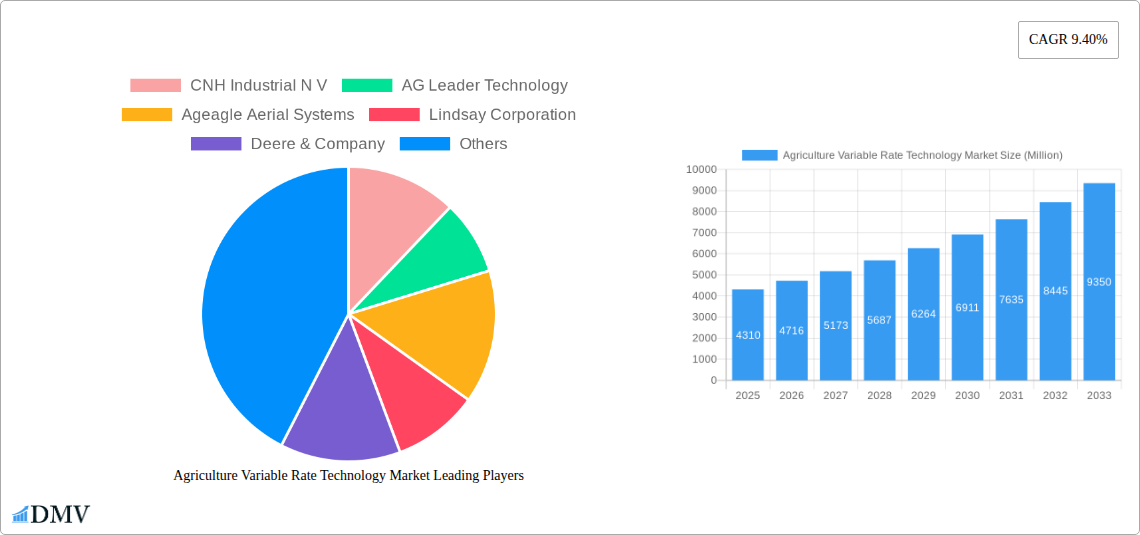
Agriculture Variable Rate Technology Market Market Size (In Billion)
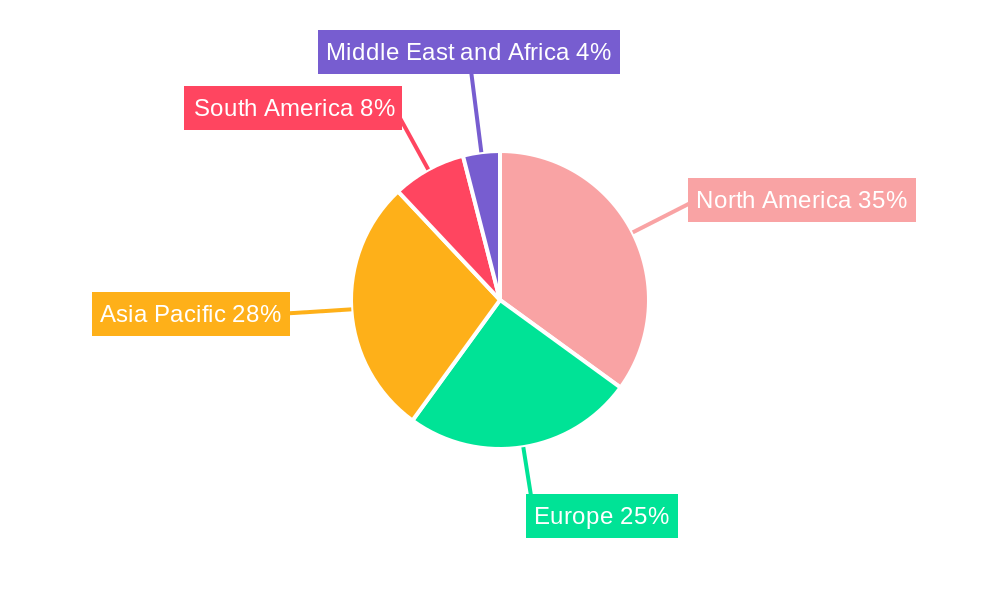
The market segmentation reveals a diverse landscape. Cereals & grains remain the dominant crop type segment, followed by fruits & vegetables and oilseeds & pulses. Geographically, North America currently holds a significant market share, driven by early adoption and technological advancements. However, the Asia-Pacific region is anticipated to experience substantial growth in the coming years due to increasing agricultural land under cultivation and rising farmer awareness of VRT benefits. Competitive forces within the market are intense, with major players such as CNH Industrial N.V., Deere & Company, and Trimble Inc. continuously innovating and expanding their product portfolios. While the market is projected for significant growth, challenges remain including the high initial investment costs associated with VRT adoption and the need for adequate digital infrastructure and skilled labor to support technology implementation in certain regions. Despite these challenges, the long-term outlook for the Agriculture VRT market remains positive, fueled by the ongoing need for enhanced agricultural efficiency and sustainability.
Agriculture Variable Rate Technology Market Company Market Share
Agriculture Variable Rate Technology Market: A Comprehensive Report (2019-2033)
This insightful report provides a detailed analysis of the Agriculture Variable Rate Technology market, offering a comprehensive overview of its current state, future trajectory, and key players. Covering the period from 2019 to 2033, with a focus on 2025, this study is indispensable for stakeholders seeking to understand and capitalize on opportunities within this rapidly evolving sector. The global market is projected to reach xx Million by 2033, exhibiting a significant Compound Annual Growth Rate (CAGR) during the forecast period (2025-2033).
Agriculture Variable Rate Technology Market Market Composition & Trends
The Agriculture Variable Rate Technology market exhibits a moderately consolidated structure, with key players like Deere & Company, Trimble Inc., and CNH Industrial N.V. holding significant market share. However, the market is characterized by ongoing innovation, particularly in precision agriculture technologies like soil sensing and drone-based applications. Regulatory landscapes, varying by region, impact adoption rates, while substitute methods (e.g., conventional farming practices) continue to compete. End-user profiles comprise large-scale commercial farms, increasingly adopting these technologies, alongside smaller farms gradually incorporating these solutions. Mergers and acquisitions (M&A) activity has been significant, with deal values exceeding xx Million in the past five years, driving market consolidation and technology integration.
- Market Share Distribution (2024): Deere & Company (25%), Trimble Inc. (18%), CNH Industrial N.V. (15%), Others (42%).
- M&A Activity (2019-2024): Total deal value exceeding xx Million, with an average deal size of xx Million. Focus on technological acquisitions and expansion into new geographical markets.
Agriculture Variable Rate Technology Market Industry Evolution
The Agriculture Variable Rate Technology market has witnessed substantial growth driven by several key factors. Technological advancements, particularly in sensor technology, data analytics, and automation, have significantly enhanced precision and efficiency. The increasing demand for higher crop yields, coupled with growing awareness of resource management and sustainability, has fueled adoption. Consumer demands for sustainably produced food are also influencing market growth. The historical period (2019-2024) saw a CAGR of xx%, while the forecast period (2025-2033) is expected to witness a CAGR of xx%. Adoption rates are increasing significantly, especially in regions with advanced agricultural practices and strong government support. The integration of IoT devices and AI-powered analytics is creating new opportunities for data-driven decision-making.
Leading Regions, Countries, or Segments in Agriculture Variable Rate Technology Market
The North American market currently dominates the Agriculture Variable Rate Technology sector, driven by high technology adoption rates among large commercial farms and significant government investment in agricultural technology. Within crop types, Cereals & Grains and Oilseeds & Pulses represent the largest segments, reflecting the scale of these crops globally. In terms of applications, Fertilizer application currently holds the largest market share.
- Key Drivers in North America:
- High level of investment in agricultural technology R&D.
- Government incentives and subsidies promoting technology adoption.
- High concentration of large-scale commercial farms.
- Dominant Crop Type: Cereals & Grains, driven by high acreage and widespread adoption of precision farming techniques.
- Leading Application: Fertilizer application, due to its direct impact on crop yields and the potential for significant savings through optimized use.
The European and Asia-Pacific markets are exhibiting strong growth potential, driven by rising food demand and increasing government support for sustainable agricultural practices.
Agriculture Variable Rate Technology Market Product Innovations
Recent innovations focus on enhancing the precision and efficiency of variable rate technology. This includes advancements in sensor technology, providing more accurate data on soil conditions and crop health. Data analytics tools are improving decision-making around fertilizer and pesticide application, optimizing resource use and minimizing environmental impact. The integration of GPS and GIS technologies enhances targeting accuracy, and the development of user-friendly interfaces improves accessibility for farmers of all skill levels. Autonomous systems are gaining traction, promising labor efficiency gains and improved operational precision.
Propelling Factors for Agriculture Variable Rate Technology Market Growth
The market's growth is fueled by several key factors:
- Technological Advancements: Improved sensor technology, data analytics, AI, and automation are enhancing efficiency and precision.
- Rising Food Demand: Growing global population fuels the demand for higher crop yields and efficient resource utilization.
- Government Regulations and Incentives: Many countries promote sustainable farming practices and offer incentives for adopting precision agriculture technologies.
Obstacles in the Agriculture Variable Rate Technology Market
Significant barriers include:
- High Initial Investment Costs: The upfront cost of implementing these technologies can be prohibitive for smaller farms.
- Data Security and Privacy Concerns: The increasing reliance on data raises concerns about data security and privacy.
- Lack of Skilled Labor: Operating and maintaining these sophisticated technologies requires specialized skills.
Future Opportunities in Agriculture Variable Rate Technology Market
Emerging opportunities include:
- Expansion into Developing Markets: Many developing countries present significant growth potential for these technologies.
- Integration of AI and Machine Learning: AI-powered solutions can further optimize resource management and improve decision-making.
- Development of Sustainable Technologies: Technologies focused on minimizing environmental impact will gain significant traction.
Major Players in the Agriculture Variable Rate Technology Market Ecosystem
- CNH Industrial N.V.
- AG Leader Technology
- Ageagle Aerial Systems
- Lindsay Corporation
- Deere & Company
- Trimble Inc.
- Topcon Corporation
- Valmont Industries Inc.
- Raven Industries Inc.
- AGCO Corporation
Key Developments in Agriculture Variable Rate Technology Market Industry
- Jan 2023: Deere & Company launched a new precision farming platform integrating AI capabilities.
- March 2022: Trimble Inc. acquired a precision agriculture software company, expanding its data analytics capabilities.
- July 2021: CNH Industrial N.V. announced a strategic partnership to develop autonomous farming solutions.
Strategic Agriculture Variable Rate Technology Market Market Forecast
The Agriculture Variable Rate Technology market is poised for significant growth driven by continued technological advancements, increasing demand for higher crop yields, and growing awareness of sustainable agriculture practices. The market is expected to witness a strong expansion over the forecast period, particularly in developing regions and emerging agricultural applications. The integration of AI and the adoption of autonomous solutions will be key drivers in the coming years.
Agriculture Variable Rate Technology Market Segmentation
-
1. Crop Type
- 1.1. Cereals & Grains
- 1.2. Fruits and Vegetables
- 1.3. Oilseeds & Pulses
- 1.4. Commercial Crops
-
2. Application
- 2.1. Fertilizers
- 2.2. Crop Protection Chemicals
- 2.3. Soil Sensing
- 2.4. Yield Monitoring
- 2.5. Irrigation
- 2.6. Others
Agriculture Variable Rate Technology Market Segmentation By Geography
-
1. North America
- 1.1. United States
- 1.2. Canada
- 1.3. Mexico
-
2. South America
- 2.1. Brazil
- 2.2. Argentina
- 2.3. Rest of South America
-
3. Europe
- 3.1. United Kingdom
- 3.2. Germany
- 3.3. France
- 3.4. Italy
- 3.5. Spain
- 3.6. Russia
- 3.7. Benelux
- 3.8. Nordics
- 3.9. Rest of Europe
-
4. Middle East & Africa
- 4.1. Turkey
- 4.2. Israel
- 4.3. GCC
- 4.4. North Africa
- 4.5. South Africa
- 4.6. Rest of Middle East & Africa
-
5. Asia Pacific
- 5.1. China
- 5.2. India
- 5.3. Japan
- 5.4. South Korea
- 5.5. ASEAN
- 5.6. Oceania
- 5.7. Rest of Asia Pacific
Agriculture Variable Rate Technology Market Regional Market Share
Geographic Coverage of Agriculture Variable Rate Technology Market
Agriculture Variable Rate Technology Market REPORT HIGHLIGHTS
| Aspects | Details |
|---|---|
| Study Period | 2020-2034 |
| Base Year | 2025 |
| Estimated Year | 2026 |
| Forecast Period | 2026-2034 |
| Historical Period | 2020-2025 |
| Growth Rate | CAGR of 9.40% from 2020-2034 |
| Segmentation |
|
Table of Contents
- 1. Introduction
- 1.1. Research Scope
- 1.2. Market Segmentation
- 1.3. Research Objective
- 1.4. Definitions and Assumptions
- 2. Executive Summary
- 2.1. Market Snapshot
- 3. Market Dynamics
- 3.1. Market Drivers
- 3.2. Market Restrains
- 3.3. Market Trends
- 3.4. Market Opportunities
- 4. Market Factor Analysis
- 4.1. Porters Five Forces
- 4.1.1. Bargaining Power of Suppliers
- 4.1.2. Bargaining Power of Buyers
- 4.1.3. Threat of New Entrants
- 4.1.4. Threat of Substitutes
- 4.1.5. Competitive Rivalry
- 4.2. PESTEL analysis
- 4.3. BCG Analysis
- 4.3.1. Stars (High Growth, High Market Share)
- 4.3.2. Cash Cows (Low Growth, High Market Share)
- 4.3.3. Question Mark (High Growth, Low Market Share)
- 4.3.4. Dogs (Low Growth, Low Market Share)
- 4.4. Ansoff Matrix Analysis
- 4.5. Supply Chain Analysis
- 4.6. Regulatory Landscape
- 4.7. Current Market Potential and Opportunity Assessment (TAM–SAM–SOM Framework)
- 4.8. DMV Analyst Note
- 4.1. Porters Five Forces
- 5. Market Analysis, Insights and Forecast 2021-2033
- 5.1. Market Analysis, Insights and Forecast - by Crop Type
- 5.1.1. Cereals & Grains
- 5.1.2. Fruits and Vegetables
- 5.1.3. Oilseeds & Pulses
- 5.1.4. Commercial Crops
- 5.2. Market Analysis, Insights and Forecast - by Application
- 5.2.1. Fertilizers
- 5.2.2. Crop Protection Chemicals
- 5.2.3. Soil Sensing
- 5.2.4. Yield Monitoring
- 5.2.5. Irrigation
- 5.2.6. Others
- 5.3. Market Analysis, Insights and Forecast - by Region
- 5.3.1. North America
- 5.3.2. South America
- 5.3.3. Europe
- 5.3.4. Middle East & Africa
- 5.3.5. Asia Pacific
- 5.1. Market Analysis, Insights and Forecast - by Crop Type
- 6. Global Agriculture Variable Rate Technology Market Analysis, Insights and Forecast, 2021-2033
- 6.1. Market Analysis, Insights and Forecast - by Crop Type
- 6.1.1. Cereals & Grains
- 6.1.2. Fruits and Vegetables
- 6.1.3. Oilseeds & Pulses
- 6.1.4. Commercial Crops
- 6.2. Market Analysis, Insights and Forecast - by Application
- 6.2.1. Fertilizers
- 6.2.2. Crop Protection Chemicals
- 6.2.3. Soil Sensing
- 6.2.4. Yield Monitoring
- 6.2.5. Irrigation
- 6.2.6. Others
- 6.1. Market Analysis, Insights and Forecast - by Crop Type
- 7. North America Agriculture Variable Rate Technology Market Analysis, Insights and Forecast, 2020-2032
- 7.1. Market Analysis, Insights and Forecast - by Crop Type
- 7.1.1. Cereals & Grains
- 7.1.2. Fruits and Vegetables
- 7.1.3. Oilseeds & Pulses
- 7.1.4. Commercial Crops
- 7.2. Market Analysis, Insights and Forecast - by Application
- 7.2.1. Fertilizers
- 7.2.2. Crop Protection Chemicals
- 7.2.3. Soil Sensing
- 7.2.4. Yield Monitoring
- 7.2.5. Irrigation
- 7.2.6. Others
- 7.1. Market Analysis, Insights and Forecast - by Crop Type
- 8. South America Agriculture Variable Rate Technology Market Analysis, Insights and Forecast, 2020-2032
- 8.1. Market Analysis, Insights and Forecast - by Crop Type
- 8.1.1. Cereals & Grains
- 8.1.2. Fruits and Vegetables
- 8.1.3. Oilseeds & Pulses
- 8.1.4. Commercial Crops
- 8.2. Market Analysis, Insights and Forecast - by Application
- 8.2.1. Fertilizers
- 8.2.2. Crop Protection Chemicals
- 8.2.3. Soil Sensing
- 8.2.4. Yield Monitoring
- 8.2.5. Irrigation
- 8.2.6. Others
- 8.1. Market Analysis, Insights and Forecast - by Crop Type
- 9. Europe Agriculture Variable Rate Technology Market Analysis, Insights and Forecast, 2020-2032
- 9.1. Market Analysis, Insights and Forecast - by Crop Type
- 9.1.1. Cereals & Grains
- 9.1.2. Fruits and Vegetables
- 9.1.3. Oilseeds & Pulses
- 9.1.4. Commercial Crops
- 9.2. Market Analysis, Insights and Forecast - by Application
- 9.2.1. Fertilizers
- 9.2.2. Crop Protection Chemicals
- 9.2.3. Soil Sensing
- 9.2.4. Yield Monitoring
- 9.2.5. Irrigation
- 9.2.6. Others
- 9.1. Market Analysis, Insights and Forecast - by Crop Type
- 10. Middle East & Africa Agriculture Variable Rate Technology Market Analysis, Insights and Forecast, 2020-2032
- 10.1. Market Analysis, Insights and Forecast - by Crop Type
- 10.1.1. Cereals & Grains
- 10.1.2. Fruits and Vegetables
- 10.1.3. Oilseeds & Pulses
- 10.1.4. Commercial Crops
- 10.2. Market Analysis, Insights and Forecast - by Application
- 10.2.1. Fertilizers
- 10.2.2. Crop Protection Chemicals
- 10.2.3. Soil Sensing
- 10.2.4. Yield Monitoring
- 10.2.5. Irrigation
- 10.2.6. Others
- 10.1. Market Analysis, Insights and Forecast - by Crop Type
- 11. Asia Pacific Agriculture Variable Rate Technology Market Analysis, Insights and Forecast, 2020-2032
- 11.1. Market Analysis, Insights and Forecast - by Crop Type
- 11.1.1. Cereals & Grains
- 11.1.2. Fruits and Vegetables
- 11.1.3. Oilseeds & Pulses
- 11.1.4. Commercial Crops
- 11.2. Market Analysis, Insights and Forecast - by Application
- 11.2.1. Fertilizers
- 11.2.2. Crop Protection Chemicals
- 11.2.3. Soil Sensing
- 11.2.4. Yield Monitoring
- 11.2.5. Irrigation
- 11.2.6. Others
- 11.1. Market Analysis, Insights and Forecast - by Crop Type
- 12. Competitive Analysis
- 12.1. Company Profiles
- 12.1.1 CNH Industrial N V
- 12.1.1.1. Company Overview
- 12.1.1.2. Products
- 12.1.1.3. Company Financials
- 12.1.1.4. SWOT Analysis
- 12.1.2 AG Leader Technology
- 12.1.2.1. Company Overview
- 12.1.2.2. Products
- 12.1.2.3. Company Financials
- 12.1.2.4. SWOT Analysis
- 12.1.3 Ageagle Aerial Systems
- 12.1.3.1. Company Overview
- 12.1.3.2. Products
- 12.1.3.3. Company Financials
- 12.1.3.4. SWOT Analysis
- 12.1.4 Lindsay Corporation
- 12.1.4.1. Company Overview
- 12.1.4.2. Products
- 12.1.4.3. Company Financials
- 12.1.4.4. SWOT Analysis
- 12.1.5 Deere & Company
- 12.1.5.1. Company Overview
- 12.1.5.2. Products
- 12.1.5.3. Company Financials
- 12.1.5.4. SWOT Analysis
- 12.1.6 Trimble Inc
- 12.1.6.1. Company Overview
- 12.1.6.2. Products
- 12.1.6.3. Company Financials
- 12.1.6.4. SWOT Analysis
- 12.1.7 Topcon Corporation
- 12.1.7.1. Company Overview
- 12.1.7.2. Products
- 12.1.7.3. Company Financials
- 12.1.7.4. SWOT Analysis
- 12.1.8 Valmont Industries Inc
- 12.1.8.1. Company Overview
- 12.1.8.2. Products
- 12.1.8.3. Company Financials
- 12.1.8.4. SWOT Analysis
- 12.1.9 Raven Industries Inc
- 12.1.9.1. Company Overview
- 12.1.9.2. Products
- 12.1.9.3. Company Financials
- 12.1.9.4. SWOT Analysis
- 12.1.10 AGCO Corporation
- 12.1.10.1. Company Overview
- 12.1.10.2. Products
- 12.1.10.3. Company Financials
- 12.1.10.4. SWOT Analysis
- 12.1.1 CNH Industrial N V
- 12.2. Market Entropy
- 12.2.1 Company's Key Areas Served
- 12.2.2 Recent Developments
- 12.3. Company Market Share Analysis 2025
- 12.3.1 Top 5 Companies Market Share Analysis
- 12.3.2 Top 3 Companies Market Share Analysis
- 12.4. List of Potential Customers
- 13. Research Methodology
List of Figures
- Figure 1: Global Agriculture Variable Rate Technology Market Revenue Breakdown (Million, %) by Region 2025 & 2033
- Figure 2: North America Agriculture Variable Rate Technology Market Revenue (Million), by Crop Type 2025 & 2033
- Figure 3: North America Agriculture Variable Rate Technology Market Revenue Share (%), by Crop Type 2025 & 2033
- Figure 4: North America Agriculture Variable Rate Technology Market Revenue (Million), by Application 2025 & 2033
- Figure 5: North America Agriculture Variable Rate Technology Market Revenue Share (%), by Application 2025 & 2033
- Figure 6: North America Agriculture Variable Rate Technology Market Revenue (Million), by Country 2025 & 2033
- Figure 7: North America Agriculture Variable Rate Technology Market Revenue Share (%), by Country 2025 & 2033
- Figure 8: South America Agriculture Variable Rate Technology Market Revenue (Million), by Crop Type 2025 & 2033
- Figure 9: South America Agriculture Variable Rate Technology Market Revenue Share (%), by Crop Type 2025 & 2033
- Figure 10: South America Agriculture Variable Rate Technology Market Revenue (Million), by Application 2025 & 2033
- Figure 11: South America Agriculture Variable Rate Technology Market Revenue Share (%), by Application 2025 & 2033
- Figure 12: South America Agriculture Variable Rate Technology Market Revenue (Million), by Country 2025 & 2033
- Figure 13: South America Agriculture Variable Rate Technology Market Revenue Share (%), by Country 2025 & 2033
- Figure 14: Europe Agriculture Variable Rate Technology Market Revenue (Million), by Crop Type 2025 & 2033
- Figure 15: Europe Agriculture Variable Rate Technology Market Revenue Share (%), by Crop Type 2025 & 2033
- Figure 16: Europe Agriculture Variable Rate Technology Market Revenue (Million), by Application 2025 & 2033
- Figure 17: Europe Agriculture Variable Rate Technology Market Revenue Share (%), by Application 2025 & 2033
- Figure 18: Europe Agriculture Variable Rate Technology Market Revenue (Million), by Country 2025 & 2033
- Figure 19: Europe Agriculture Variable Rate Technology Market Revenue Share (%), by Country 2025 & 2033
- Figure 20: Middle East & Africa Agriculture Variable Rate Technology Market Revenue (Million), by Crop Type 2025 & 2033
- Figure 21: Middle East & Africa Agriculture Variable Rate Technology Market Revenue Share (%), by Crop Type 2025 & 2033
- Figure 22: Middle East & Africa Agriculture Variable Rate Technology Market Revenue (Million), by Application 2025 & 2033
- Figure 23: Middle East & Africa Agriculture Variable Rate Technology Market Revenue Share (%), by Application 2025 & 2033
- Figure 24: Middle East & Africa Agriculture Variable Rate Technology Market Revenue (Million), by Country 2025 & 2033
- Figure 25: Middle East & Africa Agriculture Variable Rate Technology Market Revenue Share (%), by Country 2025 & 2033
- Figure 26: Asia Pacific Agriculture Variable Rate Technology Market Revenue (Million), by Crop Type 2025 & 2033
- Figure 27: Asia Pacific Agriculture Variable Rate Technology Market Revenue Share (%), by Crop Type 2025 & 2033
- Figure 28: Asia Pacific Agriculture Variable Rate Technology Market Revenue (Million), by Application 2025 & 2033
- Figure 29: Asia Pacific Agriculture Variable Rate Technology Market Revenue Share (%), by Application 2025 & 2033
- Figure 30: Asia Pacific Agriculture Variable Rate Technology Market Revenue (Million), by Country 2025 & 2033
- Figure 31: Asia Pacific Agriculture Variable Rate Technology Market Revenue Share (%), by Country 2025 & 2033
List of Tables
- Table 1: Global Agriculture Variable Rate Technology Market Revenue Million Forecast, by Crop Type 2020 & 2033
- Table 2: Global Agriculture Variable Rate Technology Market Revenue Million Forecast, by Application 2020 & 2033
- Table 3: Global Agriculture Variable Rate Technology Market Revenue Million Forecast, by Region 2020 & 2033
- Table 4: Global Agriculture Variable Rate Technology Market Revenue Million Forecast, by Crop Type 2020 & 2033
- Table 5: Global Agriculture Variable Rate Technology Market Revenue Million Forecast, by Application 2020 & 2033
- Table 6: Global Agriculture Variable Rate Technology Market Revenue Million Forecast, by Country 2020 & 2033
- Table 7: United States Agriculture Variable Rate Technology Market Revenue (Million) Forecast, by Application 2020 & 2033
- Table 8: Canada Agriculture Variable Rate Technology Market Revenue (Million) Forecast, by Application 2020 & 2033
- Table 9: Mexico Agriculture Variable Rate Technology Market Revenue (Million) Forecast, by Application 2020 & 2033
- Table 10: Global Agriculture Variable Rate Technology Market Revenue Million Forecast, by Crop Type 2020 & 2033
- Table 11: Global Agriculture Variable Rate Technology Market Revenue Million Forecast, by Application 2020 & 2033
- Table 12: Global Agriculture Variable Rate Technology Market Revenue Million Forecast, by Country 2020 & 2033
- Table 13: Brazil Agriculture Variable Rate Technology Market Revenue (Million) Forecast, by Application 2020 & 2033
- Table 14: Argentina Agriculture Variable Rate Technology Market Revenue (Million) Forecast, by Application 2020 & 2033
- Table 15: Rest of South America Agriculture Variable Rate Technology Market Revenue (Million) Forecast, by Application 2020 & 2033
- Table 16: Global Agriculture Variable Rate Technology Market Revenue Million Forecast, by Crop Type 2020 & 2033
- Table 17: Global Agriculture Variable Rate Technology Market Revenue Million Forecast, by Application 2020 & 2033
- Table 18: Global Agriculture Variable Rate Technology Market Revenue Million Forecast, by Country 2020 & 2033
- Table 19: United Kingdom Agriculture Variable Rate Technology Market Revenue (Million) Forecast, by Application 2020 & 2033
- Table 20: Germany Agriculture Variable Rate Technology Market Revenue (Million) Forecast, by Application 2020 & 2033
- Table 21: France Agriculture Variable Rate Technology Market Revenue (Million) Forecast, by Application 2020 & 2033
- Table 22: Italy Agriculture Variable Rate Technology Market Revenue (Million) Forecast, by Application 2020 & 2033
- Table 23: Spain Agriculture Variable Rate Technology Market Revenue (Million) Forecast, by Application 2020 & 2033
- Table 24: Russia Agriculture Variable Rate Technology Market Revenue (Million) Forecast, by Application 2020 & 2033
- Table 25: Benelux Agriculture Variable Rate Technology Market Revenue (Million) Forecast, by Application 2020 & 2033
- Table 26: Nordics Agriculture Variable Rate Technology Market Revenue (Million) Forecast, by Application 2020 & 2033
- Table 27: Rest of Europe Agriculture Variable Rate Technology Market Revenue (Million) Forecast, by Application 2020 & 2033
- Table 28: Global Agriculture Variable Rate Technology Market Revenue Million Forecast, by Crop Type 2020 & 2033
- Table 29: Global Agriculture Variable Rate Technology Market Revenue Million Forecast, by Application 2020 & 2033
- Table 30: Global Agriculture Variable Rate Technology Market Revenue Million Forecast, by Country 2020 & 2033
- Table 31: Turkey Agriculture Variable Rate Technology Market Revenue (Million) Forecast, by Application 2020 & 2033
- Table 32: Israel Agriculture Variable Rate Technology Market Revenue (Million) Forecast, by Application 2020 & 2033
- Table 33: GCC Agriculture Variable Rate Technology Market Revenue (Million) Forecast, by Application 2020 & 2033
- Table 34: North Africa Agriculture Variable Rate Technology Market Revenue (Million) Forecast, by Application 2020 & 2033
- Table 35: South Africa Agriculture Variable Rate Technology Market Revenue (Million) Forecast, by Application 2020 & 2033
- Table 36: Rest of Middle East & Africa Agriculture Variable Rate Technology Market Revenue (Million) Forecast, by Application 2020 & 2033
- Table 37: Global Agriculture Variable Rate Technology Market Revenue Million Forecast, by Crop Type 2020 & 2033
- Table 38: Global Agriculture Variable Rate Technology Market Revenue Million Forecast, by Application 2020 & 2033
- Table 39: Global Agriculture Variable Rate Technology Market Revenue Million Forecast, by Country 2020 & 2033
- Table 40: China Agriculture Variable Rate Technology Market Revenue (Million) Forecast, by Application 2020 & 2033
- Table 41: India Agriculture Variable Rate Technology Market Revenue (Million) Forecast, by Application 2020 & 2033
- Table 42: Japan Agriculture Variable Rate Technology Market Revenue (Million) Forecast, by Application 2020 & 2033
- Table 43: South Korea Agriculture Variable Rate Technology Market Revenue (Million) Forecast, by Application 2020 & 2033
- Table 44: ASEAN Agriculture Variable Rate Technology Market Revenue (Million) Forecast, by Application 2020 & 2033
- Table 45: Oceania Agriculture Variable Rate Technology Market Revenue (Million) Forecast, by Application 2020 & 2033
- Table 46: Rest of Asia Pacific Agriculture Variable Rate Technology Market Revenue (Million) Forecast, by Application 2020 & 2033
Frequently Asked Questions
1. What is the projected Compound Annual Growth Rate (CAGR) of the Agriculture Variable Rate Technology Market?
The projected CAGR is approximately 9.40%.
2. Which companies are prominent players in the Agriculture Variable Rate Technology Market?
Key companies in the market include CNH Industrial N V, AG Leader Technology, Ageagle Aerial Systems, Lindsay Corporation, Deere & Company, Trimble Inc, Topcon Corporation, Valmont Industries Inc, Raven Industries Inc, AGCO Corporation.
3. What are the main segments of the Agriculture Variable Rate Technology Market?
The market segments include Crop Type, Application.
4. Can you provide details about the market size?
The market size is estimated to be USD 4.31 Million as of 2022.
5. What are some drivers contributing to market growth?
Low Availability of Skilled Labor; Technological Advancements.
6. What are the notable trends driving market growth?
Increasing Adoption of Digital Technologies in the Agricultural Sector.
7. Are there any restraints impacting market growth?
Increasing Farm Expenditure; Security Concerns in Modern Farming Machinery.
8. Can you provide examples of recent developments in the market?
N/A
9. What pricing options are available for accessing the report?
Pricing options include single-user, multi-user, and enterprise licenses priced at USD 3800, USD 4500, and USD 5800 respectively.
10. Is the market size provided in terms of value or volume?
The market size is provided in terms of value, measured in Million.
11. Are there any specific market keywords associated with the report?
Yes, the market keyword associated with the report is "Agriculture Variable Rate Technology Market," which aids in identifying and referencing the specific market segment covered.
12. How do I determine which pricing option suits my needs best?
The pricing options vary based on user requirements and access needs. Individual users may opt for single-user licenses, while businesses requiring broader access may choose multi-user or enterprise licenses for cost-effective access to the report.
13. Are there any additional resources or data provided in the Agriculture Variable Rate Technology Market report?
While the report offers comprehensive insights, it's advisable to review the specific contents or supplementary materials provided to ascertain if additional resources or data are available.
14. How can I stay updated on further developments or reports in the Agriculture Variable Rate Technology Market?
To stay informed about further developments, trends, and reports in the Agriculture Variable Rate Technology Market, consider subscribing to industry newsletters, following relevant companies and organizations, or regularly checking reputable industry news sources and publications.
Methodology
Step 1 - Identification of Relevant Samples Size from Population Database


Step 2 - Approaches for Defining Global Market Size (Value, Volume* & Price*)

Note*: In applicable scenarios
Step 3 - Data Sources
Primary Research
- Web Analytics
- Survey Reports
- Research Institute
- Latest Research Reports
- Opinion Leaders
Secondary Research
- Annual Reports
- White Paper
- Latest Press Release
- Industry Association
- Paid Database
- Investor Presentations

Step 4 - Data Triangulation
Involves using different sources of information in order to increase the validity of a study
These sources are likely to be stakeholders in a program - participants, other researchers, program staff, other community members, and so on.
Then we put all data in single framework & apply various statistical tools to find out the dynamic on the market.
During the analysis stage, feedback from the stakeholder groups would be compared to determine areas of agreement as well as areas of divergence