

Key Insights
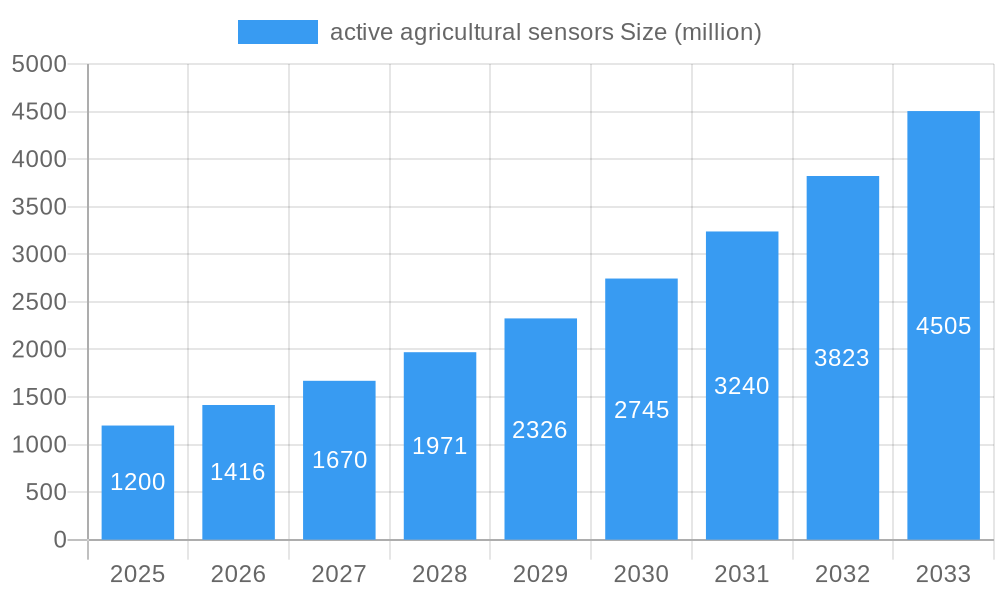
The global market for active agricultural sensors is experiencing robust growth, driven by an increasing demand for precision agriculture and sustainable farming practices. With a current market size estimated at $1.2 billion in 2025 and a projected Compound Annual Growth Rate (CAGR) of 18% through 2033, the market is poised for significant expansion. Key drivers fueling this growth include the necessity to optimize resource utilization, enhance crop yields, and mitigate the impacts of climate change. Farmers are increasingly adopting smart technologies to monitor soil conditions, manage water resources efficiently, and gain deeper insights into greenhouse environments. The integration of advanced sensor technologies allows for real-time data collection, enabling data-driven decision-making that leads to reduced waste, improved efficiency, and ultimately, higher profitability for agricultural operations.
active agricultural sensors Market Size (In Billion)
The market is segmented across various applications such as Soil Management, Climate Management, Water Management, and Smart Green Houses, each contributing to the overall market dynamism. Location sensors, humidity sensors, and electrochemical sensors are among the prominent types gaining traction due to their ability to provide critical environmental data. Leading companies like Texas Instruments, Honeywell, Bosch, and CropX are at the forefront of innovation, offering a diverse range of solutions that cater to the evolving needs of modern agriculture. Geographically, the Asia Pacific region, particularly China and India, is expected to witness substantial growth due to the increasing adoption of agricultural technology in these developing economies. North America and Europe continue to be dominant markets, driven by advanced agricultural infrastructure and a strong emphasis on sustainable farming. The market, while experiencing rapid growth, faces some restraints such as the initial cost of implementation and the need for widespread farmer education and training on utilizing these advanced technologies effectively.
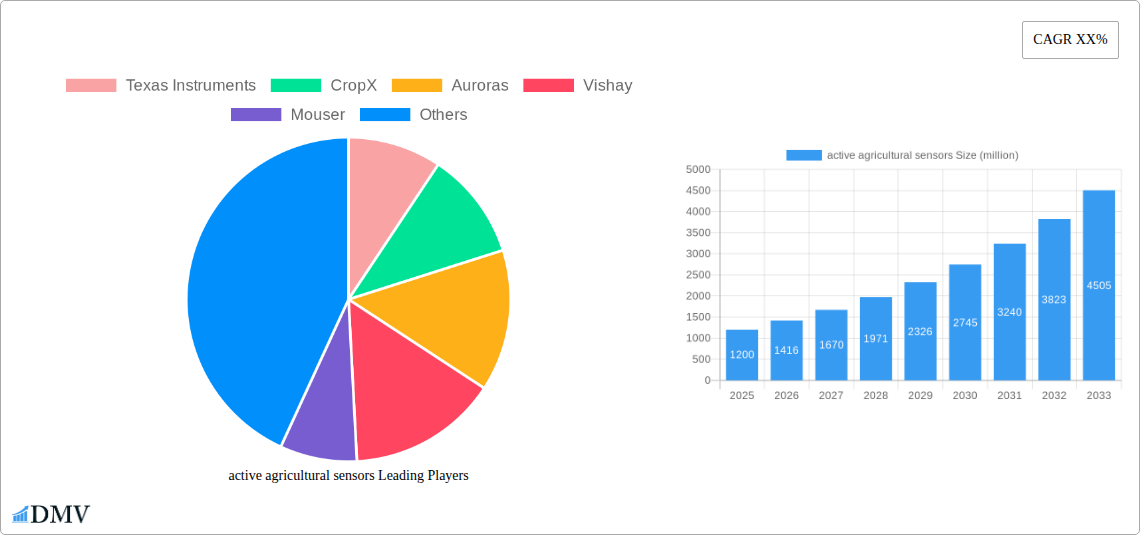
active agricultural sensors Company Market Share
Active Agricultural Sensors Market: Comprehensive Analysis and Future Outlook (2019-2033)
This in-depth report provides a definitive analysis of the global active agricultural sensors market, a rapidly expanding sector crucial for precision agriculture, sustainable farming, and enhanced crop yields. Leveraging advanced sensor technologies, farmers can now monitor critical environmental parameters with unprecedented accuracy, driving efficiency and profitability. This report delves into market composition, industry evolution, regional dominance, product innovations, growth drivers, market obstacles, and future opportunities, offering actionable insights for stakeholders. Our comprehensive study period spans from 2019 to 2033, with a base year of 2025, an estimated year also of 2025, and a forecast period from 2025 to 2033, building upon historical data from 2019 to 2024. We project the market to reach several million by the forecast period end.
active agricultural sensors Market Composition & Trends
The active agricultural sensors market exhibits a dynamic landscape characterized by moderate to high concentration, driven by significant investment in IoT and AI within agriculture. Key innovation catalysts include the demand for data-driven farming, the need to optimize resource allocation (water, fertilizer), and the growing imperative for climate change adaptation. Regulatory landscapes are evolving to support the adoption of smart farming technologies, encouraging market growth. Substitute products, such as manual monitoring or less sophisticated sensor systems, are gradually being displaced by advanced active agricultural sensors. End-user profiles are diverse, encompassing large-scale commercial farms, smallholder farmers, agricultural research institutions, and government agricultural bodies. Mergers and acquisitions (M&A) are prevalent, with deal values estimated in the tens of million, indicating strategic consolidation and a drive for market share.
- Market Share Distribution: Major players like Texas Instruments and CropX hold significant market positions, with emerging companies such as Auroras and Vishay gaining traction.
- M&A Deal Values: Anticipated M&A activities in the forecast period are projected to reach hundreds of million, signaling intense competition and strategic partnerships.
- Innovation Catalysts:
- Advancements in IoT connectivity and AI-powered analytics.
- Increasing global demand for food security.
- Supportive government initiatives promoting sustainable agriculture.
- End-User Focus:
- Efficiency optimization for large-scale operations.
- Improved resource management for smaller farms.
- Data acquisition for research and development.
active agricultural sensors Industry Evolution
The evolution of the active agricultural sensors market is a testament to technological innovation and the increasing sophistication of agricultural practices. Over the historical period (2019-2024), the market has witnessed a significant upward trajectory, driven by the growing adoption of precision agriculture techniques. Early adoption was primarily concentrated among large-scale commercial farms seeking to optimize inputs and improve yields. However, the declining cost of sensor technology, coupled with the proliferation of affordable IoT platforms, has democratized access to these advanced tools. Technological advancements have been rapid, moving from basic environmental monitoring to integrated systems that provide real-time, actionable insights. Humidity sensors and location sensors were among the early popular types, with a gradual shift towards more complex electrochemical sensors and airflow sensors for detailed soil and climate analysis.
The forecast period (2025-2033) is poised for accelerated growth, fueled by the integration of artificial intelligence (AI) and machine learning (ML) for predictive analytics. This will enable farmers to anticipate pest outbreaks, optimize irrigation schedules with greater precision, and even predict crop yields with higher accuracy. Consumer demand for sustainably produced food, coupled with increasing environmental regulations, will further propel the adoption of active agricultural sensors. The market is expected to expand beyond traditional crop farming to include indoor farming (Smart Green House applications) and specialized applications like vineyard management and livestock monitoring. We project a compound annual growth rate (CAGR) of xx% for the forecast period, reaching a market size of over xx million by 2033. Adoption metrics are expected to rise from approximately xx% of commercial farms in 2025 to over xx% by 2033.
Leading Regions, Countries, or Segments in active agricultural sensors
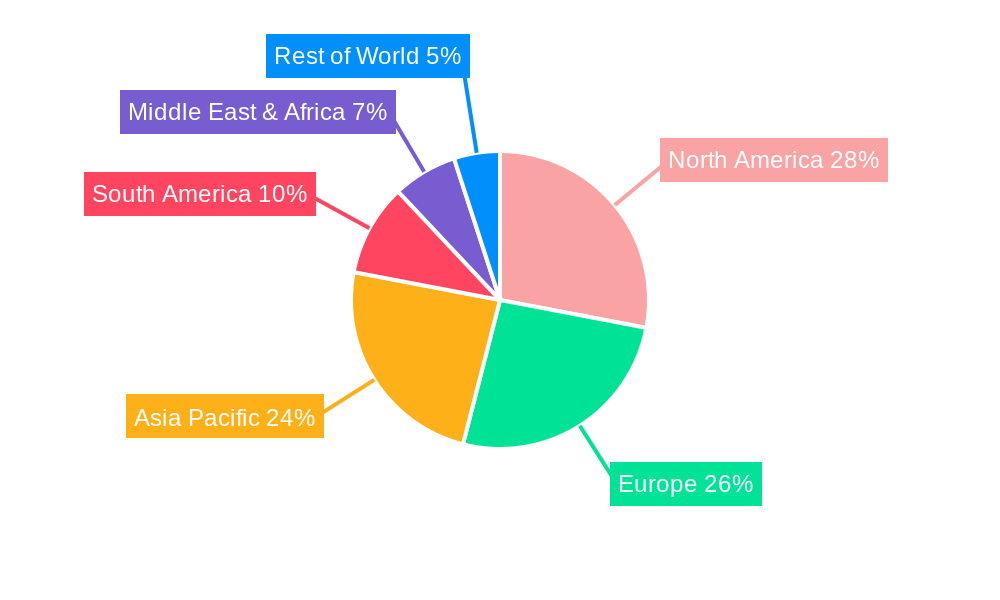
The active agricultural sensors market is experiencing significant growth across various regions, with North America and Europe currently leading in adoption and innovation. This dominance is attributed to well-established agricultural infrastructures, strong government support for technological advancements, and a high prevalence of large-scale commercial farming operations. In North America, countries like the United States are at the forefront, driven by a strong emphasis on precision agriculture and substantial investments in agritech. Europe follows closely, with countries such as Germany, the Netherlands, and France actively promoting sustainable farming practices and smart agriculture solutions.
Within the Applications segment, Soil Management and Water Management are currently the most prominent, accounting for a substantial market share due to their direct impact on crop health and yield optimization. However, the Smart Green House segment is rapidly emerging as a significant growth area, driven by the increasing trend of vertical farming and controlled environment agriculture. In terms of Types, Humidity Sensors and Location Sensors have seen widespread adoption, but the market is witnessing a strong surge in demand for more advanced Electrochemical Sensors for detailed soil nutrient analysis and Airflow Sensors for optimized climate control in greenhouses. The Asia-Pacific region, particularly China and India, is expected to be a high-growth market in the coming years, fueled by the increasing need to enhance agricultural productivity to feed growing populations and supportive government policies aimed at modernizing the agricultural sector.
- Dominant Region (North America):
- Key Drivers: High investment in R&D, presence of major agritech companies, and strong farmer adoption rates.
- Country Focus: United States leading with widespread implementation in large-scale operations.
- Leading Application (Soil Management):
- Impact: Direct influence on nutrient uptake, irrigation needs, and disease prevention.
- Growth Factors: Demand for data-driven soil health analysis and reduced fertilizer wastage.
- Emerging Application (Smart Green House):
- Trend: Growth in controlled environment agriculture and vertical farming.
- Sensor Integration: Humidity, temperature, and CO2 sensors are critical for optimal growth conditions.
- Dominant Type (Humidity Sensors):
- Functionality: Crucial for preventing crop diseases and optimizing irrigation.
- Market Penetration: High adoption across diverse farming scales.
- High-Growth Region (Asia-Pacific):
- Catalysts: Increasing food demand, government initiatives for agricultural modernization, and a large base of smallholder farmers adopting technology.
active agricultural sensors Product Innovations
Recent product innovations in active agricultural sensors are revolutionizing farm management. Companies are integrating miniaturized and highly durable sensors capable of withstanding harsh environmental conditions. Innovations include multi-parameter sensors that simultaneously measure soil moisture, temperature, pH, and electrical conductivity, providing a holistic view of soil health. Advanced electrochemical sensors are offering unprecedented accuracy in detecting specific nutrient deficiencies. Furthermore, the development of low-power, long-range wireless communication modules is enabling widespread deployment of sensor networks for real-time data transmission. AI-powered analytics platforms are now complementing sensor data, offering predictive insights on crop health, disease outbreaks, and optimal harvest times. These advancements lead to significant improvements in water and fertilizer efficiency, reduced crop loss, and ultimately, higher yields.
Propelling Factors for active agricultural sensors Growth
The growth of the active agricultural sensors market is propelled by a confluence of technological, economic, and regulatory factors. The continuous advancements in sensor technology, including miniaturization, increased accuracy, and reduced power consumption, make them more accessible and effective for a wider range of agricultural applications. Economically, the increasing need for optimizing resource utilization to reduce operational costs and maximize profitability is a significant driver. Governments worldwide are actively promoting smart agriculture through subsidies, grants, and favorable policies aimed at enhancing food security and promoting sustainable farming practices. The growing consumer demand for sustainably produced food also incentivizes farmers to adopt technologies that minimize environmental impact.
Obstacles in the active agricultural sensors Market
Despite robust growth, the active agricultural sensors market faces several obstacles. High initial investment costs can be a barrier for smallholder farmers, particularly in developing regions. The complexity of integrating and managing sensor data can also be a challenge for less tech-savvy farmers, necessitating robust training and support. Regulatory hurdles, though diminishing, can still exist regarding data privacy and standardization of sensor outputs. Furthermore, intermittent supply chain disruptions for key components can impact production and availability. Competitive pressures from established players and new entrants can also lead to price wars, impacting profit margins.
Future Opportunities in active agricultural sensors
The future for active agricultural sensors is exceptionally bright, with numerous emerging opportunities. The expansion of IoT and 5G networks will enable seamless connectivity, facilitating real-time data exchange and remote monitoring on an unprecedented scale. The integration of AI and machine learning will unlock advanced predictive analytics, moving beyond reactive farming to proactive and prescriptive approaches. The growing demand for traceability in the food supply chain presents an opportunity for sensors to play a vital role in monitoring crop conditions from farm to table. Furthermore, the increasing focus on climate-resilient agriculture and the mitigation of environmental impact will drive the adoption of sensors for precision resource management and carbon footprint monitoring.
Major Players in the active agricultural sensors Ecosystem
- Texas Instruments
- CropX
- Auroras
- Vishay
- Mouser
- Honeywell
- Caipos GmbH
- Bosch
- CropIn Technology Solutions
- Avidor High Tech
- Sensaphone
- Dol-Sensors
- Glana Sensors
- Libelium Comunicaciones Distribuidas
- Monnit Corporation
- Pycno agriculture
- Sensoterra
- Sentera
Key Developments in active agricultural sensors Industry
- 2019: Launch of advanced multi-parameter soil sensors offering real-time nutrient and moisture analysis.
- 2020: Increased integration of AI algorithms for predictive pest and disease detection.
- 2021: Expansion of IoT connectivity options, including LoRaWAN and NB-IoT, for wider coverage.
- 2022: Significant mergers and acquisitions aimed at consolidating market share and expanding product portfolios.
- 2023: Enhanced focus on sustainable sensor materials and energy-efficient designs.
- 2024: Introduction of subscription-based sensor services and data analytics platforms.
- 2025: Anticipated launch of next-generation electrochemical sensors with improved specificity and longevity.
- 2026: Expected widespread adoption of sensor networks in smart greenhouse and vertical farming applications.
- 2027: Development of AI-powered yield prediction models integrating diverse sensor data.
- 2028: Increased regulatory focus on data security and interoperability of agricultural sensor systems.
- 2029: Emergence of fully autonomous farming systems leveraging advanced sensor feedback.
- 2030: Growing demand for sensors in climate change adaptation strategies for agriculture.
- 2031: Further miniaturization and cost reduction of sensor technology, enabling wider accessibility.
- 2032: Integration of blockchain technology for enhanced traceability and data integrity from sensor networks.
- 2033: Maturation of the market with widespread adoption across all agricultural segments.
Strategic active agricultural sensors Market Forecast
The strategic forecast for the active agricultural sensors market is exceptionally robust, driven by the undeniable need for efficient, sustainable, and data-driven agriculture. Future growth catalysts include the continuous evolution of IoT and AI technologies, which will unlock more sophisticated predictive analytics and autonomous farming solutions. The increasing global emphasis on food security, coupled with climate change mitigation efforts, will further bolster the demand for precision resource management enabled by these sensors. Emerging markets represent significant untapped potential. The integration of these sensors into broader agri-ecosystems, providing end-to-end solutions for farmers, will define the market's trajectory, promising substantial expansion and innovation over the forecast period.
active agricultural sensors Segmentation
-
1. Application
- 1.1. Soil Management
- 1.2. Climate Management
- 1.3. Water Management
- 1.4. Smart Green House
- 1.5. Others
-
2. Types
- 2.1. Location Sensors
- 2.2. Humidity Sensors
- 2.3. Electrochemical Sensors
- 2.4. Mechanical Sensors
- 2.5. Airflow Sensors
- 2.6. Others
active agricultural sensors Segmentation By Geography
-
1. North America
- 1.1. United States
- 1.2. Canada
- 1.3. Mexico
-
2. South America
- 2.1. Brazil
- 2.2. Argentina
- 2.3. Rest of South America
-
3. Europe
- 3.1. United Kingdom
- 3.2. Germany
- 3.3. France
- 3.4. Italy
- 3.5. Spain
- 3.6. Russia
- 3.7. Benelux
- 3.8. Nordics
- 3.9. Rest of Europe
-
4. Middle East & Africa
- 4.1. Turkey
- 4.2. Israel
- 4.3. GCC
- 4.4. North Africa
- 4.5. South Africa
- 4.6. Rest of Middle East & Africa
-
5. Asia Pacific
- 5.1. China
- 5.2. India
- 5.3. Japan
- 5.4. South Korea
- 5.5. ASEAN
- 5.6. Oceania
- 5.7. Rest of Asia Pacific
active agricultural sensors Regional Market Share
Geographic Coverage of active agricultural sensors
active agricultural sensors REPORT HIGHLIGHTS
| Aspects | Details |
|---|---|
| Study Period | 2020-2034 |
| Base Year | 2025 |
| Estimated Year | 2026 |
| Forecast Period | 2026-2034 |
| Historical Period | 2020-2025 |
| Growth Rate | CAGR of 5.6% from 2020-2034 |
| Segmentation |
|
Table of Contents
- 1. Introduction
- 1.1. Research Scope
- 1.2. Market Segmentation
- 1.3. Research Objective
- 1.4. Definitions and Assumptions
- 2. Executive Summary
- 2.1. Market Snapshot
- 3. Market Dynamics
- 3.1. Market Drivers
- 3.2. Market Restrains
- 3.3. Market Trends
- 3.4. Market Opportunities
- 4. Market Factor Analysis
- 4.1. Porters Five Forces
- 4.1.1. Bargaining Power of Suppliers
- 4.1.2. Bargaining Power of Buyers
- 4.1.3. Threat of New Entrants
- 4.1.4. Threat of Substitutes
- 4.1.5. Competitive Rivalry
- 4.2. PESTEL analysis
- 4.3. BCG Analysis
- 4.3.1. Stars (High Growth, High Market Share)
- 4.3.2. Cash Cows (Low Growth, High Market Share)
- 4.3.3. Question Mark (High Growth, Low Market Share)
- 4.3.4. Dogs (Low Growth, Low Market Share)
- 4.4. Ansoff Matrix Analysis
- 4.5. Supply Chain Analysis
- 4.6. Regulatory Landscape
- 4.7. Current Market Potential and Opportunity Assessment (TAM–SAM–SOM Framework)
- 4.8. DMV Analyst Note
- 4.1. Porters Five Forces
- 5. Market Analysis, Insights and Forecast 2021-2033
- 5.1. Market Analysis, Insights and Forecast - by Application
- 5.1.1. Soil Management
- 5.1.2. Climate Management
- 5.1.3. Water Management
- 5.1.4. Smart Green House
- 5.1.5. Others
- 5.2. Market Analysis, Insights and Forecast - by Types
- 5.2.1. Location Sensors
- 5.2.2. Humidity Sensors
- 5.2.3. Electrochemical Sensors
- 5.2.4. Mechanical Sensors
- 5.2.5. Airflow Sensors
- 5.2.6. Others
- 5.3. Market Analysis, Insights and Forecast - by Region
- 5.3.1. North America
- 5.3.2. South America
- 5.3.3. Europe
- 5.3.4. Middle East & Africa
- 5.3.5. Asia Pacific
- 5.1. Market Analysis, Insights and Forecast - by Application
- 6. Global active agricultural sensors Analysis, Insights and Forecast, 2021-2033
- 6.1. Market Analysis, Insights and Forecast - by Application
- 6.1.1. Soil Management
- 6.1.2. Climate Management
- 6.1.3. Water Management
- 6.1.4. Smart Green House
- 6.1.5. Others
- 6.2. Market Analysis, Insights and Forecast - by Types
- 6.2.1. Location Sensors
- 6.2.2. Humidity Sensors
- 6.2.3. Electrochemical Sensors
- 6.2.4. Mechanical Sensors
- 6.2.5. Airflow Sensors
- 6.2.6. Others
- 6.1. Market Analysis, Insights and Forecast - by Application
- 7. North America active agricultural sensors Analysis, Insights and Forecast, 2020-2032
- 7.1. Market Analysis, Insights and Forecast - by Application
- 7.1.1. Soil Management
- 7.1.2. Climate Management
- 7.1.3. Water Management
- 7.1.4. Smart Green House
- 7.1.5. Others
- 7.2. Market Analysis, Insights and Forecast - by Types
- 7.2.1. Location Sensors
- 7.2.2. Humidity Sensors
- 7.2.3. Electrochemical Sensors
- 7.2.4. Mechanical Sensors
- 7.2.5. Airflow Sensors
- 7.2.6. Others
- 7.1. Market Analysis, Insights and Forecast - by Application
- 8. South America active agricultural sensors Analysis, Insights and Forecast, 2020-2032
- 8.1. Market Analysis, Insights and Forecast - by Application
- 8.1.1. Soil Management
- 8.1.2. Climate Management
- 8.1.3. Water Management
- 8.1.4. Smart Green House
- 8.1.5. Others
- 8.2. Market Analysis, Insights and Forecast - by Types
- 8.2.1. Location Sensors
- 8.2.2. Humidity Sensors
- 8.2.3. Electrochemical Sensors
- 8.2.4. Mechanical Sensors
- 8.2.5. Airflow Sensors
- 8.2.6. Others
- 8.1. Market Analysis, Insights and Forecast - by Application
- 9. Europe active agricultural sensors Analysis, Insights and Forecast, 2020-2032
- 9.1. Market Analysis, Insights and Forecast - by Application
- 9.1.1. Soil Management
- 9.1.2. Climate Management
- 9.1.3. Water Management
- 9.1.4. Smart Green House
- 9.1.5. Others
- 9.2. Market Analysis, Insights and Forecast - by Types
- 9.2.1. Location Sensors
- 9.2.2. Humidity Sensors
- 9.2.3. Electrochemical Sensors
- 9.2.4. Mechanical Sensors
- 9.2.5. Airflow Sensors
- 9.2.6. Others
- 9.1. Market Analysis, Insights and Forecast - by Application
- 10. Middle East & Africa active agricultural sensors Analysis, Insights and Forecast, 2020-2032
- 10.1. Market Analysis, Insights and Forecast - by Application
- 10.1.1. Soil Management
- 10.1.2. Climate Management
- 10.1.3. Water Management
- 10.1.4. Smart Green House
- 10.1.5. Others
- 10.2. Market Analysis, Insights and Forecast - by Types
- 10.2.1. Location Sensors
- 10.2.2. Humidity Sensors
- 10.2.3. Electrochemical Sensors
- 10.2.4. Mechanical Sensors
- 10.2.5. Airflow Sensors
- 10.2.6. Others
- 10.1. Market Analysis, Insights and Forecast - by Application
- 11. Asia Pacific active agricultural sensors Analysis, Insights and Forecast, 2020-2032
- 11.1. Market Analysis, Insights and Forecast - by Application
- 11.1.1. Soil Management
- 11.1.2. Climate Management
- 11.1.3. Water Management
- 11.1.4. Smart Green House
- 11.1.5. Others
- 11.2. Market Analysis, Insights and Forecast - by Types
- 11.2.1. Location Sensors
- 11.2.2. Humidity Sensors
- 11.2.3. Electrochemical Sensors
- 11.2.4. Mechanical Sensors
- 11.2.5. Airflow Sensors
- 11.2.6. Others
- 11.1. Market Analysis, Insights and Forecast - by Application
- 12. Competitive Analysis
- 12.1. Company Profiles
- 12.1.1 Texas Instruments
- 12.1.1.1. Company Overview
- 12.1.1.2. Products
- 12.1.1.3. Company Financials
- 12.1.1.4. SWOT Analysis
- 12.1.2 CropX
- 12.1.2.1. Company Overview
- 12.1.2.2. Products
- 12.1.2.3. Company Financials
- 12.1.2.4. SWOT Analysis
- 12.1.3 Auroras
- 12.1.3.1. Company Overview
- 12.1.3.2. Products
- 12.1.3.3. Company Financials
- 12.1.3.4. SWOT Analysis
- 12.1.4 Vishay
- 12.1.4.1. Company Overview
- 12.1.4.2. Products
- 12.1.4.3. Company Financials
- 12.1.4.4. SWOT Analysis
- 12.1.5 Mouser
- 12.1.5.1. Company Overview
- 12.1.5.2. Products
- 12.1.5.3. Company Financials
- 12.1.5.4. SWOT Analysis
- 12.1.6 Honeywell
- 12.1.6.1. Company Overview
- 12.1.6.2. Products
- 12.1.6.3. Company Financials
- 12.1.6.4. SWOT Analysis
- 12.1.7 Caipos GmbH
- 12.1.7.1. Company Overview
- 12.1.7.2. Products
- 12.1.7.3. Company Financials
- 12.1.7.4. SWOT Analysis
- 12.1.8 Bosch
- 12.1.8.1. Company Overview
- 12.1.8.2. Products
- 12.1.8.3. Company Financials
- 12.1.8.4. SWOT Analysis
- 12.1.9 CropIn Technology Solutions
- 12.1.9.1. Company Overview
- 12.1.9.2. Products
- 12.1.9.3. Company Financials
- 12.1.9.4. SWOT Analysis
- 12.1.10 Avidor High Tech
- 12.1.10.1. Company Overview
- 12.1.10.2. Products
- 12.1.10.3. Company Financials
- 12.1.10.4. SWOT Analysis
- 12.1.11 Sensaphone
- 12.1.11.1. Company Overview
- 12.1.11.2. Products
- 12.1.11.3. Company Financials
- 12.1.11.4. SWOT Analysis
- 12.1.12 Dol-Sensors
- 12.1.12.1. Company Overview
- 12.1.12.2. Products
- 12.1.12.3. Company Financials
- 12.1.12.4. SWOT Analysis
- 12.1.13 Glana Sensors
- 12.1.13.1. Company Overview
- 12.1.13.2. Products
- 12.1.13.3. Company Financials
- 12.1.13.4. SWOT Analysis
- 12.1.14 Libelium Comunicaciones Distribuidas
- 12.1.14.1. Company Overview
- 12.1.14.2. Products
- 12.1.14.3. Company Financials
- 12.1.14.4. SWOT Analysis
- 12.1.15 Monnit Corporation
- 12.1.15.1. Company Overview
- 12.1.15.2. Products
- 12.1.15.3. Company Financials
- 12.1.15.4. SWOT Analysis
- 12.1.16 Pycno agriculture
- 12.1.16.1. Company Overview
- 12.1.16.2. Products
- 12.1.16.3. Company Financials
- 12.1.16.4. SWOT Analysis
- 12.1.17 Sensoterra
- 12.1.17.1. Company Overview
- 12.1.17.2. Products
- 12.1.17.3. Company Financials
- 12.1.17.4. SWOT Analysis
- 12.1.18 Sentera
- 12.1.18.1. Company Overview
- 12.1.18.2. Products
- 12.1.18.3. Company Financials
- 12.1.18.4. SWOT Analysis
- 12.1.1 Texas Instruments
- 12.2. Market Entropy
- 12.2.1 Company's Key Areas Served
- 12.2.2 Recent Developments
- 12.3. Company Market Share Analysis 2025
- 12.3.1 Top 5 Companies Market Share Analysis
- 12.3.2 Top 3 Companies Market Share Analysis
- 12.4. List of Potential Customers
- 13. Research Methodology
List of Figures
- Figure 1: Global active agricultural sensors Revenue Breakdown (undefined, %) by Region 2025 & 2033
- Figure 2: Global active agricultural sensors Volume Breakdown (K, %) by Region 2025 & 2033
- Figure 3: North America active agricultural sensors Revenue (undefined), by Application 2025 & 2033
- Figure 4: North America active agricultural sensors Volume (K), by Application 2025 & 2033
- Figure 5: North America active agricultural sensors Revenue Share (%), by Application 2025 & 2033
- Figure 6: North America active agricultural sensors Volume Share (%), by Application 2025 & 2033
- Figure 7: North America active agricultural sensors Revenue (undefined), by Types 2025 & 2033
- Figure 8: North America active agricultural sensors Volume (K), by Types 2025 & 2033
- Figure 9: North America active agricultural sensors Revenue Share (%), by Types 2025 & 2033
- Figure 10: North America active agricultural sensors Volume Share (%), by Types 2025 & 2033
- Figure 11: North America active agricultural sensors Revenue (undefined), by Country 2025 & 2033
- Figure 12: North America active agricultural sensors Volume (K), by Country 2025 & 2033
- Figure 13: North America active agricultural sensors Revenue Share (%), by Country 2025 & 2033
- Figure 14: North America active agricultural sensors Volume Share (%), by Country 2025 & 2033
- Figure 15: South America active agricultural sensors Revenue (undefined), by Application 2025 & 2033
- Figure 16: South America active agricultural sensors Volume (K), by Application 2025 & 2033
- Figure 17: South America active agricultural sensors Revenue Share (%), by Application 2025 & 2033
- Figure 18: South America active agricultural sensors Volume Share (%), by Application 2025 & 2033
- Figure 19: South America active agricultural sensors Revenue (undefined), by Types 2025 & 2033
- Figure 20: South America active agricultural sensors Volume (K), by Types 2025 & 2033
- Figure 21: South America active agricultural sensors Revenue Share (%), by Types 2025 & 2033
- Figure 22: South America active agricultural sensors Volume Share (%), by Types 2025 & 2033
- Figure 23: South America active agricultural sensors Revenue (undefined), by Country 2025 & 2033
- Figure 24: South America active agricultural sensors Volume (K), by Country 2025 & 2033
- Figure 25: South America active agricultural sensors Revenue Share (%), by Country 2025 & 2033
- Figure 26: South America active agricultural sensors Volume Share (%), by Country 2025 & 2033
- Figure 27: Europe active agricultural sensors Revenue (undefined), by Application 2025 & 2033
- Figure 28: Europe active agricultural sensors Volume (K), by Application 2025 & 2033
- Figure 29: Europe active agricultural sensors Revenue Share (%), by Application 2025 & 2033
- Figure 30: Europe active agricultural sensors Volume Share (%), by Application 2025 & 2033
- Figure 31: Europe active agricultural sensors Revenue (undefined), by Types 2025 & 2033
- Figure 32: Europe active agricultural sensors Volume (K), by Types 2025 & 2033
- Figure 33: Europe active agricultural sensors Revenue Share (%), by Types 2025 & 2033
- Figure 34: Europe active agricultural sensors Volume Share (%), by Types 2025 & 2033
- Figure 35: Europe active agricultural sensors Revenue (undefined), by Country 2025 & 2033
- Figure 36: Europe active agricultural sensors Volume (K), by Country 2025 & 2033
- Figure 37: Europe active agricultural sensors Revenue Share (%), by Country 2025 & 2033
- Figure 38: Europe active agricultural sensors Volume Share (%), by Country 2025 & 2033
- Figure 39: Middle East & Africa active agricultural sensors Revenue (undefined), by Application 2025 & 2033
- Figure 40: Middle East & Africa active agricultural sensors Volume (K), by Application 2025 & 2033
- Figure 41: Middle East & Africa active agricultural sensors Revenue Share (%), by Application 2025 & 2033
- Figure 42: Middle East & Africa active agricultural sensors Volume Share (%), by Application 2025 & 2033
- Figure 43: Middle East & Africa active agricultural sensors Revenue (undefined), by Types 2025 & 2033
- Figure 44: Middle East & Africa active agricultural sensors Volume (K), by Types 2025 & 2033
- Figure 45: Middle East & Africa active agricultural sensors Revenue Share (%), by Types 2025 & 2033
- Figure 46: Middle East & Africa active agricultural sensors Volume Share (%), by Types 2025 & 2033
- Figure 47: Middle East & Africa active agricultural sensors Revenue (undefined), by Country 2025 & 2033
- Figure 48: Middle East & Africa active agricultural sensors Volume (K), by Country 2025 & 2033
- Figure 49: Middle East & Africa active agricultural sensors Revenue Share (%), by Country 2025 & 2033
- Figure 50: Middle East & Africa active agricultural sensors Volume Share (%), by Country 2025 & 2033
- Figure 51: Asia Pacific active agricultural sensors Revenue (undefined), by Application 2025 & 2033
- Figure 52: Asia Pacific active agricultural sensors Volume (K), by Application 2025 & 2033
- Figure 53: Asia Pacific active agricultural sensors Revenue Share (%), by Application 2025 & 2033
- Figure 54: Asia Pacific active agricultural sensors Volume Share (%), by Application 2025 & 2033
- Figure 55: Asia Pacific active agricultural sensors Revenue (undefined), by Types 2025 & 2033
- Figure 56: Asia Pacific active agricultural sensors Volume (K), by Types 2025 & 2033
- Figure 57: Asia Pacific active agricultural sensors Revenue Share (%), by Types 2025 & 2033
- Figure 58: Asia Pacific active agricultural sensors Volume Share (%), by Types 2025 & 2033
- Figure 59: Asia Pacific active agricultural sensors Revenue (undefined), by Country 2025 & 2033
- Figure 60: Asia Pacific active agricultural sensors Volume (K), by Country 2025 & 2033
- Figure 61: Asia Pacific active agricultural sensors Revenue Share (%), by Country 2025 & 2033
- Figure 62: Asia Pacific active agricultural sensors Volume Share (%), by Country 2025 & 2033
List of Tables
- Table 1: Global active agricultural sensors Revenue undefined Forecast, by Application 2020 & 2033
- Table 2: Global active agricultural sensors Volume K Forecast, by Application 2020 & 2033
- Table 3: Global active agricultural sensors Revenue undefined Forecast, by Types 2020 & 2033
- Table 4: Global active agricultural sensors Volume K Forecast, by Types 2020 & 2033
- Table 5: Global active agricultural sensors Revenue undefined Forecast, by Region 2020 & 2033
- Table 6: Global active agricultural sensors Volume K Forecast, by Region 2020 & 2033
- Table 7: Global active agricultural sensors Revenue undefined Forecast, by Application 2020 & 2033
- Table 8: Global active agricultural sensors Volume K Forecast, by Application 2020 & 2033
- Table 9: Global active agricultural sensors Revenue undefined Forecast, by Types 2020 & 2033
- Table 10: Global active agricultural sensors Volume K Forecast, by Types 2020 & 2033
- Table 11: Global active agricultural sensors Revenue undefined Forecast, by Country 2020 & 2033
- Table 12: Global active agricultural sensors Volume K Forecast, by Country 2020 & 2033
- Table 13: United States active agricultural sensors Revenue (undefined) Forecast, by Application 2020 & 2033
- Table 14: United States active agricultural sensors Volume (K) Forecast, by Application 2020 & 2033
- Table 15: Canada active agricultural sensors Revenue (undefined) Forecast, by Application 2020 & 2033
- Table 16: Canada active agricultural sensors Volume (K) Forecast, by Application 2020 & 2033
- Table 17: Mexico active agricultural sensors Revenue (undefined) Forecast, by Application 2020 & 2033
- Table 18: Mexico active agricultural sensors Volume (K) Forecast, by Application 2020 & 2033
- Table 19: Global active agricultural sensors Revenue undefined Forecast, by Application 2020 & 2033
- Table 20: Global active agricultural sensors Volume K Forecast, by Application 2020 & 2033
- Table 21: Global active agricultural sensors Revenue undefined Forecast, by Types 2020 & 2033
- Table 22: Global active agricultural sensors Volume K Forecast, by Types 2020 & 2033
- Table 23: Global active agricultural sensors Revenue undefined Forecast, by Country 2020 & 2033
- Table 24: Global active agricultural sensors Volume K Forecast, by Country 2020 & 2033
- Table 25: Brazil active agricultural sensors Revenue (undefined) Forecast, by Application 2020 & 2033
- Table 26: Brazil active agricultural sensors Volume (K) Forecast, by Application 2020 & 2033
- Table 27: Argentina active agricultural sensors Revenue (undefined) Forecast, by Application 2020 & 2033
- Table 28: Argentina active agricultural sensors Volume (K) Forecast, by Application 2020 & 2033
- Table 29: Rest of South America active agricultural sensors Revenue (undefined) Forecast, by Application 2020 & 2033
- Table 30: Rest of South America active agricultural sensors Volume (K) Forecast, by Application 2020 & 2033
- Table 31: Global active agricultural sensors Revenue undefined Forecast, by Application 2020 & 2033
- Table 32: Global active agricultural sensors Volume K Forecast, by Application 2020 & 2033
- Table 33: Global active agricultural sensors Revenue undefined Forecast, by Types 2020 & 2033
- Table 34: Global active agricultural sensors Volume K Forecast, by Types 2020 & 2033
- Table 35: Global active agricultural sensors Revenue undefined Forecast, by Country 2020 & 2033
- Table 36: Global active agricultural sensors Volume K Forecast, by Country 2020 & 2033
- Table 37: United Kingdom active agricultural sensors Revenue (undefined) Forecast, by Application 2020 & 2033
- Table 38: United Kingdom active agricultural sensors Volume (K) Forecast, by Application 2020 & 2033
- Table 39: Germany active agricultural sensors Revenue (undefined) Forecast, by Application 2020 & 2033
- Table 40: Germany active agricultural sensors Volume (K) Forecast, by Application 2020 & 2033
- Table 41: France active agricultural sensors Revenue (undefined) Forecast, by Application 2020 & 2033
- Table 42: France active agricultural sensors Volume (K) Forecast, by Application 2020 & 2033
- Table 43: Italy active agricultural sensors Revenue (undefined) Forecast, by Application 2020 & 2033
- Table 44: Italy active agricultural sensors Volume (K) Forecast, by Application 2020 & 2033
- Table 45: Spain active agricultural sensors Revenue (undefined) Forecast, by Application 2020 & 2033
- Table 46: Spain active agricultural sensors Volume (K) Forecast, by Application 2020 & 2033
- Table 47: Russia active agricultural sensors Revenue (undefined) Forecast, by Application 2020 & 2033
- Table 48: Russia active agricultural sensors Volume (K) Forecast, by Application 2020 & 2033
- Table 49: Benelux active agricultural sensors Revenue (undefined) Forecast, by Application 2020 & 2033
- Table 50: Benelux active agricultural sensors Volume (K) Forecast, by Application 2020 & 2033
- Table 51: Nordics active agricultural sensors Revenue (undefined) Forecast, by Application 2020 & 2033
- Table 52: Nordics active agricultural sensors Volume (K) Forecast, by Application 2020 & 2033
- Table 53: Rest of Europe active agricultural sensors Revenue (undefined) Forecast, by Application 2020 & 2033
- Table 54: Rest of Europe active agricultural sensors Volume (K) Forecast, by Application 2020 & 2033
- Table 55: Global active agricultural sensors Revenue undefined Forecast, by Application 2020 & 2033
- Table 56: Global active agricultural sensors Volume K Forecast, by Application 2020 & 2033
- Table 57: Global active agricultural sensors Revenue undefined Forecast, by Types 2020 & 2033
- Table 58: Global active agricultural sensors Volume K Forecast, by Types 2020 & 2033
- Table 59: Global active agricultural sensors Revenue undefined Forecast, by Country 2020 & 2033
- Table 60: Global active agricultural sensors Volume K Forecast, by Country 2020 & 2033
- Table 61: Turkey active agricultural sensors Revenue (undefined) Forecast, by Application 2020 & 2033
- Table 62: Turkey active agricultural sensors Volume (K) Forecast, by Application 2020 & 2033
- Table 63: Israel active agricultural sensors Revenue (undefined) Forecast, by Application 2020 & 2033
- Table 64: Israel active agricultural sensors Volume (K) Forecast, by Application 2020 & 2033
- Table 65: GCC active agricultural sensors Revenue (undefined) Forecast, by Application 2020 & 2033
- Table 66: GCC active agricultural sensors Volume (K) Forecast, by Application 2020 & 2033
- Table 67: North Africa active agricultural sensors Revenue (undefined) Forecast, by Application 2020 & 2033
- Table 68: North Africa active agricultural sensors Volume (K) Forecast, by Application 2020 & 2033
- Table 69: South Africa active agricultural sensors Revenue (undefined) Forecast, by Application 2020 & 2033
- Table 70: South Africa active agricultural sensors Volume (K) Forecast, by Application 2020 & 2033
- Table 71: Rest of Middle East & Africa active agricultural sensors Revenue (undefined) Forecast, by Application 2020 & 2033
- Table 72: Rest of Middle East & Africa active agricultural sensors Volume (K) Forecast, by Application 2020 & 2033
- Table 73: Global active agricultural sensors Revenue undefined Forecast, by Application 2020 & 2033
- Table 74: Global active agricultural sensors Volume K Forecast, by Application 2020 & 2033
- Table 75: Global active agricultural sensors Revenue undefined Forecast, by Types 2020 & 2033
- Table 76: Global active agricultural sensors Volume K Forecast, by Types 2020 & 2033
- Table 77: Global active agricultural sensors Revenue undefined Forecast, by Country 2020 & 2033
- Table 78: Global active agricultural sensors Volume K Forecast, by Country 2020 & 2033
- Table 79: China active agricultural sensors Revenue (undefined) Forecast, by Application 2020 & 2033
- Table 80: China active agricultural sensors Volume (K) Forecast, by Application 2020 & 2033
- Table 81: India active agricultural sensors Revenue (undefined) Forecast, by Application 2020 & 2033
- Table 82: India active agricultural sensors Volume (K) Forecast, by Application 2020 & 2033
- Table 83: Japan active agricultural sensors Revenue (undefined) Forecast, by Application 2020 & 2033
- Table 84: Japan active agricultural sensors Volume (K) Forecast, by Application 2020 & 2033
- Table 85: South Korea active agricultural sensors Revenue (undefined) Forecast, by Application 2020 & 2033
- Table 86: South Korea active agricultural sensors Volume (K) Forecast, by Application 2020 & 2033
- Table 87: ASEAN active agricultural sensors Revenue (undefined) Forecast, by Application 2020 & 2033
- Table 88: ASEAN active agricultural sensors Volume (K) Forecast, by Application 2020 & 2033
- Table 89: Oceania active agricultural sensors Revenue (undefined) Forecast, by Application 2020 & 2033
- Table 90: Oceania active agricultural sensors Volume (K) Forecast, by Application 2020 & 2033
- Table 91: Rest of Asia Pacific active agricultural sensors Revenue (undefined) Forecast, by Application 2020 & 2033
- Table 92: Rest of Asia Pacific active agricultural sensors Volume (K) Forecast, by Application 2020 & 2033
Frequently Asked Questions
1. What is the projected Compound Annual Growth Rate (CAGR) of the active agricultural sensors?
The projected CAGR is approximately 5.6%.
2. Which companies are prominent players in the active agricultural sensors?
Key companies in the market include Texas Instruments, CropX, Auroras, Vishay, Mouser, Honeywell, Caipos GmbH, Bosch, CropIn Technology Solutions, Avidor High Tech, Sensaphone, Dol-Sensors, Glana Sensors, Libelium Comunicaciones Distribuidas, Monnit Corporation, Pycno agriculture, Sensoterra, Sentera.
3. What are the main segments of the active agricultural sensors?
The market segments include Application, Types.
4. Can you provide details about the market size?
The market size is estimated to be USD XXX N/A as of 2022.
5. What are some drivers contributing to market growth?
N/A
6. What are the notable trends driving market growth?
N/A
7. Are there any restraints impacting market growth?
N/A
8. Can you provide examples of recent developments in the market?
N/A
9. What pricing options are available for accessing the report?
Pricing options include single-user, multi-user, and enterprise licenses priced at USD 4350.00, USD 6525.00, and USD 8700.00 respectively.
10. Is the market size provided in terms of value or volume?
The market size is provided in terms of value, measured in N/A and volume, measured in K.
11. Are there any specific market keywords associated with the report?
Yes, the market keyword associated with the report is "active agricultural sensors," which aids in identifying and referencing the specific market segment covered.
12. How do I determine which pricing option suits my needs best?
The pricing options vary based on user requirements and access needs. Individual users may opt for single-user licenses, while businesses requiring broader access may choose multi-user or enterprise licenses for cost-effective access to the report.
13. Are there any additional resources or data provided in the active agricultural sensors report?
While the report offers comprehensive insights, it's advisable to review the specific contents or supplementary materials provided to ascertain if additional resources or data are available.
14. How can I stay updated on further developments or reports in the active agricultural sensors?
To stay informed about further developments, trends, and reports in the active agricultural sensors, consider subscribing to industry newsletters, following relevant companies and organizations, or regularly checking reputable industry news sources and publications.
Methodology
Step 1 - Identification of Relevant Samples Size from Population Database


Step 2 - Approaches for Defining Global Market Size (Value, Volume* & Price*)

Note*: In applicable scenarios
Step 3 - Data Sources
Primary Research
- Web Analytics
- Survey Reports
- Research Institute
- Latest Research Reports
- Opinion Leaders
Secondary Research
- Annual Reports
- White Paper
- Latest Press Release
- Industry Association
- Paid Database
- Investor Presentations

Step 4 - Data Triangulation
Involves using different sources of information in order to increase the validity of a study
These sources are likely to be stakeholders in a program - participants, other researchers, program staff, other community members, and so on.
Then we put all data in single framework & apply various statistical tools to find out the dynamic on the market.
During the analysis stage, feedback from the stakeholder groups would be compared to determine areas of agreement as well as areas of divergence