

Key Insights
The AC Charging Equipment market is poised for significant expansion, projected to reach an estimated $45.59 billion by 2025. This robust growth is fueled by the accelerating adoption of electric vehicles (EVs) globally, driven by increasing environmental consciousness, government incentives, and advancements in battery technology. The market is expected to witness a Compound Annual Growth Rate (CAGR) of 19.18% during the forecast period of 2025-2033. Key drivers include supportive government policies promoting EV infrastructure development, declining EV battery costs making EVs more accessible, and the expanding network of charging stations, both public and private. The growing demand for Level 2 AC charging solutions, which offer a balance of charging speed and cost-effectiveness, is a major trend. Furthermore, the integration of smart charging capabilities, enabling grid optimization and demand response, is becoming increasingly prevalent.
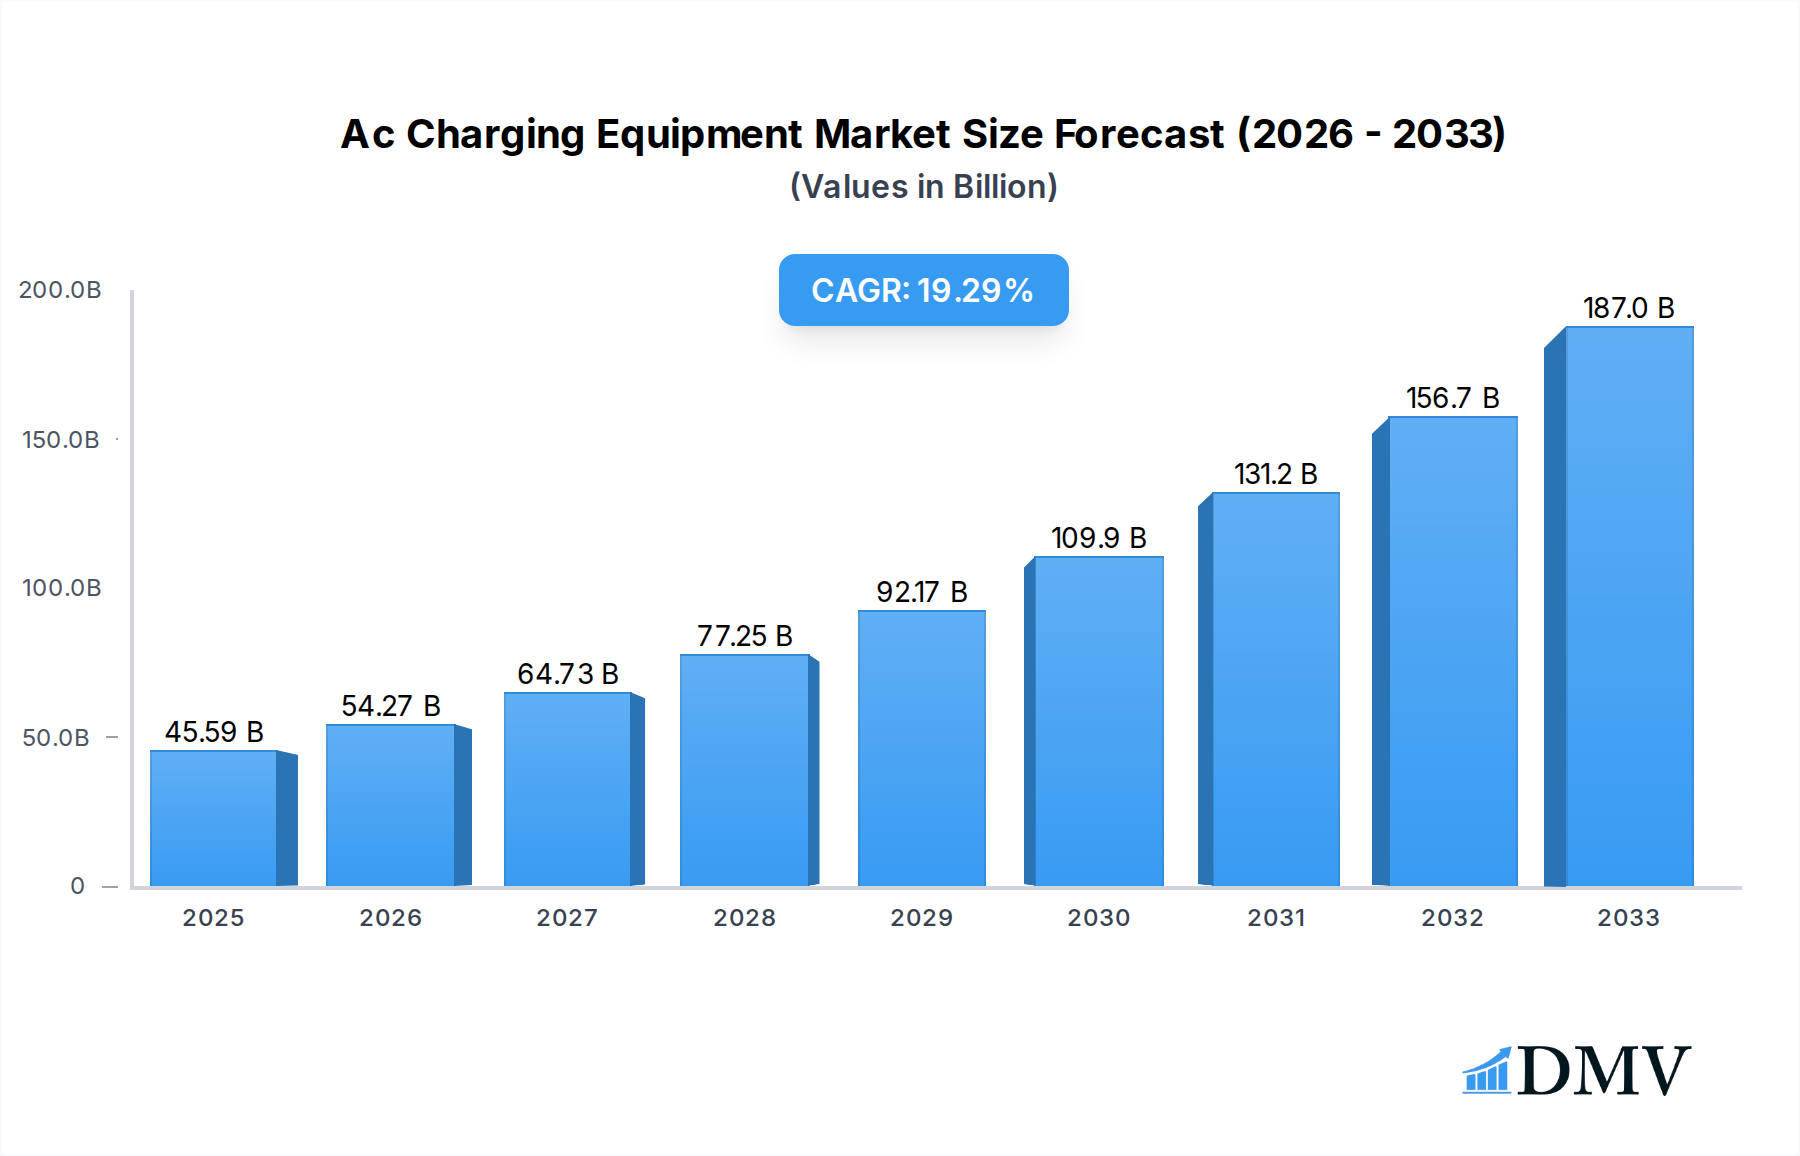
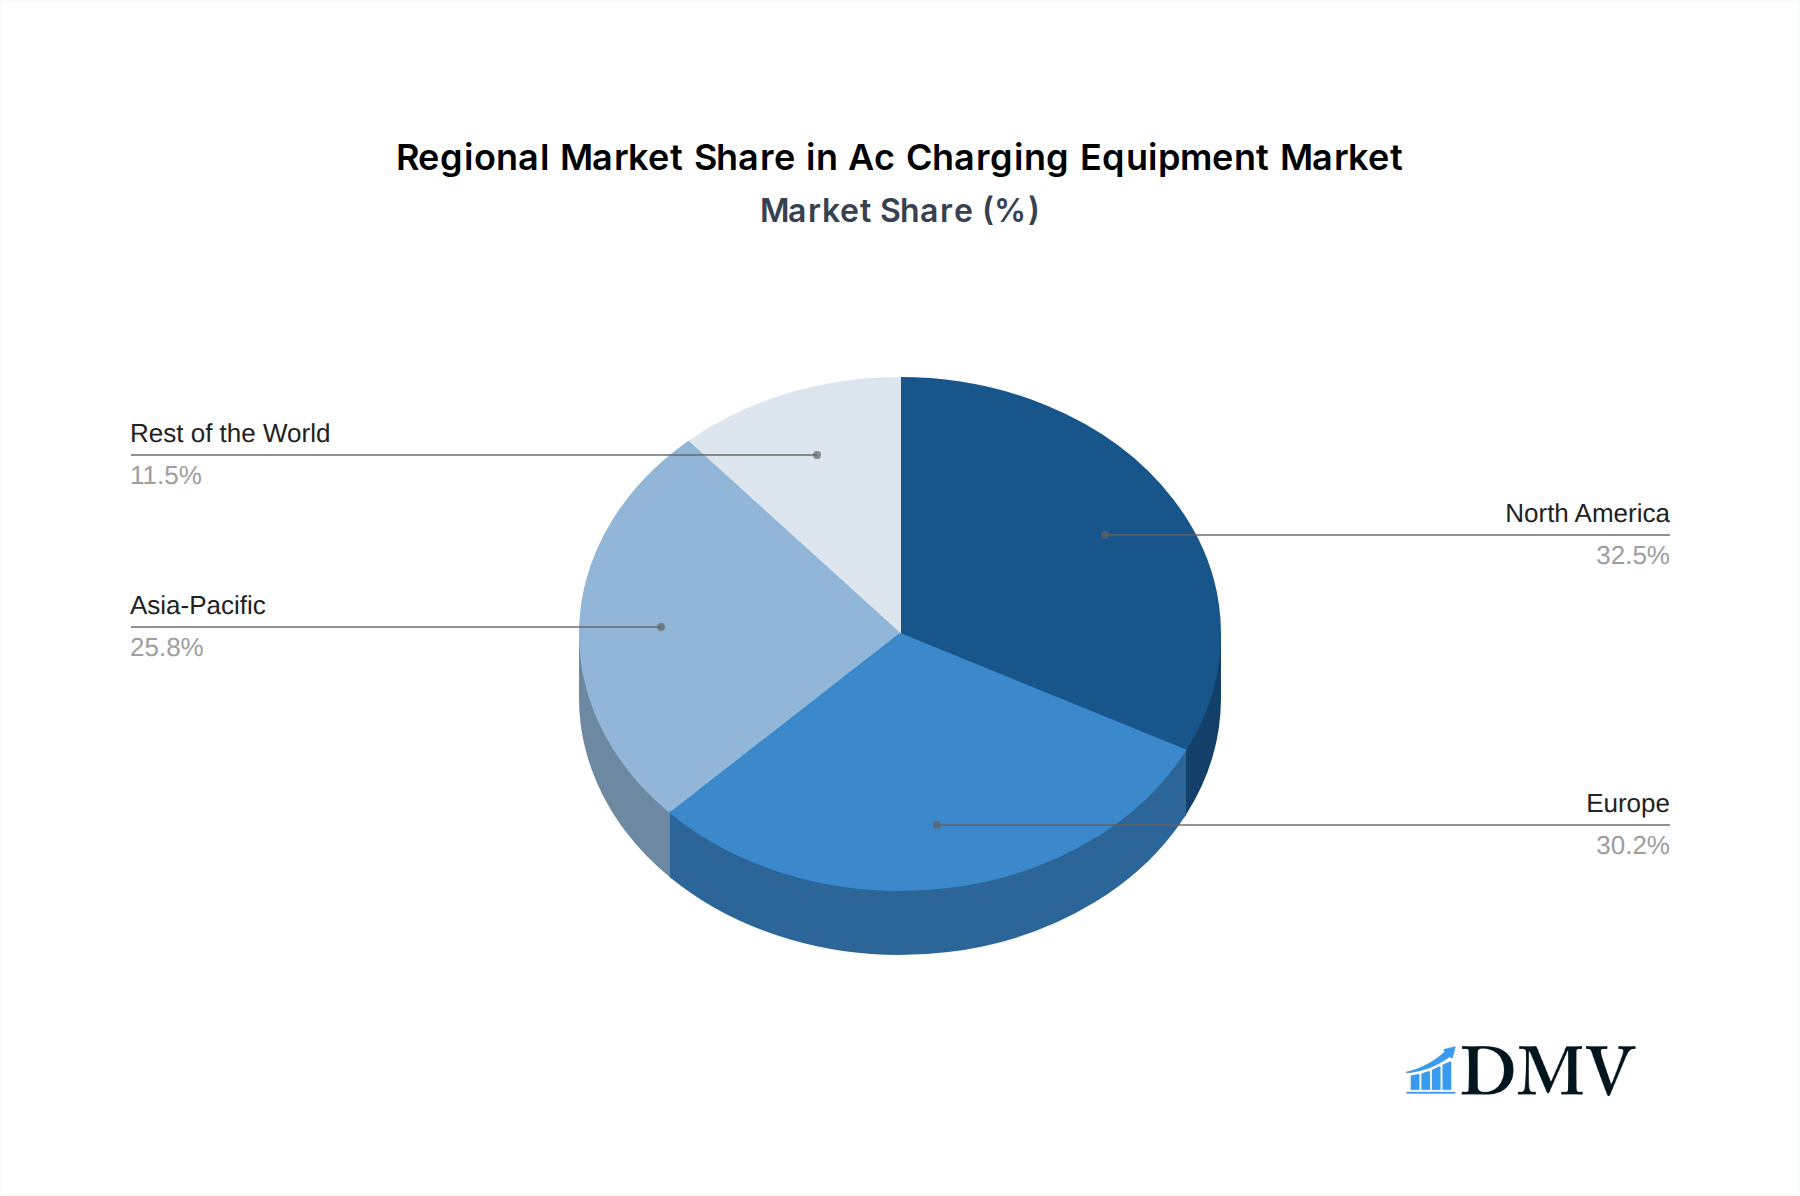
Ac Charging Equipment Market Size (In Billion)
While the market is experiencing a surge, certain restraints could temper its growth trajectory. These include the upfront cost of installing charging infrastructure, especially in less developed regions, and the need for grid upgrades to accommodate the increased electricity demand from a growing EV fleet. Cybersecurity concerns related to connected charging stations and standardization challenges across different charging protocols also present hurdles. The competitive landscape is marked by the presence of major players like GE, Schneider Electric, ChargePoint, and Siemens, who are actively investing in innovation and expanding their product portfolios. The market is segmented by application, including residential, commercial, and public charging, and by type, such as Level 1, Level 2, and Level 3 AC chargers. The North American and European regions are expected to lead the market due to strong government support and high EV adoption rates, with Asia-Pacific showing rapid growth potential.

Ac Charging Equipment Company Market Share
AC Charging Equipment Market Composition & Trends
The global AC charging equipment market is characterized by a moderately concentrated competitive landscape, with key players like GE, Schneider Electric, AeroVironment, ChargePoint, Bosch, ABB, and Eaton actively shaping market dynamics. Innovation catalysts are primarily driven by the accelerating adoption of electric vehicles (EVs) and governmental incentives aimed at promoting sustainable transportation. Regulatory landscapes, including evolving charging standards and grid integration policies, are crucial determinants of market accessibility and expansion. Substitute products, such as DC fast chargers, present a competitive challenge, but AC charging's cost-effectiveness and suitability for residential and workplace charging maintain its relevance. End-user profiles are increasingly diverse, encompassing individual EV owners, fleet operators, commercial businesses, and public charging infrastructure providers. Merger and acquisition (M&A) activities are on the rise as established players seek to expand their portfolios and gain market share. For instance, recent M&A deals in the AC charging sector are estimated to exceed a combined value of $5 billion, reflecting the strategic importance of this segment. The market share distribution is dynamic, with ChargePoint and Schneider Electric currently holding substantial portions, estimated at 15% and 12% respectively. Emerging economies are also witnessing increased activity, with companies like Beijing New Energy Technology and Shenzhen SETEC Power making significant inroads. The overall market trend points towards increased demand for smart charging solutions and bidirectional charging capabilities, fostering a robust growth trajectory for AC charging equipment.
AC Charging Equipment Industry Evolution
The AC charging equipment industry has undergone a profound evolution, propelled by rapid advancements in electric vehicle technology and a global surge in environmental consciousness. During the historical period of 2019-2024, the market witnessed consistent growth, averaging an annual growth rate of approximately 25%. This expansion was fueled by early adoption of EVs in key markets and the subsequent need for accessible charging infrastructure. Technological advancements have been a cornerstone of this evolution. From basic Level 1 chargers, the industry has progressed to sophisticated Level 2 AC charging solutions offering faster charging speeds and smart functionalities. The introduction of Wi-Fi and Bluetooth connectivity, enabling remote monitoring and control through mobile applications, has significantly enhanced user experience. Moreover, the development of interoperable charging standards has reduced fragmentation and facilitated broader adoption. Shifting consumer demands have played a pivotal role. As EV range anxiety has diminished and charging infrastructure has become more prevalent, consumers are increasingly prioritizing convenience, affordability, and seamless integration into their daily routines. The perception of EVs as a viable and sustainable transportation alternative has solidified, driving higher purchase intent and, consequently, greater demand for AC charging equipment. The estimated market size for AC charging equipment in 2025 is projected to reach $30 billion, with an anticipated compound annual growth rate (CAGR) of 28% from 2025 to 2033. This robust growth trajectory is underpinned by increasing government mandates for EV sales, declining battery costs, and a growing network of public and private charging stations. Industry developments such as the integration of renewable energy sources with charging infrastructure and the emergence of vehicle-to-grid (V2G) capabilities are further shaping the future of AC charging.
Leading Regions, Countries, or Segments in AC Charging Equipment
The dominance within the AC charging equipment market is most pronounced in North America, particularly the United States, for the Application of Residential Charging and the Type of Level 2 Chargers. This leadership is a multifaceted phenomenon driven by a potent combination of supportive government policies, robust EV adoption rates, and significant private sector investment.
- Investment Trends in the United States: The U.S. government has enacted substantial incentives, including tax credits and grants, aimed at bolstering EV sales and charging infrastructure deployment. These initiatives have fostered an environment where significant private capital, estimated to exceed $10 billion invested in charging infrastructure between 2020 and 2024, flows into the sector. Major players like ChargePoint, AeroVironment, and Eaton have strategically established a strong presence, benefiting from these favorable conditions.
- Regulatory Support for Residential Charging: Policies promoting the installation of EV charging stations in new constructions and existing homes have been instrumental. For instance, state-level mandates and local building codes often require or encourage the inclusion of charging infrastructure, directly boosting the demand for Level 2 AC chargers in residential settings. This has created a consistent and substantial market for home charging solutions.
- EV Adoption Rates: The United States consistently ranks among the top global markets for electric vehicle sales. This high adoption rate directly translates into a burgeoning demand for AC charging equipment, especially Level 2 chargers, which are ideal for overnight charging at home. The sheer volume of EVs on the road necessitates a widespread and accessible charging network.
- Technological Advancement and Innovation: Companies operating in the U.S. market are at the forefront of developing smart and connected AC charging solutions. These innovations, including app-controlled charging, load balancing, and integration with home energy management systems, enhance the user experience and drive demand for advanced Level 2 chargers. The estimated market penetration of smart AC chargers in residential settings in the U.S. is projected to reach 70% by 2028.
- Commercial and Fleet Charging Expansion: Beyond residential applications, the U.S. is also witnessing significant growth in AC charging for commercial fleets and workplaces. Companies are investing in charging infrastructure to support their transitioning EV fleets, further solidifying the demand for Level 2 AC charging equipment. This segment is projected to contribute an additional $5 billion in market value by 2030.
In-depth analysis reveals that the synergy between supportive governmental policies, high consumer demand for EVs, and continuous innovation in charging technology has cemented North America's, and particularly the U.S.'s, leadership in residential AC charging and Level 2 charger deployment. The estimated market value for this segment alone is predicted to surpass $15 billion by 2028.
AC Charging Equipment Product Innovations
Recent product innovations in AC charging equipment are significantly enhancing user experience and driving market growth. Companies are focusing on developing intelligent chargers that offer smart grid integration, enabling dynamic load balancing and optimized charging based on electricity prices and grid availability. Advanced communication protocols ensure seamless connectivity with EV charging networks and mobile applications, providing users with real-time charging status, remote control, and personalized charging schedules. Furthermore, there's a growing emphasis on robust and durable designs, catering to both indoor and outdoor installations. Innovations in inductive charging capabilities, though still in early stages for AC, promise a future of cable-free convenience. The integration of cybersecurity features is also paramount, safeguarding user data and preventing unauthorized access to charging infrastructure, with an estimated 99.9% of new chargers incorporating advanced security measures.
Propelling Factors for AC Charging Equipment Growth
The growth of the AC charging equipment market is propelled by several key factors. Firstly, the accelerated adoption of electric vehicles globally, driven by environmental concerns and decreasing battery costs, creates a direct demand for charging solutions. Secondly, supportive government policies and incentives, including subsidies for EV purchases and charging infrastructure deployment, further stimulate market expansion. For example, the Inflation Reduction Act in the U.S. provides significant tax credits for charging equipment. Thirdly, declining electricity prices in some regions and the growing integration of renewable energy sources make EV charging more economically attractive. Finally, advancements in smart charging technology, offering features like remote management, load balancing, and integration with home energy systems, enhance convenience and efficiency, thereby boosting consumer adoption. The estimated growth contribution from these factors is projected to be substantial, exceeding $40 billion in market value by 2030.
Obstacles in the AC Charging Equipment Market
Despite robust growth, the AC charging equipment market faces several obstacles. High initial installation costs for charging infrastructure, especially for commercial and public deployments, can deter some potential investors. Interoperability challenges and varying charging standards across different regions and manufacturers can create confusion and inconvenience for users. Grid capacity limitations in certain areas can restrict the widespread deployment of high-power charging solutions. Supply chain disruptions, as witnessed in recent years, can impact the availability of essential components and lead to price volatility. Finally, regulatory hurdles and lengthy permitting processes in some municipalities can slow down infrastructure rollout, with an estimated 15% delay in project timelines due to such challenges.
Future Opportunities in AC Charging Equipment
Emerging opportunities in the AC charging equipment market are diverse and promising. The increasing prevalence of smart charging and vehicle-to-grid (V2G) capabilities presents a significant avenue for growth, allowing EVs to not only draw power but also feed it back to the grid, creating new revenue streams for EV owners and grid operators. The expansion into emerging markets with rapidly growing EV adoption rates offers substantial untapped potential. Furthermore, the development of bidirectional charging technology will unlock new applications for energy management and grid stabilization. The focus on sustainable and recyclable materials in charger manufacturing also aligns with growing environmental consciousness and could become a key differentiator. The integration of AI-powered diagnostics and predictive maintenance for charging infrastructure is another area ripe for innovation and market penetration, potentially reducing downtime by over 20%.
Major Players in the Ac Charging Equipment Ecosystem
- GE
- Schneider Electric
- AeroVironment
- ChargePoint
- Bosch
- ABB
- Aker Wade
- Eaton
- Beijing New Energy Technology
- Chargemaster
- Shenzhen SETEC Power
- Delta Electronics
- Siemens
- Hitachi
- Legrand
- Leviton
- NARI Group Corporation
Key Developments in Ac Charging Equipment Industry
- 2023/05: ChargePoint announces a new range of smart AC chargers with enhanced cybersecurity features, aiming to address growing concerns over data protection.
- 2023/08: Schneider Electric partners with a leading utility company to deploy over 10,000 Level 2 AC chargers across a major metropolitan area, boosting public charging infrastructure.
- 2023/11: AeroVironment launches an integrated charging and energy management solution for commercial fleets, offering optimized charging schedules and cost savings.
- 2024/01: Bosch introduces an AI-powered AC charger that predicts and prevents potential hardware failures, aiming to reduce maintenance costs by an estimated 20%.
- 2024/03: ABB showcases its latest AC charging technology with advanced bidirectional power flow capabilities, paving the way for V2G integration.
- 2024/06: Eaton acquires a significant stake in a smart home energy management company, signaling a move towards integrated AC charging and home power solutions.
- 2024/09: GE announces a strategic collaboration to develop next-generation AC chargers for apartment buildings, addressing a key charging gap for urban dwellers.
- 2025/01 (Estimated): Beijing New Energy Technology is expected to launch a new line of ultra-compact and cost-effective Level 2 AC chargers targeting the rapidly expanding Asian EV market.
- 2025/04 (Estimated): Shenzhen SETEC Power is projected to introduce an innovative AC charging solution with integrated solar charging capabilities, catering to the growing demand for renewable energy integration.
Strategic Ac Charging Equipment Market Forecast
The strategic AC charging equipment market forecast indicates sustained and significant growth, driven by the unstoppable momentum of electric vehicle adoption and supportive global policies. The market is poised to benefit from continued technological advancements, particularly in smart charging, V2G capabilities, and enhanced user convenience. Investments in charging infrastructure are projected to exceed $100 billion globally by 2030, with AC charging equipment forming a substantial portion of this expansion. Key growth catalysts include government mandates for emissions reduction, declining EV prices, and increasing consumer awareness of the environmental and economic benefits of electric mobility. The estimated market potential for AC charging equipment by 2033 is predicted to reach a valuation of over $100 billion, underscoring its critical role in the future of transportation and energy.
Ac Charging Equipment Segmentation
-
1. Application
- 1.1. undefined
-
2. Type
- 2.1. undefined
Ac Charging Equipment Segmentation By Geography
- 1. undefined
- 2. undefined
- 3. undefined
- 4. undefined
- 5. undefined
Ac Charging Equipment Regional Market Share
Geographic Coverage of Ac Charging Equipment
Ac Charging Equipment REPORT HIGHLIGHTS
| Aspects | Details |
|---|---|
| Study Period | 2020-2034 |
| Base Year | 2025 |
| Estimated Year | 2026 |
| Forecast Period | 2026-2034 |
| Historical Period | 2020-2025 |
| Growth Rate | CAGR of 19.18% from 2020-2034 |
| Segmentation |
|
Table of Contents
- 1. Introduction
- 1.1. Research Scope
- 1.2. Market Segmentation
- 1.3. Research Methodology
- 1.4. Definitions and Assumptions
- 2. Executive Summary
- 2.1. Introduction
- 3. Market Dynamics
- 3.1. Introduction
- 3.2. Market Drivers
- 3.3. Market Restrains
- 3.4. Market Trends
- 4. Market Factor Analysis
- 4.1. Porters Five Forces
- 4.2. Supply/Value Chain
- 4.3. PESTEL analysis
- 4.4. Market Entropy
- 4.5. Patent/Trademark Analysis
- 5. Global Ac Charging Equipment Analysis, Insights and Forecast, 2020-2032
- 5.1. Market Analysis, Insights and Forecast - by Application
- 5.1.1.
- 5.2. Market Analysis, Insights and Forecast - by Type
- 5.2.1.
- 5.3. Market Analysis, Insights and Forecast - by Region
- 5.3.1.
- 5.3.2.
- 5.3.3.
- 5.3.4.
- 5.3.5.
- 5.1. Market Analysis, Insights and Forecast - by Application
- 6. undefined Ac Charging Equipment Analysis, Insights and Forecast, 2020-2032
- 6.1. Market Analysis, Insights and Forecast - by Application
- 6.1.1.
- 6.2. Market Analysis, Insights and Forecast - by Type
- 6.2.1.
- 6.1. Market Analysis, Insights and Forecast - by Application
- 7. undefined Ac Charging Equipment Analysis, Insights and Forecast, 2020-2032
- 7.1. Market Analysis, Insights and Forecast - by Application
- 7.1.1.
- 7.2. Market Analysis, Insights and Forecast - by Type
- 7.2.1.
- 7.1. Market Analysis, Insights and Forecast - by Application
- 8. undefined Ac Charging Equipment Analysis, Insights and Forecast, 2020-2032
- 8.1. Market Analysis, Insights and Forecast - by Application
- 8.1.1.
- 8.2. Market Analysis, Insights and Forecast - by Type
- 8.2.1.
- 8.1. Market Analysis, Insights and Forecast - by Application
- 9. undefined Ac Charging Equipment Analysis, Insights and Forecast, 2020-2032
- 9.1. Market Analysis, Insights and Forecast - by Application
- 9.1.1.
- 9.2. Market Analysis, Insights and Forecast - by Type
- 9.2.1.
- 9.1. Market Analysis, Insights and Forecast - by Application
- 10. undefined Ac Charging Equipment Analysis, Insights and Forecast, 2020-2032
- 10.1. Market Analysis, Insights and Forecast - by Application
- 10.1.1.
- 10.2. Market Analysis, Insights and Forecast - by Type
- 10.2.1.
- 10.1. Market Analysis, Insights and Forecast - by Application
- 11. Competitive Analysis
- 11.1. Global Market Share Analysis 2025
- 11.2. Company Profiles
- 11.2.1 GE
- 11.2.1.1. Overview
- 11.2.1.2. Products
- 11.2.1.3. SWOT Analysis
- 11.2.1.4. Recent Developments
- 11.2.1.5. Financials (Based on Availability)
- 11.2.2 Schneider
- 11.2.2.1. Overview
- 11.2.2.2. Products
- 11.2.2.3. SWOT Analysis
- 11.2.2.4. Recent Developments
- 11.2.2.5. Financials (Based on Availability)
- 11.2.3 AeroVironment
- 11.2.3.1. Overview
- 11.2.3.2. Products
- 11.2.3.3. SWOT Analysis
- 11.2.3.4. Recent Developments
- 11.2.3.5. Financials (Based on Availability)
- 11.2.4 ChargePoint
- 11.2.4.1. Overview
- 11.2.4.2. Products
- 11.2.4.3. SWOT Analysis
- 11.2.4.4. Recent Developments
- 11.2.4.5. Financials (Based on Availability)
- 11.2.5 Bosch
- 11.2.5.1. Overview
- 11.2.5.2. Products
- 11.2.5.3. SWOT Analysis
- 11.2.5.4. Recent Developments
- 11.2.5.5. Financials (Based on Availability)
- 11.2.6 ABB
- 11.2.6.1. Overview
- 11.2.6.2. Products
- 11.2.6.3. SWOT Analysis
- 11.2.6.4. Recent Developments
- 11.2.6.5. Financials (Based on Availability)
- 11.2.7 Aker Wade
- 11.2.7.1. Overview
- 11.2.7.2. Products
- 11.2.7.3. SWOT Analysis
- 11.2.7.4. Recent Developments
- 11.2.7.5. Financials (Based on Availability)
- 11.2.8 Eaton
- 11.2.8.1. Overview
- 11.2.8.2. Products
- 11.2.8.3. SWOT Analysis
- 11.2.8.4. Recent Developments
- 11.2.8.5. Financials (Based on Availability)
- 11.2.9 Beijing New Energy Technology
- 11.2.9.1. Overview
- 11.2.9.2. Products
- 11.2.9.3. SWOT Analysis
- 11.2.9.4. Recent Developments
- 11.2.9.5. Financials (Based on Availability)
- 11.2.10 Chargemaster
- 11.2.10.1. Overview
- 11.2.10.2. Products
- 11.2.10.3. SWOT Analysis
- 11.2.10.4. Recent Developments
- 11.2.10.5. Financials (Based on Availability)
- 11.2.11 Shenzhen SETEC Power
- 11.2.11.1. Overview
- 11.2.11.2. Products
- 11.2.11.3. SWOT Analysis
- 11.2.11.4. Recent Developments
- 11.2.11.5. Financials (Based on Availability)
- 11.2.12 Delta Electronics
- 11.2.12.1. Overview
- 11.2.12.2. Products
- 11.2.12.3. SWOT Analysis
- 11.2.12.4. Recent Developments
- 11.2.12.5. Financials (Based on Availability)
- 11.2.13 Siemens
- 11.2.13.1. Overview
- 11.2.13.2. Products
- 11.2.13.3. SWOT Analysis
- 11.2.13.4. Recent Developments
- 11.2.13.5. Financials (Based on Availability)
- 11.2.14 Hitachi
- 11.2.14.1. Overview
- 11.2.14.2. Products
- 11.2.14.3. SWOT Analysis
- 11.2.14.4. Recent Developments
- 11.2.14.5. Financials (Based on Availability)
- 11.2.15 Legrand
- 11.2.15.1. Overview
- 11.2.15.2. Products
- 11.2.15.3. SWOT Analysis
- 11.2.15.4. Recent Developments
- 11.2.15.5. Financials (Based on Availability)
- 11.2.16 Leviton
- 11.2.16.1. Overview
- 11.2.16.2. Products
- 11.2.16.3. SWOT Analysis
- 11.2.16.4. Recent Developments
- 11.2.16.5. Financials (Based on Availability)
- 11.2.17 NARI Group Corporation
- 11.2.17.1. Overview
- 11.2.17.2. Products
- 11.2.17.3. SWOT Analysis
- 11.2.17.4. Recent Developments
- 11.2.17.5. Financials (Based on Availability)
- 11.2.1 GE
List of Figures
- Figure 1: Global Ac Charging Equipment Revenue Breakdown (undefined, %) by Region 2025 & 2033
- Figure 2: undefined Ac Charging Equipment Revenue (undefined), by Application 2025 & 2033
- Figure 3: undefined Ac Charging Equipment Revenue Share (%), by Application 2025 & 2033
- Figure 4: undefined Ac Charging Equipment Revenue (undefined), by Type 2025 & 2033
- Figure 5: undefined Ac Charging Equipment Revenue Share (%), by Type 2025 & 2033
- Figure 6: undefined Ac Charging Equipment Revenue (undefined), by Country 2025 & 2033
- Figure 7: undefined Ac Charging Equipment Revenue Share (%), by Country 2025 & 2033
- Figure 8: undefined Ac Charging Equipment Revenue (undefined), by Application 2025 & 2033
- Figure 9: undefined Ac Charging Equipment Revenue Share (%), by Application 2025 & 2033
- Figure 10: undefined Ac Charging Equipment Revenue (undefined), by Type 2025 & 2033
- Figure 11: undefined Ac Charging Equipment Revenue Share (%), by Type 2025 & 2033
- Figure 12: undefined Ac Charging Equipment Revenue (undefined), by Country 2025 & 2033
- Figure 13: undefined Ac Charging Equipment Revenue Share (%), by Country 2025 & 2033
- Figure 14: undefined Ac Charging Equipment Revenue (undefined), by Application 2025 & 2033
- Figure 15: undefined Ac Charging Equipment Revenue Share (%), by Application 2025 & 2033
- Figure 16: undefined Ac Charging Equipment Revenue (undefined), by Type 2025 & 2033
- Figure 17: undefined Ac Charging Equipment Revenue Share (%), by Type 2025 & 2033
- Figure 18: undefined Ac Charging Equipment Revenue (undefined), by Country 2025 & 2033
- Figure 19: undefined Ac Charging Equipment Revenue Share (%), by Country 2025 & 2033
- Figure 20: undefined Ac Charging Equipment Revenue (undefined), by Application 2025 & 2033
- Figure 21: undefined Ac Charging Equipment Revenue Share (%), by Application 2025 & 2033
- Figure 22: undefined Ac Charging Equipment Revenue (undefined), by Type 2025 & 2033
- Figure 23: undefined Ac Charging Equipment Revenue Share (%), by Type 2025 & 2033
- Figure 24: undefined Ac Charging Equipment Revenue (undefined), by Country 2025 & 2033
- Figure 25: undefined Ac Charging Equipment Revenue Share (%), by Country 2025 & 2033
- Figure 26: undefined Ac Charging Equipment Revenue (undefined), by Application 2025 & 2033
- Figure 27: undefined Ac Charging Equipment Revenue Share (%), by Application 2025 & 2033
- Figure 28: undefined Ac Charging Equipment Revenue (undefined), by Type 2025 & 2033
- Figure 29: undefined Ac Charging Equipment Revenue Share (%), by Type 2025 & 2033
- Figure 30: undefined Ac Charging Equipment Revenue (undefined), by Country 2025 & 2033
- Figure 31: undefined Ac Charging Equipment Revenue Share (%), by Country 2025 & 2033
List of Tables
- Table 1: Global Ac Charging Equipment Revenue undefined Forecast, by Application 2020 & 2033
- Table 2: Global Ac Charging Equipment Revenue undefined Forecast, by Type 2020 & 2033
- Table 3: Global Ac Charging Equipment Revenue undefined Forecast, by Region 2020 & 2033
- Table 4: Global Ac Charging Equipment Revenue undefined Forecast, by Application 2020 & 2033
- Table 5: Global Ac Charging Equipment Revenue undefined Forecast, by Type 2020 & 2033
- Table 6: Global Ac Charging Equipment Revenue undefined Forecast, by Country 2020 & 2033
- Table 7: Global Ac Charging Equipment Revenue undefined Forecast, by Application 2020 & 2033
- Table 8: Global Ac Charging Equipment Revenue undefined Forecast, by Type 2020 & 2033
- Table 9: Global Ac Charging Equipment Revenue undefined Forecast, by Country 2020 & 2033
- Table 10: Global Ac Charging Equipment Revenue undefined Forecast, by Application 2020 & 2033
- Table 11: Global Ac Charging Equipment Revenue undefined Forecast, by Type 2020 & 2033
- Table 12: Global Ac Charging Equipment Revenue undefined Forecast, by Country 2020 & 2033
- Table 13: Global Ac Charging Equipment Revenue undefined Forecast, by Application 2020 & 2033
- Table 14: Global Ac Charging Equipment Revenue undefined Forecast, by Type 2020 & 2033
- Table 15: Global Ac Charging Equipment Revenue undefined Forecast, by Country 2020 & 2033
- Table 16: Global Ac Charging Equipment Revenue undefined Forecast, by Application 2020 & 2033
- Table 17: Global Ac Charging Equipment Revenue undefined Forecast, by Type 2020 & 2033
- Table 18: Global Ac Charging Equipment Revenue undefined Forecast, by Country 2020 & 2033
Frequently Asked Questions
1. What is the projected Compound Annual Growth Rate (CAGR) of the Ac Charging Equipment?
The projected CAGR is approximately 19.18%.
2. Which companies are prominent players in the Ac Charging Equipment?
Key companies in the market include GE, Schneider, AeroVironment, ChargePoint, Bosch, ABB, Aker Wade, Eaton, Beijing New Energy Technology, Chargemaster, Shenzhen SETEC Power, Delta Electronics, Siemens, Hitachi, Legrand, Leviton, NARI Group Corporation.
3. What are the main segments of the Ac Charging Equipment?
The market segments include Application, Type.
4. Can you provide details about the market size?
The market size is estimated to be USD XXX N/A as of 2022.
5. What are some drivers contributing to market growth?
N/A
6. What are the notable trends driving market growth?
N/A
7. Are there any restraints impacting market growth?
N/A
8. Can you provide examples of recent developments in the market?
N/A
9. What pricing options are available for accessing the report?
Pricing options include single-user, multi-user, and enterprise licenses priced at USD 4250.00, USD 6375.00, and USD 8500.00 respectively.
10. Is the market size provided in terms of value or volume?
The market size is provided in terms of value, measured in N/A.
11. Are there any specific market keywords associated with the report?
Yes, the market keyword associated with the report is "Ac Charging Equipment," which aids in identifying and referencing the specific market segment covered.
12. How do I determine which pricing option suits my needs best?
The pricing options vary based on user requirements and access needs. Individual users may opt for single-user licenses, while businesses requiring broader access may choose multi-user or enterprise licenses for cost-effective access to the report.
13. Are there any additional resources or data provided in the Ac Charging Equipment report?
While the report offers comprehensive insights, it's advisable to review the specific contents or supplementary materials provided to ascertain if additional resources or data are available.
14. How can I stay updated on further developments or reports in the Ac Charging Equipment?
To stay informed about further developments, trends, and reports in the Ac Charging Equipment, consider subscribing to industry newsletters, following relevant companies and organizations, or regularly checking reputable industry news sources and publications.
Methodology
Step 1 - Identification of Relevant Samples Size from Population Database


Step 2 - Approaches for Defining Global Market Size (Value, Volume* & Price*)

Note*: In applicable scenarios
Step 3 - Data Sources
Primary Research
- Web Analytics
- Survey Reports
- Research Institute
- Latest Research Reports
- Opinion Leaders
Secondary Research
- Annual Reports
- White Paper
- Latest Press Release
- Industry Association
- Paid Database
- Investor Presentations

Step 4 - Data Triangulation
Involves using different sources of information in order to increase the validity of a study
These sources are likely to be stakeholders in a program - participants, other researchers, program staff, other community members, and so on.
Then we put all data in single framework & apply various statistical tools to find out the dynamic on the market.
During the analysis stage, feedback from the stakeholder groups would be compared to determine areas of agreement as well as areas of divergence