

Key Insights
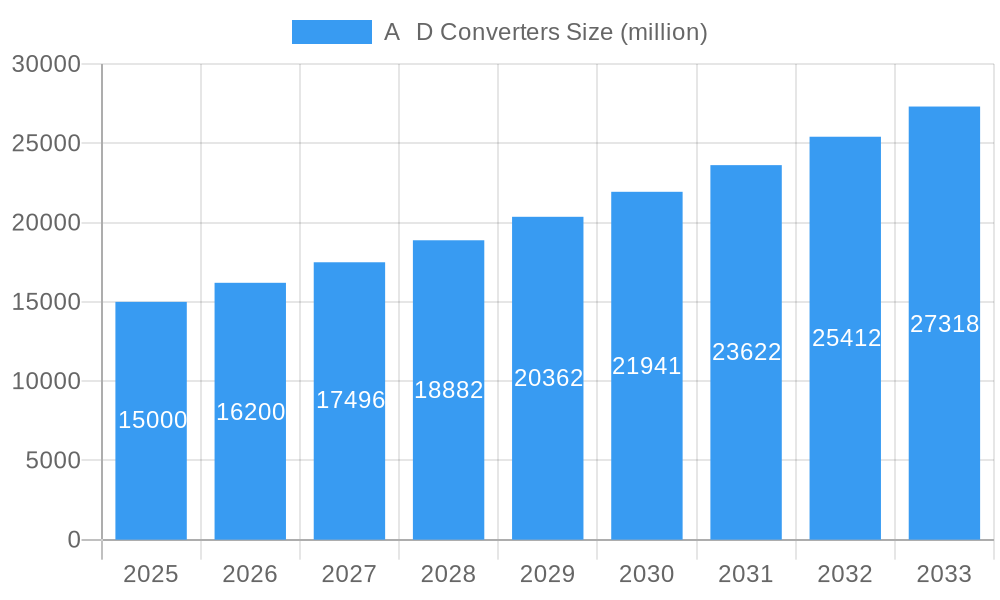
The Analog-to-Digital Converter (ADC) market is experiencing robust growth, driven by the increasing demand for high-resolution data acquisition in diverse sectors. The market, estimated at $15 billion in 2025, is projected to exhibit a Compound Annual Growth Rate (CAGR) of 8% from 2025 to 2033, reaching approximately $28 billion by 2033. This growth is fueled by several key factors, including the proliferation of IoT devices requiring high-precision sensing, advancements in automotive electronics necessitating sophisticated sensor integration, and the rising adoption of ADCs in industrial automation for improved process control and monitoring. The continuous miniaturization of ADC technology, along with enhanced energy efficiency, further contributes to market expansion. Key players like Analog Devices (ADI), Texas Instruments (TI), Maxim Integrated, and others are investing heavily in R&D, introducing advanced products with higher sampling rates, improved resolution, and lower power consumption, fostering intense competition and innovation within the market.
A D Converters Market Size (In Billion)
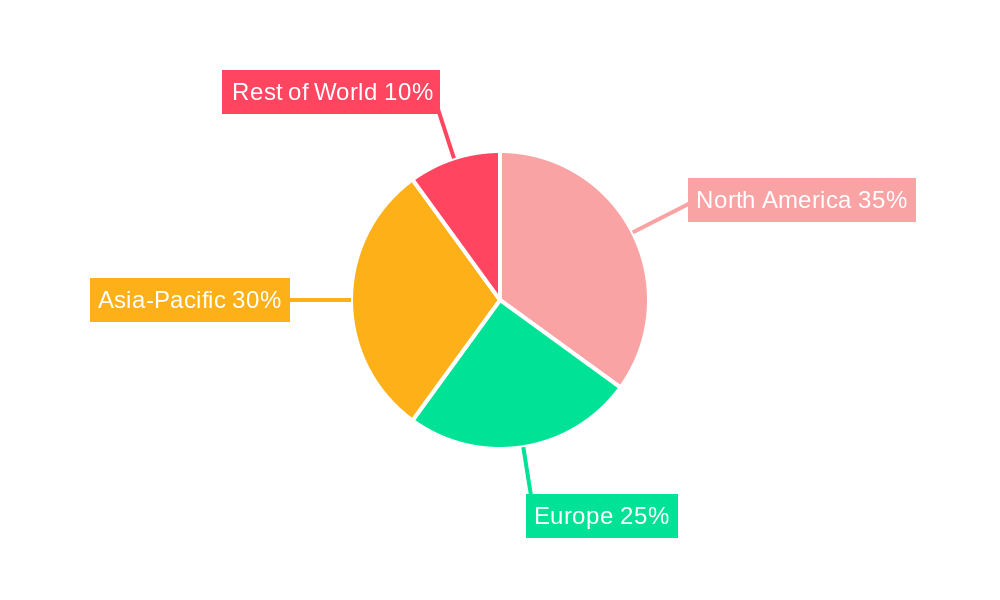
Market segmentation reveals significant growth potential across various application areas. High-resolution ADCs are witnessing increased demand in medical imaging and instrumentation, while lower-power solutions are crucial for portable and wearable applications. The automotive industry is a significant driver, with ADCs playing a vital role in Advanced Driver-Assistance Systems (ADAS) and autonomous driving technologies. Regional growth varies, with North America and Asia-Pacific expected to lead, driven by strong technological advancements and high consumer electronics adoption. However, certain restraints, such as the high initial investment costs associated with advanced ADC technologies and the potential for supply chain disruptions, could pose challenges to market growth. Nonetheless, the long-term outlook remains positive, with continued innovation and technological advancements driving the expansion of the ADC market throughout the forecast period.
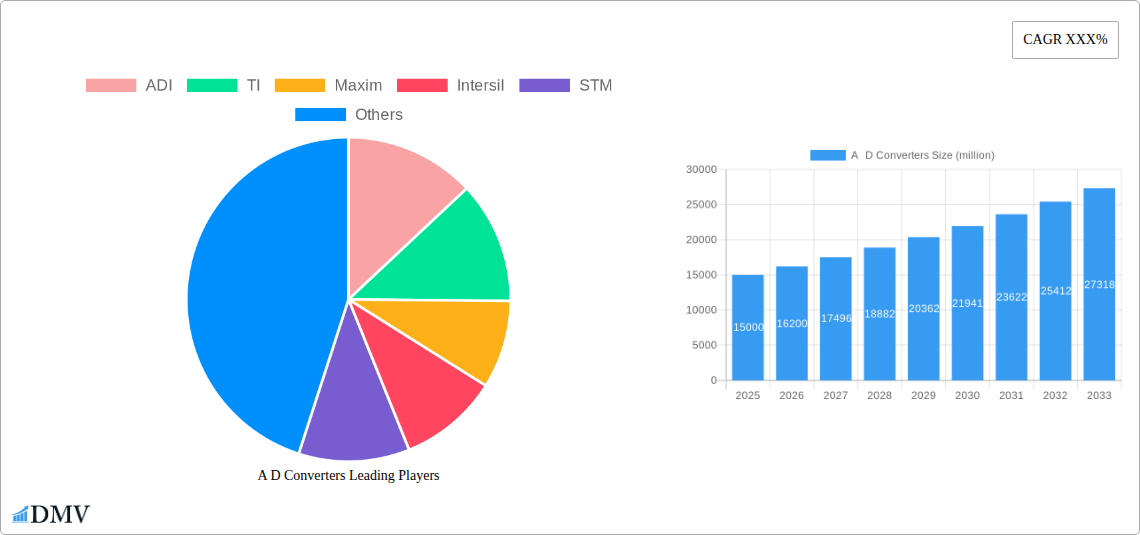
A D Converters Company Market Share
A D Converters Market Report: A Comprehensive Analysis of a Multi-Billion Dollar Industry (2019-2033)
This in-depth report provides a comprehensive analysis of the A/D Converters market, projecting a multi-billion dollar valuation by 2033. It offers invaluable insights into market dynamics, technological advancements, and future growth opportunities, equipping stakeholders with the knowledge to make informed strategic decisions. The report covers the period from 2019 to 2033, with a base year of 2025 and a forecast period of 2025-2033. Key players such as ADI, TI, Maxim, Intersil, STM, ON Semiconductor, Microchip, NXP, Cirrus Logic, and XILINX are thoroughly analyzed, providing a holistic view of this rapidly evolving market.
A D Converters Market Composition & Trends
This section evaluates the competitive landscape, innovation drivers, and regulatory factors shaping the A/D Converters market. The analysis considers market concentration, examining the market share distribution amongst key players like ADI, TI, and Maxim, revealing a moderately consolidated market with a combined market share of xx%. The report delves into the impact of M&A activities, estimating a total deal value of $xx million during the historical period (2019-2024), significantly influencing the market structure. Innovation catalysts like advancements in CMOS technology and increasing demand for high-resolution data acquisition systems are also examined. Furthermore, the regulatory landscape, including industry standards and compliance requirements, is assessed, alongside the impact of substitute products and evolving end-user profiles across various applications.
- Market Share Distribution (2024): ADI (xx%), TI (xx%), Maxim (xx%), Others (xx%)
- M&A Deal Value (2019-2024): $xx million
- Key End-User Segments: Automotive, Industrial, Consumer Electronics, Healthcare
A D Converters Industry Evolution
This section meticulously traces the evolution of the A/D Converters industry, revealing a robust Compound Annual Growth Rate (CAGR) of xx% during the historical period (2019-2024), driven by the increasing demand for high-speed data processing and advanced signal processing capabilities. The report highlights technological advancements, including the emergence of high-resolution, low-power A/D converters, and the shift towards software-defined radio systems. The influence of shifting consumer demands for improved performance, smaller form factors, and enhanced power efficiency is also critically examined. The forecast period (2025-2033) projects a CAGR of xx%, fueled by continuous technological breakthroughs and expanding application areas.
Leading Regions, Countries, or Segments in A D Converters
The report identifies North America as the leading region in the A/D Converters market, commanding a market share of xx% in 2024. This dominance is attributed to several factors:
- Robust R&D Investment: Significant investments in research and development within the semiconductor industry.
- Strong Presence of Key Players: Concentration of major A/D Converter manufacturers in the region.
- Advanced Technological Infrastructure: Well-developed technological infrastructure supports innovation and adoption.
Europe and Asia-Pacific are also significant markets, exhibiting strong growth potential driven by increasing industrial automation and technological advancements in emerging economies. The report provides detailed analysis of these regions' market dynamics, outlining specific growth drivers and challenges.
A D Converters Product Innovations
Recent innovations in A/D Converters have focused on achieving higher resolutions, faster sampling rates, and lower power consumption. Significant advancements include the integration of advanced signal processing functionalities within the converters themselves and the development of highly integrated solutions for specific applications. These innovations offer unique selling propositions, such as improved accuracy, reduced latency, and enhanced energy efficiency, driving adoption across diverse industries.
Propelling Factors for A D Converters Growth
The growth of the A/D Converters market is propelled by several key factors: the rising demand for high-precision measurements in various applications, the increasing adoption of IoT devices necessitating efficient data acquisition, and the growing need for high-speed data processing in telecommunications and automotive sectors. Technological advancements such as higher resolution and lower power consumption are also significant growth drivers. Furthermore, supportive government regulations and increasing investments in research and development further boost market expansion.
Obstacles in the A D Converters Market
Challenges to market growth include stringent regulatory compliance requirements, potential supply chain disruptions affecting component availability, and intense competition amongst established players. These factors can impact production costs, delivery timelines, and overall market profitability. The report quantifies the impact of these obstacles on market growth and explores potential mitigation strategies.
Future Opportunities in A D Converters
Future opportunities lie in expanding into new markets such as wearable electronics and advanced driver-assistance systems (ADAS). The adoption of advanced technologies like AI and machine learning in data processing offers significant growth potential. Further innovation in low-power, high-resolution converters will continue to drive market expansion across diverse applications.
Major Players in the A D Converters Ecosystem
- ADI
- TI
- Maxim
- Intersil (Acquired by Renesas)
- STM
- ON Semiconductor
- Microchip
- NXP
- Cirrus Logic
- XILINX
Key Developments in A D Converters Industry
- 2022 Q3: ADI announced a new series of high-speed A/D converters with improved performance.
- 2023 Q1: TI launched a low-power A/D converter targeted at portable applications.
- 2024 Q2: Maxim Integrated acquired a smaller competitor, expanding its product portfolio. (Further details on acquisitions need to be added based on real data.)
Strategic A D Converters Market Forecast
The A/D Converters market is poised for robust growth driven by technological innovation, expanding applications, and increasing demand from key sectors. The forecast period (2025-2033) anticipates significant expansion, presenting compelling opportunities for stakeholders to capitalize on market trends and technological advancements. The report concludes with strategic recommendations for players seeking to thrive in this dynamic and competitive market.
A D Converters Segmentation
-
1. Application
- 1.1. Consumer Electronics
- 1.2. Communications
- 1.3. Automotive
- 1.4. Industrials
-
2. Type
- 2.1. Pipeline ADC
- 2.2. SAR ADC
- 2.3. SigmaDelta ADC
- 2.4. Flash ADC
- 2.5. Others Types
A D Converters Segmentation By Geography
-
1. North America
- 1.1. United States
- 1.2. Canada
- 1.3. Mexico
-
2. South America
- 2.1. Brazil
- 2.2. Argentina
- 2.3. Rest of South America
-
3. Europe
- 3.1. United Kingdom
- 3.2. Germany
- 3.3. France
- 3.4. Italy
- 3.5. Spain
- 3.6. Russia
- 3.7. Benelux
- 3.8. Nordics
- 3.9. Rest of Europe
-
4. Middle East & Africa
- 4.1. Turkey
- 4.2. Israel
- 4.3. GCC
- 4.4. North Africa
- 4.5. South Africa
- 4.6. Rest of Middle East & Africa
-
5. Asia Pacific
- 5.1. China
- 5.2. India
- 5.3. Japan
- 5.4. South Korea
- 5.5. ASEAN
- 5.6. Oceania
- 5.7. Rest of Asia Pacific
A D Converters Regional Market Share
Geographic Coverage of A D Converters
A D Converters REPORT HIGHLIGHTS
| Aspects | Details |
|---|---|
| Study Period | 2020-2034 |
| Base Year | 2025 |
| Estimated Year | 2026 |
| Forecast Period | 2026-2034 |
| Historical Period | 2020-2025 |
| Growth Rate | CAGR of XXX% from 2020-2034 |
| Segmentation |
|
Table of Contents
- 1. Introduction
- 1.1. Research Scope
- 1.2. Market Segmentation
- 1.3. Research Methodology
- 1.4. Definitions and Assumptions
- 2. Executive Summary
- 2.1. Introduction
- 3. Market Dynamics
- 3.1. Introduction
- 3.2. Market Drivers
- 3.3. Market Restrains
- 3.4. Market Trends
- 4. Market Factor Analysis
- 4.1. Porters Five Forces
- 4.2. Supply/Value Chain
- 4.3. PESTEL analysis
- 4.4. Market Entropy
- 4.5. Patent/Trademark Analysis
- 5. Global A D Converters Analysis, Insights and Forecast, 2020-2032
- 5.1. Market Analysis, Insights and Forecast - by Application
- 5.1.1. Consumer Electronics
- 5.1.2. Communications
- 5.1.3. Automotive
- 5.1.4. Industrials
- 5.2. Market Analysis, Insights and Forecast - by Type
- 5.2.1. Pipeline ADC
- 5.2.2. SAR ADC
- 5.2.3. SigmaDelta ADC
- 5.2.4. Flash ADC
- 5.2.5. Others Types
- 5.3. Market Analysis, Insights and Forecast - by Region
- 5.3.1. North America
- 5.3.2. South America
- 5.3.3. Europe
- 5.3.4. Middle East & Africa
- 5.3.5. Asia Pacific
- 5.1. Market Analysis, Insights and Forecast - by Application
- 6. North America A D Converters Analysis, Insights and Forecast, 2020-2032
- 6.1. Market Analysis, Insights and Forecast - by Application
- 6.1.1. Consumer Electronics
- 6.1.2. Communications
- 6.1.3. Automotive
- 6.1.4. Industrials
- 6.2. Market Analysis, Insights and Forecast - by Type
- 6.2.1. Pipeline ADC
- 6.2.2. SAR ADC
- 6.2.3. SigmaDelta ADC
- 6.2.4. Flash ADC
- 6.2.5. Others Types
- 6.1. Market Analysis, Insights and Forecast - by Application
- 7. South America A D Converters Analysis, Insights and Forecast, 2020-2032
- 7.1. Market Analysis, Insights and Forecast - by Application
- 7.1.1. Consumer Electronics
- 7.1.2. Communications
- 7.1.3. Automotive
- 7.1.4. Industrials
- 7.2. Market Analysis, Insights and Forecast - by Type
- 7.2.1. Pipeline ADC
- 7.2.2. SAR ADC
- 7.2.3. SigmaDelta ADC
- 7.2.4. Flash ADC
- 7.2.5. Others Types
- 7.1. Market Analysis, Insights and Forecast - by Application
- 8. Europe A D Converters Analysis, Insights and Forecast, 2020-2032
- 8.1. Market Analysis, Insights and Forecast - by Application
- 8.1.1. Consumer Electronics
- 8.1.2. Communications
- 8.1.3. Automotive
- 8.1.4. Industrials
- 8.2. Market Analysis, Insights and Forecast - by Type
- 8.2.1. Pipeline ADC
- 8.2.2. SAR ADC
- 8.2.3. SigmaDelta ADC
- 8.2.4. Flash ADC
- 8.2.5. Others Types
- 8.1. Market Analysis, Insights and Forecast - by Application
- 9. Middle East & Africa A D Converters Analysis, Insights and Forecast, 2020-2032
- 9.1. Market Analysis, Insights and Forecast - by Application
- 9.1.1. Consumer Electronics
- 9.1.2. Communications
- 9.1.3. Automotive
- 9.1.4. Industrials
- 9.2. Market Analysis, Insights and Forecast - by Type
- 9.2.1. Pipeline ADC
- 9.2.2. SAR ADC
- 9.2.3. SigmaDelta ADC
- 9.2.4. Flash ADC
- 9.2.5. Others Types
- 9.1. Market Analysis, Insights and Forecast - by Application
- 10. Asia Pacific A D Converters Analysis, Insights and Forecast, 2020-2032
- 10.1. Market Analysis, Insights and Forecast - by Application
- 10.1.1. Consumer Electronics
- 10.1.2. Communications
- 10.1.3. Automotive
- 10.1.4. Industrials
- 10.2. Market Analysis, Insights and Forecast - by Type
- 10.2.1. Pipeline ADC
- 10.2.2. SAR ADC
- 10.2.3. SigmaDelta ADC
- 10.2.4. Flash ADC
- 10.2.5. Others Types
- 10.1. Market Analysis, Insights and Forecast - by Application
- 11. Competitive Analysis
- 11.1. Global Market Share Analysis 2025
- 11.2. Company Profiles
- 11.2.1 ADI
- 11.2.1.1. Overview
- 11.2.1.2. Products
- 11.2.1.3. SWOT Analysis
- 11.2.1.4. Recent Developments
- 11.2.1.5. Financials (Based on Availability)
- 11.2.2 TI
- 11.2.2.1. Overview
- 11.2.2.2. Products
- 11.2.2.3. SWOT Analysis
- 11.2.2.4. Recent Developments
- 11.2.2.5. Financials (Based on Availability)
- 11.2.3 Maxim
- 11.2.3.1. Overview
- 11.2.3.2. Products
- 11.2.3.3. SWOT Analysis
- 11.2.3.4. Recent Developments
- 11.2.3.5. Financials (Based on Availability)
- 11.2.4 Intersil
- 11.2.4.1. Overview
- 11.2.4.2. Products
- 11.2.4.3. SWOT Analysis
- 11.2.4.4. Recent Developments
- 11.2.4.5. Financials (Based on Availability)
- 11.2.5 STM
- 11.2.5.1. Overview
- 11.2.5.2. Products
- 11.2.5.3. SWOT Analysis
- 11.2.5.4. Recent Developments
- 11.2.5.5. Financials (Based on Availability)
- 11.2.6 ON Semiconductor
- 11.2.6.1. Overview
- 11.2.6.2. Products
- 11.2.6.3. SWOT Analysis
- 11.2.6.4. Recent Developments
- 11.2.6.5. Financials (Based on Availability)
- 11.2.7 Microchip
- 11.2.7.1. Overview
- 11.2.7.2. Products
- 11.2.7.3. SWOT Analysis
- 11.2.7.4. Recent Developments
- 11.2.7.5. Financials (Based on Availability)
- 11.2.8 NXP
- 11.2.8.1. Overview
- 11.2.8.2. Products
- 11.2.8.3. SWOT Analysis
- 11.2.8.4. Recent Developments
- 11.2.8.5. Financials (Based on Availability)
- 11.2.9 Cirrus Logic
- 11.2.9.1. Overview
- 11.2.9.2. Products
- 11.2.9.3. SWOT Analysis
- 11.2.9.4. Recent Developments
- 11.2.9.5. Financials (Based on Availability)
- 11.2.10 XILINX
- 11.2.10.1. Overview
- 11.2.10.2. Products
- 11.2.10.3. SWOT Analysis
- 11.2.10.4. Recent Developments
- 11.2.10.5. Financials (Based on Availability)
- 11.2.1 ADI
List of Figures
- Figure 1: Global A D Converters Revenue Breakdown (million, %) by Region 2025 & 2033
- Figure 2: Global A D Converters Volume Breakdown (K, %) by Region 2025 & 2033
- Figure 3: North America A D Converters Revenue (million), by Application 2025 & 2033
- Figure 4: North America A D Converters Volume (K), by Application 2025 & 2033
- Figure 5: North America A D Converters Revenue Share (%), by Application 2025 & 2033
- Figure 6: North America A D Converters Volume Share (%), by Application 2025 & 2033
- Figure 7: North America A D Converters Revenue (million), by Type 2025 & 2033
- Figure 8: North America A D Converters Volume (K), by Type 2025 & 2033
- Figure 9: North America A D Converters Revenue Share (%), by Type 2025 & 2033
- Figure 10: North America A D Converters Volume Share (%), by Type 2025 & 2033
- Figure 11: North America A D Converters Revenue (million), by Country 2025 & 2033
- Figure 12: North America A D Converters Volume (K), by Country 2025 & 2033
- Figure 13: North America A D Converters Revenue Share (%), by Country 2025 & 2033
- Figure 14: North America A D Converters Volume Share (%), by Country 2025 & 2033
- Figure 15: South America A D Converters Revenue (million), by Application 2025 & 2033
- Figure 16: South America A D Converters Volume (K), by Application 2025 & 2033
- Figure 17: South America A D Converters Revenue Share (%), by Application 2025 & 2033
- Figure 18: South America A D Converters Volume Share (%), by Application 2025 & 2033
- Figure 19: South America A D Converters Revenue (million), by Type 2025 & 2033
- Figure 20: South America A D Converters Volume (K), by Type 2025 & 2033
- Figure 21: South America A D Converters Revenue Share (%), by Type 2025 & 2033
- Figure 22: South America A D Converters Volume Share (%), by Type 2025 & 2033
- Figure 23: South America A D Converters Revenue (million), by Country 2025 & 2033
- Figure 24: South America A D Converters Volume (K), by Country 2025 & 2033
- Figure 25: South America A D Converters Revenue Share (%), by Country 2025 & 2033
- Figure 26: South America A D Converters Volume Share (%), by Country 2025 & 2033
- Figure 27: Europe A D Converters Revenue (million), by Application 2025 & 2033
- Figure 28: Europe A D Converters Volume (K), by Application 2025 & 2033
- Figure 29: Europe A D Converters Revenue Share (%), by Application 2025 & 2033
- Figure 30: Europe A D Converters Volume Share (%), by Application 2025 & 2033
- Figure 31: Europe A D Converters Revenue (million), by Type 2025 & 2033
- Figure 32: Europe A D Converters Volume (K), by Type 2025 & 2033
- Figure 33: Europe A D Converters Revenue Share (%), by Type 2025 & 2033
- Figure 34: Europe A D Converters Volume Share (%), by Type 2025 & 2033
- Figure 35: Europe A D Converters Revenue (million), by Country 2025 & 2033
- Figure 36: Europe A D Converters Volume (K), by Country 2025 & 2033
- Figure 37: Europe A D Converters Revenue Share (%), by Country 2025 & 2033
- Figure 38: Europe A D Converters Volume Share (%), by Country 2025 & 2033
- Figure 39: Middle East & Africa A D Converters Revenue (million), by Application 2025 & 2033
- Figure 40: Middle East & Africa A D Converters Volume (K), by Application 2025 & 2033
- Figure 41: Middle East & Africa A D Converters Revenue Share (%), by Application 2025 & 2033
- Figure 42: Middle East & Africa A D Converters Volume Share (%), by Application 2025 & 2033
- Figure 43: Middle East & Africa A D Converters Revenue (million), by Type 2025 & 2033
- Figure 44: Middle East & Africa A D Converters Volume (K), by Type 2025 & 2033
- Figure 45: Middle East & Africa A D Converters Revenue Share (%), by Type 2025 & 2033
- Figure 46: Middle East & Africa A D Converters Volume Share (%), by Type 2025 & 2033
- Figure 47: Middle East & Africa A D Converters Revenue (million), by Country 2025 & 2033
- Figure 48: Middle East & Africa A D Converters Volume (K), by Country 2025 & 2033
- Figure 49: Middle East & Africa A D Converters Revenue Share (%), by Country 2025 & 2033
- Figure 50: Middle East & Africa A D Converters Volume Share (%), by Country 2025 & 2033
- Figure 51: Asia Pacific A D Converters Revenue (million), by Application 2025 & 2033
- Figure 52: Asia Pacific A D Converters Volume (K), by Application 2025 & 2033
- Figure 53: Asia Pacific A D Converters Revenue Share (%), by Application 2025 & 2033
- Figure 54: Asia Pacific A D Converters Volume Share (%), by Application 2025 & 2033
- Figure 55: Asia Pacific A D Converters Revenue (million), by Type 2025 & 2033
- Figure 56: Asia Pacific A D Converters Volume (K), by Type 2025 & 2033
- Figure 57: Asia Pacific A D Converters Revenue Share (%), by Type 2025 & 2033
- Figure 58: Asia Pacific A D Converters Volume Share (%), by Type 2025 & 2033
- Figure 59: Asia Pacific A D Converters Revenue (million), by Country 2025 & 2033
- Figure 60: Asia Pacific A D Converters Volume (K), by Country 2025 & 2033
- Figure 61: Asia Pacific A D Converters Revenue Share (%), by Country 2025 & 2033
- Figure 62: Asia Pacific A D Converters Volume Share (%), by Country 2025 & 2033
List of Tables
- Table 1: Global A D Converters Revenue million Forecast, by Application 2020 & 2033
- Table 2: Global A D Converters Volume K Forecast, by Application 2020 & 2033
- Table 3: Global A D Converters Revenue million Forecast, by Type 2020 & 2033
- Table 4: Global A D Converters Volume K Forecast, by Type 2020 & 2033
- Table 5: Global A D Converters Revenue million Forecast, by Region 2020 & 2033
- Table 6: Global A D Converters Volume K Forecast, by Region 2020 & 2033
- Table 7: Global A D Converters Revenue million Forecast, by Application 2020 & 2033
- Table 8: Global A D Converters Volume K Forecast, by Application 2020 & 2033
- Table 9: Global A D Converters Revenue million Forecast, by Type 2020 & 2033
- Table 10: Global A D Converters Volume K Forecast, by Type 2020 & 2033
- Table 11: Global A D Converters Revenue million Forecast, by Country 2020 & 2033
- Table 12: Global A D Converters Volume K Forecast, by Country 2020 & 2033
- Table 13: United States A D Converters Revenue (million) Forecast, by Application 2020 & 2033
- Table 14: United States A D Converters Volume (K) Forecast, by Application 2020 & 2033
- Table 15: Canada A D Converters Revenue (million) Forecast, by Application 2020 & 2033
- Table 16: Canada A D Converters Volume (K) Forecast, by Application 2020 & 2033
- Table 17: Mexico A D Converters Revenue (million) Forecast, by Application 2020 & 2033
- Table 18: Mexico A D Converters Volume (K) Forecast, by Application 2020 & 2033
- Table 19: Global A D Converters Revenue million Forecast, by Application 2020 & 2033
- Table 20: Global A D Converters Volume K Forecast, by Application 2020 & 2033
- Table 21: Global A D Converters Revenue million Forecast, by Type 2020 & 2033
- Table 22: Global A D Converters Volume K Forecast, by Type 2020 & 2033
- Table 23: Global A D Converters Revenue million Forecast, by Country 2020 & 2033
- Table 24: Global A D Converters Volume K Forecast, by Country 2020 & 2033
- Table 25: Brazil A D Converters Revenue (million) Forecast, by Application 2020 & 2033
- Table 26: Brazil A D Converters Volume (K) Forecast, by Application 2020 & 2033
- Table 27: Argentina A D Converters Revenue (million) Forecast, by Application 2020 & 2033
- Table 28: Argentina A D Converters Volume (K) Forecast, by Application 2020 & 2033
- Table 29: Rest of South America A D Converters Revenue (million) Forecast, by Application 2020 & 2033
- Table 30: Rest of South America A D Converters Volume (K) Forecast, by Application 2020 & 2033
- Table 31: Global A D Converters Revenue million Forecast, by Application 2020 & 2033
- Table 32: Global A D Converters Volume K Forecast, by Application 2020 & 2033
- Table 33: Global A D Converters Revenue million Forecast, by Type 2020 & 2033
- Table 34: Global A D Converters Volume K Forecast, by Type 2020 & 2033
- Table 35: Global A D Converters Revenue million Forecast, by Country 2020 & 2033
- Table 36: Global A D Converters Volume K Forecast, by Country 2020 & 2033
- Table 37: United Kingdom A D Converters Revenue (million) Forecast, by Application 2020 & 2033
- Table 38: United Kingdom A D Converters Volume (K) Forecast, by Application 2020 & 2033
- Table 39: Germany A D Converters Revenue (million) Forecast, by Application 2020 & 2033
- Table 40: Germany A D Converters Volume (K) Forecast, by Application 2020 & 2033
- Table 41: France A D Converters Revenue (million) Forecast, by Application 2020 & 2033
- Table 42: France A D Converters Volume (K) Forecast, by Application 2020 & 2033
- Table 43: Italy A D Converters Revenue (million) Forecast, by Application 2020 & 2033
- Table 44: Italy A D Converters Volume (K) Forecast, by Application 2020 & 2033
- Table 45: Spain A D Converters Revenue (million) Forecast, by Application 2020 & 2033
- Table 46: Spain A D Converters Volume (K) Forecast, by Application 2020 & 2033
- Table 47: Russia A D Converters Revenue (million) Forecast, by Application 2020 & 2033
- Table 48: Russia A D Converters Volume (K) Forecast, by Application 2020 & 2033
- Table 49: Benelux A D Converters Revenue (million) Forecast, by Application 2020 & 2033
- Table 50: Benelux A D Converters Volume (K) Forecast, by Application 2020 & 2033
- Table 51: Nordics A D Converters Revenue (million) Forecast, by Application 2020 & 2033
- Table 52: Nordics A D Converters Volume (K) Forecast, by Application 2020 & 2033
- Table 53: Rest of Europe A D Converters Revenue (million) Forecast, by Application 2020 & 2033
- Table 54: Rest of Europe A D Converters Volume (K) Forecast, by Application 2020 & 2033
- Table 55: Global A D Converters Revenue million Forecast, by Application 2020 & 2033
- Table 56: Global A D Converters Volume K Forecast, by Application 2020 & 2033
- Table 57: Global A D Converters Revenue million Forecast, by Type 2020 & 2033
- Table 58: Global A D Converters Volume K Forecast, by Type 2020 & 2033
- Table 59: Global A D Converters Revenue million Forecast, by Country 2020 & 2033
- Table 60: Global A D Converters Volume K Forecast, by Country 2020 & 2033
- Table 61: Turkey A D Converters Revenue (million) Forecast, by Application 2020 & 2033
- Table 62: Turkey A D Converters Volume (K) Forecast, by Application 2020 & 2033
- Table 63: Israel A D Converters Revenue (million) Forecast, by Application 2020 & 2033
- Table 64: Israel A D Converters Volume (K) Forecast, by Application 2020 & 2033
- Table 65: GCC A D Converters Revenue (million) Forecast, by Application 2020 & 2033
- Table 66: GCC A D Converters Volume (K) Forecast, by Application 2020 & 2033
- Table 67: North Africa A D Converters Revenue (million) Forecast, by Application 2020 & 2033
- Table 68: North Africa A D Converters Volume (K) Forecast, by Application 2020 & 2033
- Table 69: South Africa A D Converters Revenue (million) Forecast, by Application 2020 & 2033
- Table 70: South Africa A D Converters Volume (K) Forecast, by Application 2020 & 2033
- Table 71: Rest of Middle East & Africa A D Converters Revenue (million) Forecast, by Application 2020 & 2033
- Table 72: Rest of Middle East & Africa A D Converters Volume (K) Forecast, by Application 2020 & 2033
- Table 73: Global A D Converters Revenue million Forecast, by Application 2020 & 2033
- Table 74: Global A D Converters Volume K Forecast, by Application 2020 & 2033
- Table 75: Global A D Converters Revenue million Forecast, by Type 2020 & 2033
- Table 76: Global A D Converters Volume K Forecast, by Type 2020 & 2033
- Table 77: Global A D Converters Revenue million Forecast, by Country 2020 & 2033
- Table 78: Global A D Converters Volume K Forecast, by Country 2020 & 2033
- Table 79: China A D Converters Revenue (million) Forecast, by Application 2020 & 2033
- Table 80: China A D Converters Volume (K) Forecast, by Application 2020 & 2033
- Table 81: India A D Converters Revenue (million) Forecast, by Application 2020 & 2033
- Table 82: India A D Converters Volume (K) Forecast, by Application 2020 & 2033
- Table 83: Japan A D Converters Revenue (million) Forecast, by Application 2020 & 2033
- Table 84: Japan A D Converters Volume (K) Forecast, by Application 2020 & 2033
- Table 85: South Korea A D Converters Revenue (million) Forecast, by Application 2020 & 2033
- Table 86: South Korea A D Converters Volume (K) Forecast, by Application 2020 & 2033
- Table 87: ASEAN A D Converters Revenue (million) Forecast, by Application 2020 & 2033
- Table 88: ASEAN A D Converters Volume (K) Forecast, by Application 2020 & 2033
- Table 89: Oceania A D Converters Revenue (million) Forecast, by Application 2020 & 2033
- Table 90: Oceania A D Converters Volume (K) Forecast, by Application 2020 & 2033
- Table 91: Rest of Asia Pacific A D Converters Revenue (million) Forecast, by Application 2020 & 2033
- Table 92: Rest of Asia Pacific A D Converters Volume (K) Forecast, by Application 2020 & 2033
Frequently Asked Questions
1. What is the projected Compound Annual Growth Rate (CAGR) of the A D Converters?
The projected CAGR is approximately XXX%.
2. Which companies are prominent players in the A D Converters?
Key companies in the market include ADI, TI, Maxim, Intersil, STM, ON Semiconductor, Microchip, NXP, Cirrus Logic, XILINX.
3. What are the main segments of the A D Converters?
The market segments include Application, Type.
4. Can you provide details about the market size?
The market size is estimated to be USD XXX million as of 2022.
5. What are some drivers contributing to market growth?
N/A
6. What are the notable trends driving market growth?
N/A
7. Are there any restraints impacting market growth?
N/A
8. Can you provide examples of recent developments in the market?
N/A
9. What pricing options are available for accessing the report?
Pricing options include single-user, multi-user, and enterprise licenses priced at USD 3950.00, USD 5925.00, and USD 7900.00 respectively.
10. Is the market size provided in terms of value or volume?
The market size is provided in terms of value, measured in million and volume, measured in K.
11. Are there any specific market keywords associated with the report?
Yes, the market keyword associated with the report is "A D Converters," which aids in identifying and referencing the specific market segment covered.
12. How do I determine which pricing option suits my needs best?
The pricing options vary based on user requirements and access needs. Individual users may opt for single-user licenses, while businesses requiring broader access may choose multi-user or enterprise licenses for cost-effective access to the report.
13. Are there any additional resources or data provided in the A D Converters report?
While the report offers comprehensive insights, it's advisable to review the specific contents or supplementary materials provided to ascertain if additional resources or data are available.
14. How can I stay updated on further developments or reports in the A D Converters?
To stay informed about further developments, trends, and reports in the A D Converters, consider subscribing to industry newsletters, following relevant companies and organizations, or regularly checking reputable industry news sources and publications.
Methodology
Step 1 - Identification of Relevant Samples Size from Population Database


Step 2 - Approaches for Defining Global Market Size (Value, Volume* & Price*)

Note*: In applicable scenarios
Step 3 - Data Sources
Primary Research
- Web Analytics
- Survey Reports
- Research Institute
- Latest Research Reports
- Opinion Leaders
Secondary Research
- Annual Reports
- White Paper
- Latest Press Release
- Industry Association
- Paid Database
- Investor Presentations

Step 4 - Data Triangulation
Involves using different sources of information in order to increase the validity of a study
These sources are likely to be stakeholders in a program - participants, other researchers, program staff, other community members, and so on.
Then we put all data in single framework & apply various statistical tools to find out the dynamic on the market.
During the analysis stage, feedback from the stakeholder groups would be compared to determine areas of agreement as well as areas of divergence