

Key Insights
The proton therapy market, while currently niche, is experiencing robust growth driven by advancements in technology, increasing cancer incidence rates, and the demonstrable advantages of proton therapy over traditional radiation therapies. The precision of proton therapy minimizes damage to healthy tissues, leading to fewer side effects and improved patient outcomes, particularly crucial for treating cancers near critical organs. This enhanced efficacy is driving increased adoption among healthcare providers, despite the high initial investment cost associated with proton therapy equipment. The market is segmented by technology (e.g., pencil beam scanning, rotating gantry), application (e.g., prostate, lung, pediatric cancers), and geography. Major players like IBA, Varian (now part of Siemens Healthineers), Hitachi, Mevion, Sumitomo, and ProNova are actively engaged in developing innovative technologies and expanding their global footprint to meet the rising demand. The historical period (2019-2024) likely saw a CAGR in the low-to-mid-teens, reflecting a gradual market penetration. However, the forecast period (2025-2033) projects a potentially higher CAGR, driven by factors such as technological advancements reducing the cost of treatment, increased awareness among both healthcare professionals and patients, and favorable reimbursement policies in key markets. This accelerated growth will likely be most prominent in regions with robust healthcare infrastructure and high cancer prevalence.
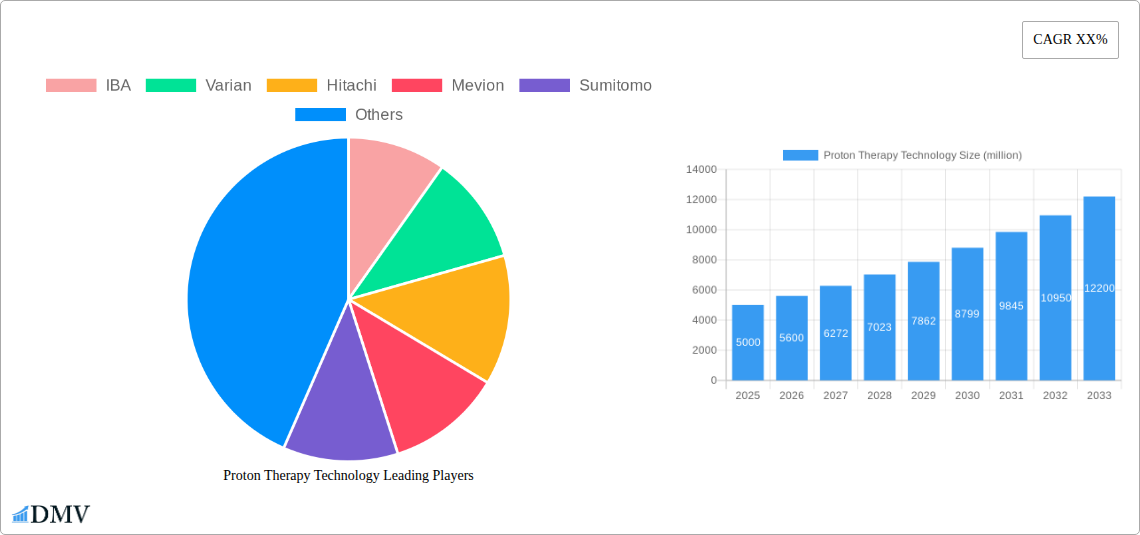
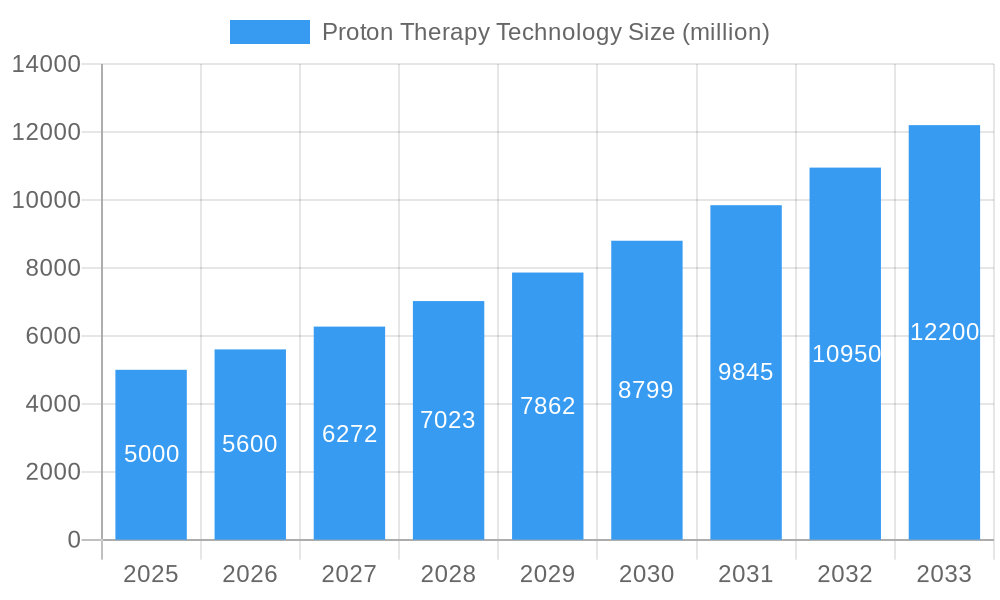
Proton Therapy Technology Market Size (In Billion)
Despite its promising growth trajectory, the market faces some restraints. The high capital expenditure required for installing and maintaining proton therapy centers remains a significant barrier to entry for many healthcare facilities, particularly in developing nations. Competition among established players is also intensifying, leading to price pressures. Regulatory hurdles and the need for skilled personnel to operate and maintain these sophisticated systems also present challenges. However, ongoing technological innovations, coupled with potential cost reductions through economies of scale and improved treatment efficiency, are expected to mitigate these restraints and support continued market expansion throughout the forecast period. The market's overall trajectory suggests strong long-term growth potential, with significant opportunities for innovation and market expansion in both established and emerging markets.
Proton Therapy Technology Company Market Share
This comprehensive report provides a detailed analysis of the global Proton Therapy Technology market, projecting a market valuation exceeding $XX million by 2033. The study period covers 2019-2033, with 2025 serving as both the base and estimated year. This in-depth analysis covers market composition, technological advancements, leading players (including IBA, Varian, Hitachi, Mevion, Sumitomo, and ProNova), and future growth prospects. It's an essential resource for stakeholders seeking to understand this rapidly evolving sector.
Proton Therapy Technology Market Composition & Trends
The Proton Therapy Technology market exhibits a moderately concentrated landscape, with key players like IBA, Varian, and Hitachi holding significant market share. The exact distribution in 2025 is estimated at: IBA (XX%), Varian (XX%), Hitachi (XX%), Mevion (XX%), Sumitomo (XX%), and ProNova (XX%). Innovation is driven by advancements in beam delivery systems, image guidance, and treatment planning software, constantly pushing the boundaries of precision and efficacy. Stringent regulatory approvals (e.g., FDA, EMA) shape market entry and product approvals, while the high cost of equipment and treatment presents a barrier to entry for smaller players. Substitute therapies like intensity-modulated radiotherapy (IMRT) and other advanced radiation techniques exert competitive pressure. End-users primarily comprise hospitals, cancer centers, and specialized clinics catering to a growing population of cancer patients. The market has witnessed several significant M&A activities in recent years, with deal values totaling over $XX million in the historical period (2019-2024), predominantly focused on consolidating technology and expanding geographical reach.
- Market Share Distribution (2025): IBA (XX%), Varian (XX%), Hitachi (XX%), Mevion (XX%), Sumitomo (XX%), ProNova (XX%)
- M&A Activity (2019-2024): Total deal value exceeding $XX million.
- Key Market Drivers: Technological advancements, increasing cancer incidence, and favorable regulatory support.
- Key Challenges: High cost of treatment, stringent regulations, and competition from alternative therapies.
Proton Therapy Technology Industry Evolution
The Proton Therapy Technology market has experienced significant growth from 2019 to 2024, with a Compound Annual Growth Rate (CAGR) of XX%. This trajectory is projected to continue throughout the forecast period (2025-2033), with a predicted CAGR of XX%, driven by factors such as technological advancements (e.g., pencil beam scanning, FLASH therapy), increasing awareness of proton therapy's advantages, and expanding global healthcare expenditure. Consumer demand is shifting towards more precise and less invasive treatment options, which aligns perfectly with the capabilities of proton therapy. Adoption metrics show a steady increase in the number of proton therapy centers globally, with a projected XX% increase in installed base from 2025 to 2033. Technological advancements have led to smaller, more compact systems, reducing the overall infrastructure costs and making proton therapy more accessible to a wider range of healthcare providers. These innovations have also enhanced treatment accuracy, reduced side effects, and improved overall patient outcomes.
Leading Regions, Countries, or Segments in Proton Therapy Technology
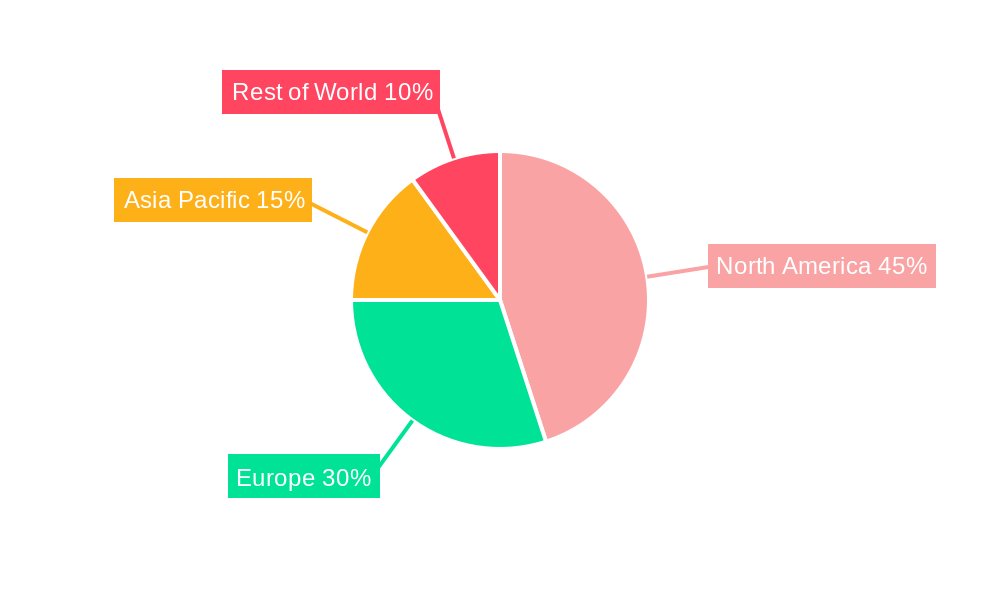
The North American market currently dominates the global Proton Therapy Technology landscape, fueled by high healthcare expenditure, robust research infrastructure, early adoption of advanced technologies, and a significant number of cancer diagnoses.
- Key Drivers in North America:
- High healthcare spending
- Strong regulatory support and reimbursement policies
- Significant R&D investments
- High prevalence of cancer
- Other Regions: While North America leads, Europe and Asia-Pacific are also exhibiting substantial growth, driven by increasing awareness, rising disposable incomes, and expanding healthcare infrastructure. However, market penetration remains lower in these regions compared to North America.
The dominance of North America is largely attributed to the early adoption of proton therapy and the presence of major market players with established distribution networks. Strong regulatory frameworks and favorable reimbursement policies further contribute to the high market penetration. However, the growth potential in other regions is significant, given the increasing incidence of cancer and growing demand for advanced treatment options.
Proton Therapy Technology Product Innovations
Recent innovations in proton therapy have focused on improving treatment efficiency and precision. Pencil beam scanning (PBS) technology delivers highly conformal doses, minimizing damage to surrounding healthy tissue. FLASH therapy, a revolutionary approach, delivers extremely high doses in ultra-short bursts, potentially improving treatment outcomes and reducing side effects. Advancements in imaging technologies, such as MR-Linac integration, enable real-time monitoring and precise targeting during treatment. These innovations, alongside the development of more compact and cost-effective systems, are making proton therapy more accessible and attractive to a wider range of healthcare providers and patients.
Propelling Factors for Proton Therapy Technology Growth
Several factors are driving the growth of the Proton Therapy Technology market. The increasing incidence of cancer globally is a primary driver, creating a greater need for effective cancer treatment options. Technological advancements leading to more precise and efficient treatments, alongside a reduction in side effects, are also significant factors. Furthermore, growing healthcare expenditure and favorable regulatory support in key markets are fueling the adoption of proton therapy. These factors combined contribute to a significant market opportunity for companies operating in this field.
Obstacles in the Proton Therapy Technology Market
Despite the significant growth potential, several challenges impede the widespread adoption of proton therapy. The high cost of equipment and treatment is a major obstacle, limiting accessibility for many healthcare providers and patients. Stringent regulatory approval processes can delay market entry and increase costs for manufacturers. The complex supply chain and specialized expertise required for operation and maintenance pose additional challenges. Furthermore, competition from other advanced radiation therapies creates significant market pressures. These factors combined significantly impact market growth and penetration.
Future Opportunities in Proton Therapy Technology
The future of proton therapy holds significant promise. Expanding into emerging markets with growing healthcare sectors presents substantial opportunities for growth. Continued technological innovation, including the development of more compact and cost-effective systems, will further increase accessibility. Exploration of new clinical applications, such as treating less common cancers, and integration with other treatment modalities will further expand the market. Additionally, new business models like treatment centers with shared resources, can improve access.
Key Developments in Proton Therapy Technology Industry
- 2023: IBA launched a new generation of proton therapy system.
- 2022: Varian announced a strategic partnership to expand its global reach.
- 2021: Mevion secured significant funding to accelerate product development.
- (Add further key developments with year/month as data becomes available)
Strategic Proton Therapy Technology Market Forecast
The Proton Therapy Technology market is poised for continued growth, driven by technological advancements, increasing cancer incidence, and expanding healthcare infrastructure. The focus on improving treatment precision, reducing side effects, and developing more accessible systems will propel market expansion. The emergence of new clinical applications and expansion into untapped markets will further contribute to the significant growth potential of this dynamic sector. The market is expected to witness substantial growth over the forecast period, reaching a projected value exceeding $XX million by 2033.
Proton Therapy Technology Segmentation
-
1. Application
- 1.1. Hospital
- 1.2. Proton Treatment Center
-
2. Types
- 2.1. Synchrotron Therapy Technology
- 2.2. Cyclotron Therapy Technology
Proton Therapy Technology Segmentation By Geography
-
1. North America
- 1.1. United States
- 1.2. Canada
- 1.3. Mexico
-
2. South America
- 2.1. Brazil
- 2.2. Argentina
- 2.3. Rest of South America
-
3. Europe
- 3.1. United Kingdom
- 3.2. Germany
- 3.3. France
- 3.4. Italy
- 3.5. Spain
- 3.6. Russia
- 3.7. Benelux
- 3.8. Nordics
- 3.9. Rest of Europe
-
4. Middle East & Africa
- 4.1. Turkey
- 4.2. Israel
- 4.3. GCC
- 4.4. North Africa
- 4.5. South Africa
- 4.6. Rest of Middle East & Africa
-
5. Asia Pacific
- 5.1. China
- 5.2. India
- 5.3. Japan
- 5.4. South Korea
- 5.5. ASEAN
- 5.6. Oceania
- 5.7. Rest of Asia Pacific
Proton Therapy Technology Regional Market Share
Geographic Coverage of Proton Therapy Technology
Proton Therapy Technology REPORT HIGHLIGHTS
| Aspects | Details |
|---|---|
| Study Period | 2020-2034 |
| Base Year | 2025 |
| Estimated Year | 2026 |
| Forecast Period | 2026-2034 |
| Historical Period | 2020-2025 |
| Growth Rate | CAGR of 15.3% from 2020-2034 |
| Segmentation |
|
Table of Contents
- 1. Introduction
- 1.1. Research Scope
- 1.2. Market Segmentation
- 1.3. Research Methodology
- 1.4. Definitions and Assumptions
- 2. Executive Summary
- 2.1. Introduction
- 3. Market Dynamics
- 3.1. Introduction
- 3.2. Market Drivers
- 3.3. Market Restrains
- 3.4. Market Trends
- 4. Market Factor Analysis
- 4.1. Porters Five Forces
- 4.2. Supply/Value Chain
- 4.3. PESTEL analysis
- 4.4. Market Entropy
- 4.5. Patent/Trademark Analysis
- 5. Global Proton Therapy Technology Analysis, Insights and Forecast, 2020-2032
- 5.1. Market Analysis, Insights and Forecast - by Application
- 5.1.1. Hospital
- 5.1.2. Proton Treatment Center
- 5.2. Market Analysis, Insights and Forecast - by Types
- 5.2.1. Synchrotron Therapy Technology
- 5.2.2. Cyclotron Therapy Technology
- 5.3. Market Analysis, Insights and Forecast - by Region
- 5.3.1. North America
- 5.3.2. South America
- 5.3.3. Europe
- 5.3.4. Middle East & Africa
- 5.3.5. Asia Pacific
- 5.1. Market Analysis, Insights and Forecast - by Application
- 6. North America Proton Therapy Technology Analysis, Insights and Forecast, 2020-2032
- 6.1. Market Analysis, Insights and Forecast - by Application
- 6.1.1. Hospital
- 6.1.2. Proton Treatment Center
- 6.2. Market Analysis, Insights and Forecast - by Types
- 6.2.1. Synchrotron Therapy Technology
- 6.2.2. Cyclotron Therapy Technology
- 6.1. Market Analysis, Insights and Forecast - by Application
- 7. South America Proton Therapy Technology Analysis, Insights and Forecast, 2020-2032
- 7.1. Market Analysis, Insights and Forecast - by Application
- 7.1.1. Hospital
- 7.1.2. Proton Treatment Center
- 7.2. Market Analysis, Insights and Forecast - by Types
- 7.2.1. Synchrotron Therapy Technology
- 7.2.2. Cyclotron Therapy Technology
- 7.1. Market Analysis, Insights and Forecast - by Application
- 8. Europe Proton Therapy Technology Analysis, Insights and Forecast, 2020-2032
- 8.1. Market Analysis, Insights and Forecast - by Application
- 8.1.1. Hospital
- 8.1.2. Proton Treatment Center
- 8.2. Market Analysis, Insights and Forecast - by Types
- 8.2.1. Synchrotron Therapy Technology
- 8.2.2. Cyclotron Therapy Technology
- 8.1. Market Analysis, Insights and Forecast - by Application
- 9. Middle East & Africa Proton Therapy Technology Analysis, Insights and Forecast, 2020-2032
- 9.1. Market Analysis, Insights and Forecast - by Application
- 9.1.1. Hospital
- 9.1.2. Proton Treatment Center
- 9.2. Market Analysis, Insights and Forecast - by Types
- 9.2.1. Synchrotron Therapy Technology
- 9.2.2. Cyclotron Therapy Technology
- 9.1. Market Analysis, Insights and Forecast - by Application
- 10. Asia Pacific Proton Therapy Technology Analysis, Insights and Forecast, 2020-2032
- 10.1. Market Analysis, Insights and Forecast - by Application
- 10.1.1. Hospital
- 10.1.2. Proton Treatment Center
- 10.2. Market Analysis, Insights and Forecast - by Types
- 10.2.1. Synchrotron Therapy Technology
- 10.2.2. Cyclotron Therapy Technology
- 10.1. Market Analysis, Insights and Forecast - by Application
- 11. Competitive Analysis
- 11.1. Global Market Share Analysis 2025
- 11.2. Company Profiles
- 11.2.1 IBA
- 11.2.1.1. Overview
- 11.2.1.2. Products
- 11.2.1.3. SWOT Analysis
- 11.2.1.4. Recent Developments
- 11.2.1.5. Financials (Based on Availability)
- 11.2.2 Varian
- 11.2.2.1. Overview
- 11.2.2.2. Products
- 11.2.2.3. SWOT Analysis
- 11.2.2.4. Recent Developments
- 11.2.2.5. Financials (Based on Availability)
- 11.2.3 Hitachi
- 11.2.3.1. Overview
- 11.2.3.2. Products
- 11.2.3.3. SWOT Analysis
- 11.2.3.4. Recent Developments
- 11.2.3.5. Financials (Based on Availability)
- 11.2.4 Mevion
- 11.2.4.1. Overview
- 11.2.4.2. Products
- 11.2.4.3. SWOT Analysis
- 11.2.4.4. Recent Developments
- 11.2.4.5. Financials (Based on Availability)
- 11.2.5 Sumitomo
- 11.2.5.1. Overview
- 11.2.5.2. Products
- 11.2.5.3. SWOT Analysis
- 11.2.5.4. Recent Developments
- 11.2.5.5. Financials (Based on Availability)
- 11.2.6 ProNova
- 11.2.6.1. Overview
- 11.2.6.2. Products
- 11.2.6.3. SWOT Analysis
- 11.2.6.4. Recent Developments
- 11.2.6.5. Financials (Based on Availability)
- 11.2.1 IBA
List of Figures
- Figure 1: Global Proton Therapy Technology Revenue Breakdown (undefined, %) by Region 2025 & 2033
- Figure 2: North America Proton Therapy Technology Revenue (undefined), by Application 2025 & 2033
- Figure 3: North America Proton Therapy Technology Revenue Share (%), by Application 2025 & 2033
- Figure 4: North America Proton Therapy Technology Revenue (undefined), by Types 2025 & 2033
- Figure 5: North America Proton Therapy Technology Revenue Share (%), by Types 2025 & 2033
- Figure 6: North America Proton Therapy Technology Revenue (undefined), by Country 2025 & 2033
- Figure 7: North America Proton Therapy Technology Revenue Share (%), by Country 2025 & 2033
- Figure 8: South America Proton Therapy Technology Revenue (undefined), by Application 2025 & 2033
- Figure 9: South America Proton Therapy Technology Revenue Share (%), by Application 2025 & 2033
- Figure 10: South America Proton Therapy Technology Revenue (undefined), by Types 2025 & 2033
- Figure 11: South America Proton Therapy Technology Revenue Share (%), by Types 2025 & 2033
- Figure 12: South America Proton Therapy Technology Revenue (undefined), by Country 2025 & 2033
- Figure 13: South America Proton Therapy Technology Revenue Share (%), by Country 2025 & 2033
- Figure 14: Europe Proton Therapy Technology Revenue (undefined), by Application 2025 & 2033
- Figure 15: Europe Proton Therapy Technology Revenue Share (%), by Application 2025 & 2033
- Figure 16: Europe Proton Therapy Technology Revenue (undefined), by Types 2025 & 2033
- Figure 17: Europe Proton Therapy Technology Revenue Share (%), by Types 2025 & 2033
- Figure 18: Europe Proton Therapy Technology Revenue (undefined), by Country 2025 & 2033
- Figure 19: Europe Proton Therapy Technology Revenue Share (%), by Country 2025 & 2033
- Figure 20: Middle East & Africa Proton Therapy Technology Revenue (undefined), by Application 2025 & 2033
- Figure 21: Middle East & Africa Proton Therapy Technology Revenue Share (%), by Application 2025 & 2033
- Figure 22: Middle East & Africa Proton Therapy Technology Revenue (undefined), by Types 2025 & 2033
- Figure 23: Middle East & Africa Proton Therapy Technology Revenue Share (%), by Types 2025 & 2033
- Figure 24: Middle East & Africa Proton Therapy Technology Revenue (undefined), by Country 2025 & 2033
- Figure 25: Middle East & Africa Proton Therapy Technology Revenue Share (%), by Country 2025 & 2033
- Figure 26: Asia Pacific Proton Therapy Technology Revenue (undefined), by Application 2025 & 2033
- Figure 27: Asia Pacific Proton Therapy Technology Revenue Share (%), by Application 2025 & 2033
- Figure 28: Asia Pacific Proton Therapy Technology Revenue (undefined), by Types 2025 & 2033
- Figure 29: Asia Pacific Proton Therapy Technology Revenue Share (%), by Types 2025 & 2033
- Figure 30: Asia Pacific Proton Therapy Technology Revenue (undefined), by Country 2025 & 2033
- Figure 31: Asia Pacific Proton Therapy Technology Revenue Share (%), by Country 2025 & 2033
List of Tables
- Table 1: Global Proton Therapy Technology Revenue undefined Forecast, by Application 2020 & 2033
- Table 2: Global Proton Therapy Technology Revenue undefined Forecast, by Types 2020 & 2033
- Table 3: Global Proton Therapy Technology Revenue undefined Forecast, by Region 2020 & 2033
- Table 4: Global Proton Therapy Technology Revenue undefined Forecast, by Application 2020 & 2033
- Table 5: Global Proton Therapy Technology Revenue undefined Forecast, by Types 2020 & 2033
- Table 6: Global Proton Therapy Technology Revenue undefined Forecast, by Country 2020 & 2033
- Table 7: United States Proton Therapy Technology Revenue (undefined) Forecast, by Application 2020 & 2033
- Table 8: Canada Proton Therapy Technology Revenue (undefined) Forecast, by Application 2020 & 2033
- Table 9: Mexico Proton Therapy Technology Revenue (undefined) Forecast, by Application 2020 & 2033
- Table 10: Global Proton Therapy Technology Revenue undefined Forecast, by Application 2020 & 2033
- Table 11: Global Proton Therapy Technology Revenue undefined Forecast, by Types 2020 & 2033
- Table 12: Global Proton Therapy Technology Revenue undefined Forecast, by Country 2020 & 2033
- Table 13: Brazil Proton Therapy Technology Revenue (undefined) Forecast, by Application 2020 & 2033
- Table 14: Argentina Proton Therapy Technology Revenue (undefined) Forecast, by Application 2020 & 2033
- Table 15: Rest of South America Proton Therapy Technology Revenue (undefined) Forecast, by Application 2020 & 2033
- Table 16: Global Proton Therapy Technology Revenue undefined Forecast, by Application 2020 & 2033
- Table 17: Global Proton Therapy Technology Revenue undefined Forecast, by Types 2020 & 2033
- Table 18: Global Proton Therapy Technology Revenue undefined Forecast, by Country 2020 & 2033
- Table 19: United Kingdom Proton Therapy Technology Revenue (undefined) Forecast, by Application 2020 & 2033
- Table 20: Germany Proton Therapy Technology Revenue (undefined) Forecast, by Application 2020 & 2033
- Table 21: France Proton Therapy Technology Revenue (undefined) Forecast, by Application 2020 & 2033
- Table 22: Italy Proton Therapy Technology Revenue (undefined) Forecast, by Application 2020 & 2033
- Table 23: Spain Proton Therapy Technology Revenue (undefined) Forecast, by Application 2020 & 2033
- Table 24: Russia Proton Therapy Technology Revenue (undefined) Forecast, by Application 2020 & 2033
- Table 25: Benelux Proton Therapy Technology Revenue (undefined) Forecast, by Application 2020 & 2033
- Table 26: Nordics Proton Therapy Technology Revenue (undefined) Forecast, by Application 2020 & 2033
- Table 27: Rest of Europe Proton Therapy Technology Revenue (undefined) Forecast, by Application 2020 & 2033
- Table 28: Global Proton Therapy Technology Revenue undefined Forecast, by Application 2020 & 2033
- Table 29: Global Proton Therapy Technology Revenue undefined Forecast, by Types 2020 & 2033
- Table 30: Global Proton Therapy Technology Revenue undefined Forecast, by Country 2020 & 2033
- Table 31: Turkey Proton Therapy Technology Revenue (undefined) Forecast, by Application 2020 & 2033
- Table 32: Israel Proton Therapy Technology Revenue (undefined) Forecast, by Application 2020 & 2033
- Table 33: GCC Proton Therapy Technology Revenue (undefined) Forecast, by Application 2020 & 2033
- Table 34: North Africa Proton Therapy Technology Revenue (undefined) Forecast, by Application 2020 & 2033
- Table 35: South Africa Proton Therapy Technology Revenue (undefined) Forecast, by Application 2020 & 2033
- Table 36: Rest of Middle East & Africa Proton Therapy Technology Revenue (undefined) Forecast, by Application 2020 & 2033
- Table 37: Global Proton Therapy Technology Revenue undefined Forecast, by Application 2020 & 2033
- Table 38: Global Proton Therapy Technology Revenue undefined Forecast, by Types 2020 & 2033
- Table 39: Global Proton Therapy Technology Revenue undefined Forecast, by Country 2020 & 2033
- Table 40: China Proton Therapy Technology Revenue (undefined) Forecast, by Application 2020 & 2033
- Table 41: India Proton Therapy Technology Revenue (undefined) Forecast, by Application 2020 & 2033
- Table 42: Japan Proton Therapy Technology Revenue (undefined) Forecast, by Application 2020 & 2033
- Table 43: South Korea Proton Therapy Technology Revenue (undefined) Forecast, by Application 2020 & 2033
- Table 44: ASEAN Proton Therapy Technology Revenue (undefined) Forecast, by Application 2020 & 2033
- Table 45: Oceania Proton Therapy Technology Revenue (undefined) Forecast, by Application 2020 & 2033
- Table 46: Rest of Asia Pacific Proton Therapy Technology Revenue (undefined) Forecast, by Application 2020 & 2033
Frequently Asked Questions
1. What is the projected Compound Annual Growth Rate (CAGR) of the Proton Therapy Technology?
The projected CAGR is approximately 15.3%.
2. Which companies are prominent players in the Proton Therapy Technology?
Key companies in the market include IBA, Varian, Hitachi, Mevion, Sumitomo, ProNova.
3. What are the main segments of the Proton Therapy Technology?
The market segments include Application, Types.
4. Can you provide details about the market size?
The market size is estimated to be USD XXX N/A as of 2022.
5. What are some drivers contributing to market growth?
N/A
6. What are the notable trends driving market growth?
N/A
7. Are there any restraints impacting market growth?
N/A
8. Can you provide examples of recent developments in the market?
N/A
9. What pricing options are available for accessing the report?
Pricing options include single-user, multi-user, and enterprise licenses priced at USD 4900.00, USD 7350.00, and USD 9800.00 respectively.
10. Is the market size provided in terms of value or volume?
The market size is provided in terms of value, measured in N/A.
11. Are there any specific market keywords associated with the report?
Yes, the market keyword associated with the report is "Proton Therapy Technology," which aids in identifying and referencing the specific market segment covered.
12. How do I determine which pricing option suits my needs best?
The pricing options vary based on user requirements and access needs. Individual users may opt for single-user licenses, while businesses requiring broader access may choose multi-user or enterprise licenses for cost-effective access to the report.
13. Are there any additional resources or data provided in the Proton Therapy Technology report?
While the report offers comprehensive insights, it's advisable to review the specific contents or supplementary materials provided to ascertain if additional resources or data are available.
14. How can I stay updated on further developments or reports in the Proton Therapy Technology?
To stay informed about further developments, trends, and reports in the Proton Therapy Technology, consider subscribing to industry newsletters, following relevant companies and organizations, or regularly checking reputable industry news sources and publications.
Methodology
Step 1 - Identification of Relevant Samples Size from Population Database


Step 2 - Approaches for Defining Global Market Size (Value, Volume* & Price*)

Note*: In applicable scenarios
Step 3 - Data Sources
Primary Research
- Web Analytics
- Survey Reports
- Research Institute
- Latest Research Reports
- Opinion Leaders
Secondary Research
- Annual Reports
- White Paper
- Latest Press Release
- Industry Association
- Paid Database
- Investor Presentations

Step 4 - Data Triangulation
Involves using different sources of information in order to increase the validity of a study
These sources are likely to be stakeholders in a program - participants, other researchers, program staff, other community members, and so on.
Then we put all data in single framework & apply various statistical tools to find out the dynamic on the market.
During the analysis stage, feedback from the stakeholder groups would be compared to determine areas of agreement as well as areas of divergence