

Key Insights
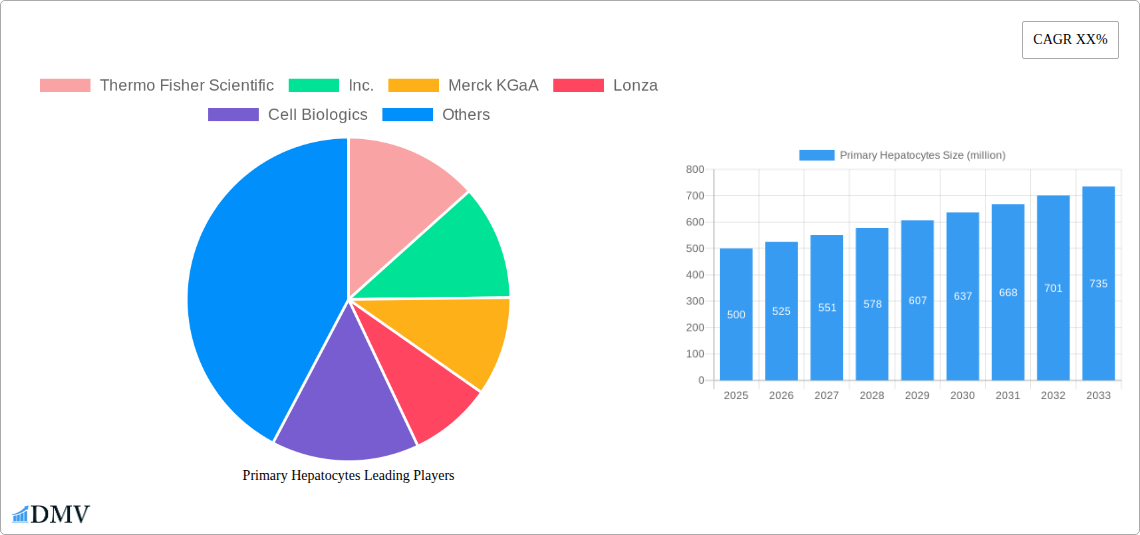
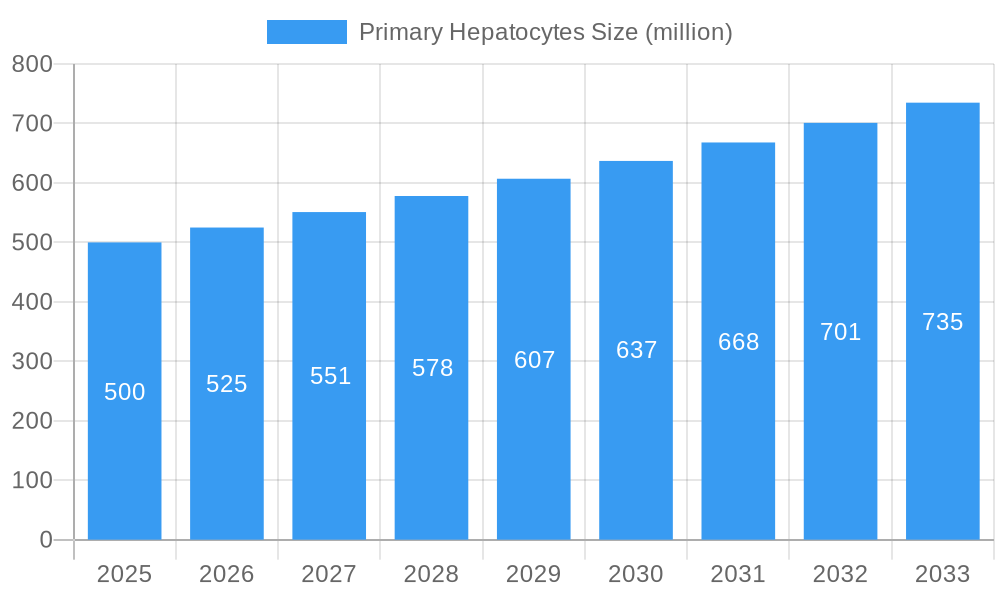
The global primary hepatocytes market is experiencing robust growth, driven by the increasing prevalence of liver diseases, expanding research and development activities in drug discovery and toxicology, and the rising demand for advanced cell-based assays. The market's value in 2025 is estimated at $500 million, reflecting a significant increase from previous years. This growth is fueled by the crucial role primary hepatocytes play in preclinical drug testing, enabling researchers to evaluate drug metabolism, toxicity, and efficacy with greater accuracy than traditional methods. The increasing adoption of advanced cell culture techniques and the development of innovative primary hepatocyte isolation and cryopreservation methods further contribute to market expansion. Key players, such as Thermo Fisher Scientific, Merck KGaA, and Lonza, are actively investing in research and development to enhance product quality and expand their product portfolios, intensifying competition and driving innovation within the market.
Primary Hepatocytes Market Size (In Million)
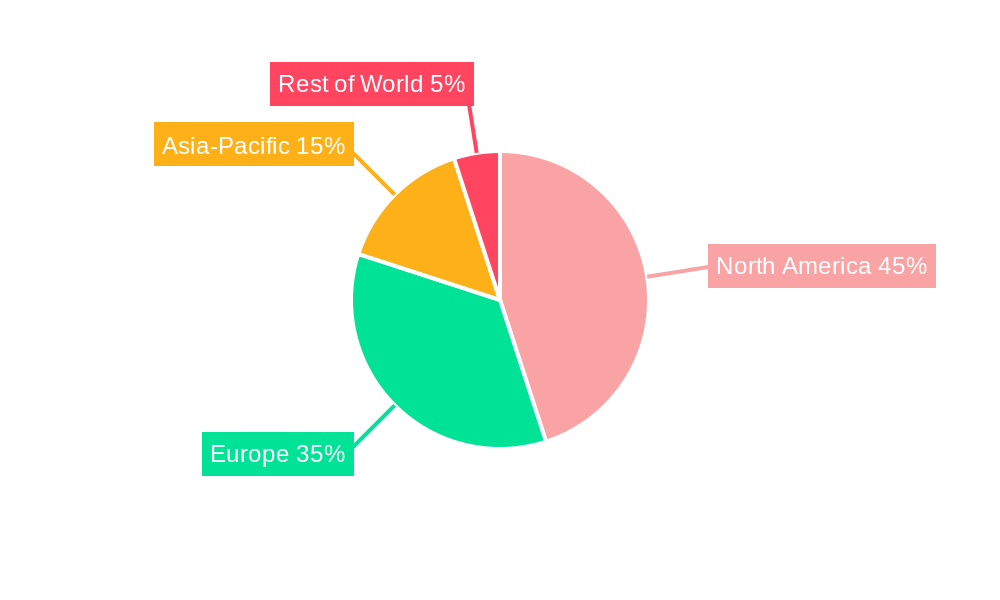
The market is segmented by type (human, animal), application (drug discovery and development, toxicology studies, disease modeling, regenerative medicine), and end-user (pharmaceutical and biotechnology companies, academic and research institutions, contract research organizations). The drug discovery and development segment dominates the market due to the critical need for accurate and reliable preclinical testing. North America and Europe currently hold the largest market shares, driven by the presence of major pharmaceutical companies, well-established research infrastructure, and robust regulatory frameworks. However, the Asia-Pacific region is projected to exhibit significant growth in the coming years, driven by rising healthcare expenditure and increasing research investments. Challenges such as the high cost of primary hepatocytes, ethical concerns surrounding their sourcing, and the inherent variability between batches remain key restraints to market expansion. However, ongoing innovations in cell culture technologies and improved standardization processes are expected to mitigate some of these limitations in the forecast period of 2025-2033.
Primary Hepatocytes Company Market Share
Primary Hepatocytes Market Report: 2019-2033 Forecast
This comprehensive report provides an in-depth analysis of the global primary hepatocytes market, projecting a multi-million-dollar valuation by 2033. The study covers market segmentation, competitive landscape, technological advancements, and future growth opportunities, offering invaluable insights for stakeholders across the pharmaceutical, biotechnology, and research sectors. Based on extensive research and data analysis covering the period 2019-2024 (historical period), 2025 (base year and estimated year), and 2025-2033 (forecast period), this report is an indispensable resource for strategic decision-making.
Primary Hepatocytes Market Composition & Trends
The global primary hepatocytes market, valued at $xx million in 2025, exhibits a moderately concentrated landscape. Key players, including Thermo Fisher Scientific, Inc., Merck KGaA, Lonza, and others, control significant market share, though smaller players are driving innovation and competition. The market is shaped by stringent regulatory approvals, the increasing demand for advanced drug discovery and development tools, and the rising prevalence of liver diseases. Substitute products, such as immortalized cell lines and induced pluripotent stem cell (iPSC)-derived hepatocytes, pose competitive pressure. However, the superior physiological relevance of primary hepatocytes continues to drive their adoption.
- Market Share Distribution (2025): Thermo Fisher Scientific, Inc. (xx%), Merck KGaA (xx%), Lonza (xx%), Others (xx%).
- M&A Activity (2019-2024): A total of xx M&A deals were recorded, with a combined value of $xx million, primarily driven by the consolidation of smaller players and expansion into new geographic markets.
- End-User Profile: Pharmaceutical companies (xx%), Biotechnology companies (xx%), Academic Research Institutions (xx%), Contract Research Organizations (xx%).
Primary Hepatocytes Industry Evolution
The primary hepatocytes market has witnessed significant growth between 2019 and 2025, fueled by the increasing demand for in-vitro drug metabolism and toxicity studies. Technological advancements such as improved isolation and cryopreservation techniques, as well as the development of sophisticated culture systems, have enhanced the quality and usability of primary hepatocytes. This has translated into an average annual growth rate (AAGR) of xx% during the historical period, leading to a market value of $xx million in 2025. Furthermore, the growing focus on personalized medicine and the increasing adoption of 3D cell culture models are further accelerating market expansion. The demand for higher-throughput screening assays and the increasing adoption of automation technologies within the drug discovery workflow are also key growth drivers. This positive trend is projected to continue throughout the forecast period (2025-2033), albeit with potentially some market adjustments due to factors discussed in the Obstacles section. We project an AAGR of xx% for the forecast period.
Leading Regions, Countries, or Segments in Primary Hepatocytes
North America currently dominates the primary hepatocytes market, driven by substantial investments in pharmaceutical R&D, the presence of major market players, and robust regulatory frameworks.
Key Drivers for North American Dominance:
- High R&D spending by pharmaceutical and biotechnology companies.
- Stringent regulatory support fostering innovation and adoption of advanced technologies.
- Well-established infrastructure for cell-based assay development and commercialization.
Other Significant Regions: Europe and Asia-Pacific are expected to show notable growth during the forecast period, driven by increasing investments in healthcare infrastructure and the rising prevalence of liver diseases in these regions. However, challenges related to regulatory hurdles and high costs remain in these regions.
Primary Hepatocytes Product Innovations
Recent innovations in primary hepatocyte technology include the development of improved isolation methods resulting in higher cell viability and functionality. This has led to more accurate and reliable results in drug metabolism and toxicity studies. Furthermore, the development of co-culture systems that mimic the in-vivo liver microenvironment has significantly enhanced the predictive power of in-vitro assays. The introduction of novel cryopreservation techniques has also extended the shelf life and usability of these primary cells. These advancements have helped to reduce costs associated with experiments and increased overall efficiency.
Propelling Factors for Primary Hepatocytes Growth
Several factors fuel the primary hepatocytes market's expansion. The rising prevalence of chronic liver diseases globally fuels demand for effective drug screening and development. Technological advancements, like improved isolation and cryopreservation, enhance cell quality and expand application possibilities. Government support for biomedical research, along with the increasing adoption of cell-based assays in pharmaceutical research, contributes to significant market growth.
Obstacles in the Primary Hepatocytes Market
Despite promising growth, the market faces challenges. High costs associated with primary hepatocyte isolation, cultivation, and maintenance limit accessibility. The limited availability of high-quality cells and potential batch-to-batch variability pose significant hurdles. Furthermore, stringent regulatory requirements and supply chain disruptions impact market growth. These factors contribute to a higher cost of experiments, especially for high-throughput screening needs.
Future Opportunities in Primary Hepatocytes
Emerging opportunities include the development of novel cell culture systems that better mimic the in vivo liver environment, particularly for personalized medicine applications. The integration of primary hepatocytes into microfluidic devices and organ-on-a-chip platforms presents significant potential for enhanced drug screening and toxicity testing. Expansion into emerging markets with growing healthcare investments also offers lucrative prospects.
Major Players in the Primary Hepatocytes Ecosystem
- Thermo Fisher Scientific, Inc.
- Merck KGaA
- Lonza
- Cell Biologics, Inc.
- PromoCell GmbH
- HemaCare Corporation
- ZenBio, Inc.
- STEMCELL Technologies, Inc.
- Corning Incorporated
- AllCells
- Axol Bioscience Ltd.
- iXCells Biotechnologies
- Neuromics
- StemExpress
- BioIVT
- ScienCell Research Laboratories, Inc.
- PPA Research Group, Inc.
- Creative Bioarray
- BPS Bioscience, Inc.
- Epithelix Sàrl
- ReachBio LLC
- AcceGen
- Sekisui XenoTech, LLC
- Biopredic International
Key Developments in Primary Hepatocytes Industry
- 2022 Q4: Lonza launched a new line of cryopreserved primary hepatocytes with enhanced functionality.
- 2023 Q1: Thermo Fisher Scientific, Inc. acquired a smaller cell culture company, expanding its product portfolio. (Further details not available, replace with specific acquisitions if available)
- 2024 Q2: A significant regulatory approval for a new primary hepatocyte-based drug testing method. (Further details not available, replace with specific regulatory changes if available)
Strategic Primary Hepatocytes Market Forecast
The primary hepatocytes market is poised for continued growth, driven by the increasing demand for advanced drug discovery and development tools. The ongoing technological advancements, coupled with the growing focus on personalized medicine and the rising prevalence of liver diseases, will create significant market opportunities. We project a substantial increase in market value during the forecast period, with a significant contribution from the ongoing technological developments in the sector.
Primary Hepatocytes Segmentation
-
1. Application
- 1.1. Life Science Research Companies
- 1.2. Research Institutes
- 1.3. Others
-
2. Types
- 2.1. Human Primary Cells
- 2.2. Animal Primary Cells
Primary Hepatocytes Segmentation By Geography
-
1. North America
- 1.1. United States
- 1.2. Canada
- 1.3. Mexico
-
2. South America
- 2.1. Brazil
- 2.2. Argentina
- 2.3. Rest of South America
-
3. Europe
- 3.1. United Kingdom
- 3.2. Germany
- 3.3. France
- 3.4. Italy
- 3.5. Spain
- 3.6. Russia
- 3.7. Benelux
- 3.8. Nordics
- 3.9. Rest of Europe
-
4. Middle East & Africa
- 4.1. Turkey
- 4.2. Israel
- 4.3. GCC
- 4.4. North Africa
- 4.5. South Africa
- 4.6. Rest of Middle East & Africa
-
5. Asia Pacific
- 5.1. China
- 5.2. India
- 5.3. Japan
- 5.4. South Korea
- 5.5. ASEAN
- 5.6. Oceania
- 5.7. Rest of Asia Pacific
Primary Hepatocytes Regional Market Share
Geographic Coverage of Primary Hepatocytes
Primary Hepatocytes REPORT HIGHLIGHTS
| Aspects | Details |
|---|---|
| Study Period | 2020-2034 |
| Base Year | 2025 |
| Estimated Year | 2026 |
| Forecast Period | 2026-2034 |
| Historical Period | 2020-2025 |
| Growth Rate | CAGR of 14.88% from 2020-2034 |
| Segmentation |
|
Table of Contents
- 1. Introduction
- 1.1. Research Scope
- 1.2. Market Segmentation
- 1.3. Research Methodology
- 1.4. Definitions and Assumptions
- 2. Executive Summary
- 2.1. Introduction
- 3. Market Dynamics
- 3.1. Introduction
- 3.2. Market Drivers
- 3.3. Market Restrains
- 3.4. Market Trends
- 4. Market Factor Analysis
- 4.1. Porters Five Forces
- 4.2. Supply/Value Chain
- 4.3. PESTEL analysis
- 4.4. Market Entropy
- 4.5. Patent/Trademark Analysis
- 5. Global Primary Hepatocytes Analysis, Insights and Forecast, 2020-2032
- 5.1. Market Analysis, Insights and Forecast - by Application
- 5.1.1. Life Science Research Companies
- 5.1.2. Research Institutes
- 5.1.3. Others
- 5.2. Market Analysis, Insights and Forecast - by Types
- 5.2.1. Human Primary Cells
- 5.2.2. Animal Primary Cells
- 5.3. Market Analysis, Insights and Forecast - by Region
- 5.3.1. North America
- 5.3.2. South America
- 5.3.3. Europe
- 5.3.4. Middle East & Africa
- 5.3.5. Asia Pacific
- 5.1. Market Analysis, Insights and Forecast - by Application
- 6. North America Primary Hepatocytes Analysis, Insights and Forecast, 2020-2032
- 6.1. Market Analysis, Insights and Forecast - by Application
- 6.1.1. Life Science Research Companies
- 6.1.2. Research Institutes
- 6.1.3. Others
- 6.2. Market Analysis, Insights and Forecast - by Types
- 6.2.1. Human Primary Cells
- 6.2.2. Animal Primary Cells
- 6.1. Market Analysis, Insights and Forecast - by Application
- 7. South America Primary Hepatocytes Analysis, Insights and Forecast, 2020-2032
- 7.1. Market Analysis, Insights and Forecast - by Application
- 7.1.1. Life Science Research Companies
- 7.1.2. Research Institutes
- 7.1.3. Others
- 7.2. Market Analysis, Insights and Forecast - by Types
- 7.2.1. Human Primary Cells
- 7.2.2. Animal Primary Cells
- 7.1. Market Analysis, Insights and Forecast - by Application
- 8. Europe Primary Hepatocytes Analysis, Insights and Forecast, 2020-2032
- 8.1. Market Analysis, Insights and Forecast - by Application
- 8.1.1. Life Science Research Companies
- 8.1.2. Research Institutes
- 8.1.3. Others
- 8.2. Market Analysis, Insights and Forecast - by Types
- 8.2.1. Human Primary Cells
- 8.2.2. Animal Primary Cells
- 8.1. Market Analysis, Insights and Forecast - by Application
- 9. Middle East & Africa Primary Hepatocytes Analysis, Insights and Forecast, 2020-2032
- 9.1. Market Analysis, Insights and Forecast - by Application
- 9.1.1. Life Science Research Companies
- 9.1.2. Research Institutes
- 9.1.3. Others
- 9.2. Market Analysis, Insights and Forecast - by Types
- 9.2.1. Human Primary Cells
- 9.2.2. Animal Primary Cells
- 9.1. Market Analysis, Insights and Forecast - by Application
- 10. Asia Pacific Primary Hepatocytes Analysis, Insights and Forecast, 2020-2032
- 10.1. Market Analysis, Insights and Forecast - by Application
- 10.1.1. Life Science Research Companies
- 10.1.2. Research Institutes
- 10.1.3. Others
- 10.2. Market Analysis, Insights and Forecast - by Types
- 10.2.1. Human Primary Cells
- 10.2.2. Animal Primary Cells
- 10.1. Market Analysis, Insights and Forecast - by Application
- 11. Competitive Analysis
- 11.1. Global Market Share Analysis 2025
- 11.2. Company Profiles
- 11.2.1 Thermo Fisher Scientific
- 11.2.1.1. Overview
- 11.2.1.2. Products
- 11.2.1.3. SWOT Analysis
- 11.2.1.4. Recent Developments
- 11.2.1.5. Financials (Based on Availability)
- 11.2.2 Inc.
- 11.2.2.1. Overview
- 11.2.2.2. Products
- 11.2.2.3. SWOT Analysis
- 11.2.2.4. Recent Developments
- 11.2.2.5. Financials (Based on Availability)
- 11.2.3 Merck KGaA
- 11.2.3.1. Overview
- 11.2.3.2. Products
- 11.2.3.3. SWOT Analysis
- 11.2.3.4. Recent Developments
- 11.2.3.5. Financials (Based on Availability)
- 11.2.4 Lonza
- 11.2.4.1. Overview
- 11.2.4.2. Products
- 11.2.4.3. SWOT Analysis
- 11.2.4.4. Recent Developments
- 11.2.4.5. Financials (Based on Availability)
- 11.2.5 Cell Biologics
- 11.2.5.1. Overview
- 11.2.5.2. Products
- 11.2.5.3. SWOT Analysis
- 11.2.5.4. Recent Developments
- 11.2.5.5. Financials (Based on Availability)
- 11.2.6 Inc.
- 11.2.6.1. Overview
- 11.2.6.2. Products
- 11.2.6.3. SWOT Analysis
- 11.2.6.4. Recent Developments
- 11.2.6.5. Financials (Based on Availability)
- 11.2.7 PromoCell GmbH
- 11.2.7.1. Overview
- 11.2.7.2. Products
- 11.2.7.3. SWOT Analysis
- 11.2.7.4. Recent Developments
- 11.2.7.5. Financials (Based on Availability)
- 11.2.8 HemaCare Corporation
- 11.2.8.1. Overview
- 11.2.8.2. Products
- 11.2.8.3. SWOT Analysis
- 11.2.8.4. Recent Developments
- 11.2.8.5. Financials (Based on Availability)
- 11.2.9 ZenBio
- 11.2.9.1. Overview
- 11.2.9.2. Products
- 11.2.9.3. SWOT Analysis
- 11.2.9.4. Recent Developments
- 11.2.9.5. Financials (Based on Availability)
- 11.2.10 Inc.
- 11.2.10.1. Overview
- 11.2.10.2. Products
- 11.2.10.3. SWOT Analysis
- 11.2.10.4. Recent Developments
- 11.2.10.5. Financials (Based on Availability)
- 11.2.11 STEMCELL Technologies
- 11.2.11.1. Overview
- 11.2.11.2. Products
- 11.2.11.3. SWOT Analysis
- 11.2.11.4. Recent Developments
- 11.2.11.5. Financials (Based on Availability)
- 11.2.12 Inc.
- 11.2.12.1. Overview
- 11.2.12.2. Products
- 11.2.12.3. SWOT Analysis
- 11.2.12.4. Recent Developments
- 11.2.12.5. Financials (Based on Availability)
- 11.2.13 Corning Incorporated
- 11.2.13.1. Overview
- 11.2.13.2. Products
- 11.2.13.3. SWOT Analysis
- 11.2.13.4. Recent Developments
- 11.2.13.5. Financials (Based on Availability)
- 11.2.14 AllCells
- 11.2.14.1. Overview
- 11.2.14.2. Products
- 11.2.14.3. SWOT Analysis
- 11.2.14.4. Recent Developments
- 11.2.14.5. Financials (Based on Availability)
- 11.2.15 Axol Bioscience Ltd.
- 11.2.15.1. Overview
- 11.2.15.2. Products
- 11.2.15.3. SWOT Analysis
- 11.2.15.4. Recent Developments
- 11.2.15.5. Financials (Based on Availability)
- 11.2.16 iXCells Biotechnologies
- 11.2.16.1. Overview
- 11.2.16.2. Products
- 11.2.16.3. SWOT Analysis
- 11.2.16.4. Recent Developments
- 11.2.16.5. Financials (Based on Availability)
- 11.2.17 Neuromics
- 11.2.17.1. Overview
- 11.2.17.2. Products
- 11.2.17.3. SWOT Analysis
- 11.2.17.4. Recent Developments
- 11.2.17.5. Financials (Based on Availability)
- 11.2.18 StemExpress
- 11.2.18.1. Overview
- 11.2.18.2. Products
- 11.2.18.3. SWOT Analysis
- 11.2.18.4. Recent Developments
- 11.2.18.5. Financials (Based on Availability)
- 11.2.19 BioIVT
- 11.2.19.1. Overview
- 11.2.19.2. Products
- 11.2.19.3. SWOT Analysis
- 11.2.19.4. Recent Developments
- 11.2.19.5. Financials (Based on Availability)
- 11.2.20 ScienCell Research Laboratories
- 11.2.20.1. Overview
- 11.2.20.2. Products
- 11.2.20.3. SWOT Analysis
- 11.2.20.4. Recent Developments
- 11.2.20.5. Financials (Based on Availability)
- 11.2.21 Inc.
- 11.2.21.1. Overview
- 11.2.21.2. Products
- 11.2.21.3. SWOT Analysis
- 11.2.21.4. Recent Developments
- 11.2.21.5. Financials (Based on Availability)
- 11.2.22 PPA Research Group
- 11.2.22.1. Overview
- 11.2.22.2. Products
- 11.2.22.3. SWOT Analysis
- 11.2.22.4. Recent Developments
- 11.2.22.5. Financials (Based on Availability)
- 11.2.23 Inc.
- 11.2.23.1. Overview
- 11.2.23.2. Products
- 11.2.23.3. SWOT Analysis
- 11.2.23.4. Recent Developments
- 11.2.23.5. Financials (Based on Availability)
- 11.2.24 Creative Bioarray
- 11.2.24.1. Overview
- 11.2.24.2. Products
- 11.2.24.3. SWOT Analysis
- 11.2.24.4. Recent Developments
- 11.2.24.5. Financials (Based on Availability)
- 11.2.25 BPS Bioscience
- 11.2.25.1. Overview
- 11.2.25.2. Products
- 11.2.25.3. SWOT Analysis
- 11.2.25.4. Recent Developments
- 11.2.25.5. Financials (Based on Availability)
- 11.2.26 Inc.
- 11.2.26.1. Overview
- 11.2.26.2. Products
- 11.2.26.3. SWOT Analysis
- 11.2.26.4. Recent Developments
- 11.2.26.5. Financials (Based on Availability)
- 11.2.27 Epithelix Sàrl
- 11.2.27.1. Overview
- 11.2.27.2. Products
- 11.2.27.3. SWOT Analysis
- 11.2.27.4. Recent Developments
- 11.2.27.5. Financials (Based on Availability)
- 11.2.28 ReachBio LLC
- 11.2.28.1. Overview
- 11.2.28.2. Products
- 11.2.28.3. SWOT Analysis
- 11.2.28.4. Recent Developments
- 11.2.28.5. Financials (Based on Availability)
- 11.2.29 AcceGen
- 11.2.29.1. Overview
- 11.2.29.2. Products
- 11.2.29.3. SWOT Analysis
- 11.2.29.4. Recent Developments
- 11.2.29.5. Financials (Based on Availability)
- 11.2.30 Sekisui XenoTech
- 11.2.30.1. Overview
- 11.2.30.2. Products
- 11.2.30.3. SWOT Analysis
- 11.2.30.4. Recent Developments
- 11.2.30.5. Financials (Based on Availability)
- 11.2.31 LLC
- 11.2.31.1. Overview
- 11.2.31.2. Products
- 11.2.31.3. SWOT Analysis
- 11.2.31.4. Recent Developments
- 11.2.31.5. Financials (Based on Availability)
- 11.2.32 Biopredic International
- 11.2.32.1. Overview
- 11.2.32.2. Products
- 11.2.32.3. SWOT Analysis
- 11.2.32.4. Recent Developments
- 11.2.32.5. Financials (Based on Availability)
- 11.2.1 Thermo Fisher Scientific
List of Figures
- Figure 1: Global Primary Hepatocytes Revenue Breakdown (undefined, %) by Region 2025 & 2033
- Figure 2: North America Primary Hepatocytes Revenue (undefined), by Application 2025 & 2033
- Figure 3: North America Primary Hepatocytes Revenue Share (%), by Application 2025 & 2033
- Figure 4: North America Primary Hepatocytes Revenue (undefined), by Types 2025 & 2033
- Figure 5: North America Primary Hepatocytes Revenue Share (%), by Types 2025 & 2033
- Figure 6: North America Primary Hepatocytes Revenue (undefined), by Country 2025 & 2033
- Figure 7: North America Primary Hepatocytes Revenue Share (%), by Country 2025 & 2033
- Figure 8: South America Primary Hepatocytes Revenue (undefined), by Application 2025 & 2033
- Figure 9: South America Primary Hepatocytes Revenue Share (%), by Application 2025 & 2033
- Figure 10: South America Primary Hepatocytes Revenue (undefined), by Types 2025 & 2033
- Figure 11: South America Primary Hepatocytes Revenue Share (%), by Types 2025 & 2033
- Figure 12: South America Primary Hepatocytes Revenue (undefined), by Country 2025 & 2033
- Figure 13: South America Primary Hepatocytes Revenue Share (%), by Country 2025 & 2033
- Figure 14: Europe Primary Hepatocytes Revenue (undefined), by Application 2025 & 2033
- Figure 15: Europe Primary Hepatocytes Revenue Share (%), by Application 2025 & 2033
- Figure 16: Europe Primary Hepatocytes Revenue (undefined), by Types 2025 & 2033
- Figure 17: Europe Primary Hepatocytes Revenue Share (%), by Types 2025 & 2033
- Figure 18: Europe Primary Hepatocytes Revenue (undefined), by Country 2025 & 2033
- Figure 19: Europe Primary Hepatocytes Revenue Share (%), by Country 2025 & 2033
- Figure 20: Middle East & Africa Primary Hepatocytes Revenue (undefined), by Application 2025 & 2033
- Figure 21: Middle East & Africa Primary Hepatocytes Revenue Share (%), by Application 2025 & 2033
- Figure 22: Middle East & Africa Primary Hepatocytes Revenue (undefined), by Types 2025 & 2033
- Figure 23: Middle East & Africa Primary Hepatocytes Revenue Share (%), by Types 2025 & 2033
- Figure 24: Middle East & Africa Primary Hepatocytes Revenue (undefined), by Country 2025 & 2033
- Figure 25: Middle East & Africa Primary Hepatocytes Revenue Share (%), by Country 2025 & 2033
- Figure 26: Asia Pacific Primary Hepatocytes Revenue (undefined), by Application 2025 & 2033
- Figure 27: Asia Pacific Primary Hepatocytes Revenue Share (%), by Application 2025 & 2033
- Figure 28: Asia Pacific Primary Hepatocytes Revenue (undefined), by Types 2025 & 2033
- Figure 29: Asia Pacific Primary Hepatocytes Revenue Share (%), by Types 2025 & 2033
- Figure 30: Asia Pacific Primary Hepatocytes Revenue (undefined), by Country 2025 & 2033
- Figure 31: Asia Pacific Primary Hepatocytes Revenue Share (%), by Country 2025 & 2033
List of Tables
- Table 1: Global Primary Hepatocytes Revenue undefined Forecast, by Application 2020 & 2033
- Table 2: Global Primary Hepatocytes Revenue undefined Forecast, by Types 2020 & 2033
- Table 3: Global Primary Hepatocytes Revenue undefined Forecast, by Region 2020 & 2033
- Table 4: Global Primary Hepatocytes Revenue undefined Forecast, by Application 2020 & 2033
- Table 5: Global Primary Hepatocytes Revenue undefined Forecast, by Types 2020 & 2033
- Table 6: Global Primary Hepatocytes Revenue undefined Forecast, by Country 2020 & 2033
- Table 7: United States Primary Hepatocytes Revenue (undefined) Forecast, by Application 2020 & 2033
- Table 8: Canada Primary Hepatocytes Revenue (undefined) Forecast, by Application 2020 & 2033
- Table 9: Mexico Primary Hepatocytes Revenue (undefined) Forecast, by Application 2020 & 2033
- Table 10: Global Primary Hepatocytes Revenue undefined Forecast, by Application 2020 & 2033
- Table 11: Global Primary Hepatocytes Revenue undefined Forecast, by Types 2020 & 2033
- Table 12: Global Primary Hepatocytes Revenue undefined Forecast, by Country 2020 & 2033
- Table 13: Brazil Primary Hepatocytes Revenue (undefined) Forecast, by Application 2020 & 2033
- Table 14: Argentina Primary Hepatocytes Revenue (undefined) Forecast, by Application 2020 & 2033
- Table 15: Rest of South America Primary Hepatocytes Revenue (undefined) Forecast, by Application 2020 & 2033
- Table 16: Global Primary Hepatocytes Revenue undefined Forecast, by Application 2020 & 2033
- Table 17: Global Primary Hepatocytes Revenue undefined Forecast, by Types 2020 & 2033
- Table 18: Global Primary Hepatocytes Revenue undefined Forecast, by Country 2020 & 2033
- Table 19: United Kingdom Primary Hepatocytes Revenue (undefined) Forecast, by Application 2020 & 2033
- Table 20: Germany Primary Hepatocytes Revenue (undefined) Forecast, by Application 2020 & 2033
- Table 21: France Primary Hepatocytes Revenue (undefined) Forecast, by Application 2020 & 2033
- Table 22: Italy Primary Hepatocytes Revenue (undefined) Forecast, by Application 2020 & 2033
- Table 23: Spain Primary Hepatocytes Revenue (undefined) Forecast, by Application 2020 & 2033
- Table 24: Russia Primary Hepatocytes Revenue (undefined) Forecast, by Application 2020 & 2033
- Table 25: Benelux Primary Hepatocytes Revenue (undefined) Forecast, by Application 2020 & 2033
- Table 26: Nordics Primary Hepatocytes Revenue (undefined) Forecast, by Application 2020 & 2033
- Table 27: Rest of Europe Primary Hepatocytes Revenue (undefined) Forecast, by Application 2020 & 2033
- Table 28: Global Primary Hepatocytes Revenue undefined Forecast, by Application 2020 & 2033
- Table 29: Global Primary Hepatocytes Revenue undefined Forecast, by Types 2020 & 2033
- Table 30: Global Primary Hepatocytes Revenue undefined Forecast, by Country 2020 & 2033
- Table 31: Turkey Primary Hepatocytes Revenue (undefined) Forecast, by Application 2020 & 2033
- Table 32: Israel Primary Hepatocytes Revenue (undefined) Forecast, by Application 2020 & 2033
- Table 33: GCC Primary Hepatocytes Revenue (undefined) Forecast, by Application 2020 & 2033
- Table 34: North Africa Primary Hepatocytes Revenue (undefined) Forecast, by Application 2020 & 2033
- Table 35: South Africa Primary Hepatocytes Revenue (undefined) Forecast, by Application 2020 & 2033
- Table 36: Rest of Middle East & Africa Primary Hepatocytes Revenue (undefined) Forecast, by Application 2020 & 2033
- Table 37: Global Primary Hepatocytes Revenue undefined Forecast, by Application 2020 & 2033
- Table 38: Global Primary Hepatocytes Revenue undefined Forecast, by Types 2020 & 2033
- Table 39: Global Primary Hepatocytes Revenue undefined Forecast, by Country 2020 & 2033
- Table 40: China Primary Hepatocytes Revenue (undefined) Forecast, by Application 2020 & 2033
- Table 41: India Primary Hepatocytes Revenue (undefined) Forecast, by Application 2020 & 2033
- Table 42: Japan Primary Hepatocytes Revenue (undefined) Forecast, by Application 2020 & 2033
- Table 43: South Korea Primary Hepatocytes Revenue (undefined) Forecast, by Application 2020 & 2033
- Table 44: ASEAN Primary Hepatocytes Revenue (undefined) Forecast, by Application 2020 & 2033
- Table 45: Oceania Primary Hepatocytes Revenue (undefined) Forecast, by Application 2020 & 2033
- Table 46: Rest of Asia Pacific Primary Hepatocytes Revenue (undefined) Forecast, by Application 2020 & 2033
Frequently Asked Questions
1. What is the projected Compound Annual Growth Rate (CAGR) of the Primary Hepatocytes?
The projected CAGR is approximately 14.88%.
2. Which companies are prominent players in the Primary Hepatocytes?
Key companies in the market include Thermo Fisher Scientific, Inc., Merck KGaA, Lonza, Cell Biologics, Inc., PromoCell GmbH, HemaCare Corporation, ZenBio, Inc., STEMCELL Technologies, Inc., Corning Incorporated, AllCells, Axol Bioscience Ltd., iXCells Biotechnologies, Neuromics, StemExpress, BioIVT, ScienCell Research Laboratories, Inc., PPA Research Group, Inc., Creative Bioarray, BPS Bioscience, Inc., Epithelix Sàrl, ReachBio LLC, AcceGen, Sekisui XenoTech, LLC, Biopredic International.
3. What are the main segments of the Primary Hepatocytes?
The market segments include Application, Types.
4. Can you provide details about the market size?
The market size is estimated to be USD XXX N/A as of 2022.
5. What are some drivers contributing to market growth?
N/A
6. What are the notable trends driving market growth?
N/A
7. Are there any restraints impacting market growth?
N/A
8. Can you provide examples of recent developments in the market?
N/A
9. What pricing options are available for accessing the report?
Pricing options include single-user, multi-user, and enterprise licenses priced at USD 4900.00, USD 7350.00, and USD 9800.00 respectively.
10. Is the market size provided in terms of value or volume?
The market size is provided in terms of value, measured in N/A.
11. Are there any specific market keywords associated with the report?
Yes, the market keyword associated with the report is "Primary Hepatocytes," which aids in identifying and referencing the specific market segment covered.
12. How do I determine which pricing option suits my needs best?
The pricing options vary based on user requirements and access needs. Individual users may opt for single-user licenses, while businesses requiring broader access may choose multi-user or enterprise licenses for cost-effective access to the report.
13. Are there any additional resources or data provided in the Primary Hepatocytes report?
While the report offers comprehensive insights, it's advisable to review the specific contents or supplementary materials provided to ascertain if additional resources or data are available.
14. How can I stay updated on further developments or reports in the Primary Hepatocytes?
To stay informed about further developments, trends, and reports in the Primary Hepatocytes, consider subscribing to industry newsletters, following relevant companies and organizations, or regularly checking reputable industry news sources and publications.
Methodology
Step 1 - Identification of Relevant Samples Size from Population Database


Step 2 - Approaches for Defining Global Market Size (Value, Volume* & Price*)

Note*: In applicable scenarios
Step 3 - Data Sources
Primary Research
- Web Analytics
- Survey Reports
- Research Institute
- Latest Research Reports
- Opinion Leaders
Secondary Research
- Annual Reports
- White Paper
- Latest Press Release
- Industry Association
- Paid Database
- Investor Presentations

Step 4 - Data Triangulation
Involves using different sources of information in order to increase the validity of a study
These sources are likely to be stakeholders in a program - participants, other researchers, program staff, other community members, and so on.
Then we put all data in single framework & apply various statistical tools to find out the dynamic on the market.
During the analysis stage, feedback from the stakeholder groups would be compared to determine areas of agreement as well as areas of divergence