

Key Insights
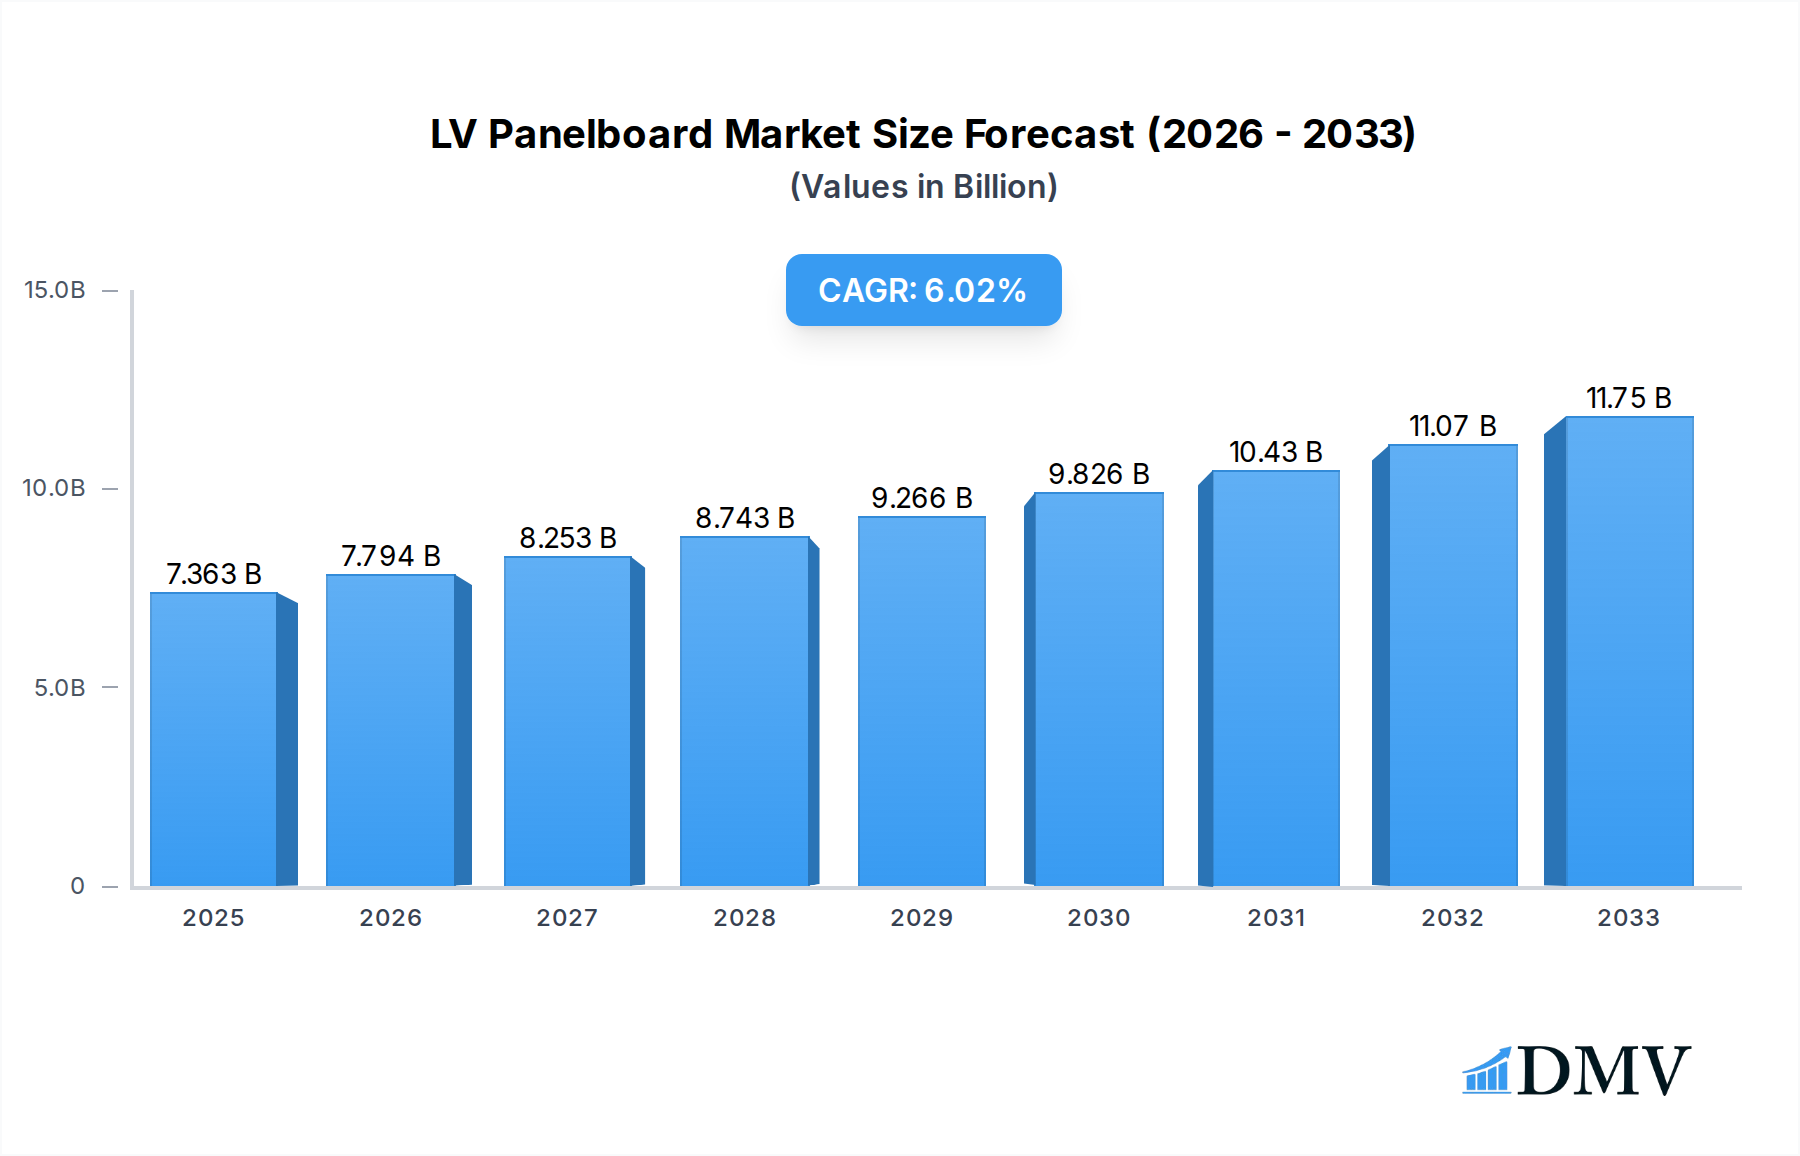
The global Low Voltage (LV) Panelboard market is poised for significant expansion, projected to reach $7363 million by 2025, driven by robust construction activities and increasing demand for reliable power distribution solutions across residential, commercial, and industrial sectors. This growth trajectory is underpinned by a healthy Compound Annual Growth Rate (CAGR) of 5.8% over the forecast period of 2025-2033. Key market drivers include the burgeoning smart city initiatives, the growing adoption of renewable energy sources necessitating advanced grid integration, and stringent safety regulations mandating the use of high-quality electrical infrastructure. Furthermore, the ongoing urbanization and infrastructure development, particularly in emerging economies, are creating substantial opportunities for LV panelboard manufacturers. The market's expansion is also fueled by technological advancements in panelboard design, such as enhanced safety features, increased energy efficiency, and the integration of smart technologies for remote monitoring and control.

LV Panelboard Market Size (In Billion)
The LV Panelboard market exhibits a dynamic landscape shaped by evolving trends and specific segment demands. The Residential Building segment is witnessing steady growth due to new housing construction and renovations, while the Commercial Building sector is a major contributor, driven by the development of office spaces, retail outlets, and hospitality facilities. The Industrial Building segment, crucial for powering manufacturing operations, is experiencing a surge due to industrial expansion and the need for robust power management. In terms of types, both Indoor and Outdoor panelboards are experiencing demand, with outdoor applications gaining traction in infrastructure projects and areas with exposed electrical equipment. Leading players such as Schneider Electric, ABB, Siemens, and Legrand are actively investing in research and development to introduce innovative products, expand their geographical presence, and cater to the diverse needs of the market, further stimulating growth and competition.
LV Panelboard Company Market Share
LV Panelboard Market Composition & Trends
The global LV panelboard market is characterized by a dynamic composition and evolving trends, driven by escalating demand across residential, commercial, and industrial sectors. Market concentration is moderately consolidated, with key players like Schneider Electric, ABB, and Siemens holding significant market share, estimated to be approximately 25 million in combined revenue in 2023, with the top 5 players accounting for over 50 million in market share. Innovation catalysts are primarily focused on enhancing safety features, smart connectivity, and energy efficiency, responding to stringent regulatory landscapes worldwide. For instance, evolving building codes and energy performance standards are directly influencing product development and adoption. Substitute products, such as direct wiring or older, less sophisticated distribution systems, are gradually being phased out due to their inherent safety risks and lack of integration capabilities. End-user profiles vary significantly; residential users prioritize cost-effectiveness and ease of installation, while commercial and industrial users demand robust, high-capacity solutions with advanced monitoring and control functionalities. Mergers and acquisitions (M&A) remain a strategic tool for market expansion and technological integration. Recent M&A activities, with an estimated total deal value of over 50 million in 2023, reflect a trend of consolidation and acquisition of innovative smaller firms by larger players to strengthen their product portfolios and market reach.
- Market Share Distribution: Top 5 players estimated to hold over 50 million in market share.
- Innovation Drivers: Smart grid integration, enhanced safety, energy efficiency.
- Regulatory Impact: Stringent building codes, energy performance standards driving demand.
- M&A Activity: Estimated deal value of over 50 million in 2023.
- End-User Segments: Residential (cost/ease), Commercial (robustness/monitoring), Industrial (high-capacity/control).
LV Panelboard Industry Evolution
The LV panelboard industry has witnessed a significant evolution throughout the historical period of 2019–2024, driven by a confluence of technological advancements, shifting consumer demands, and robust market growth trajectories. During this period, the market experienced an average annual growth rate of approximately 6.5%, fueled by increasing construction activities globally and a growing emphasis on electrical safety and efficiency. The base year of 2025 is projected to see continued expansion, with an estimated market size of 500 million. The forecast period from 2025 to 2033 anticipates sustained growth, with an expected compound annual growth rate (CAGR) of around 7.2%. This trajectory is underpinned by widespread adoption of advanced technologies such as smart circuit breakers, IoT-enabled monitoring systems, and modular panelboard designs that offer enhanced flexibility and scalability. Consumer demand has progressively shifted towards integrated solutions that provide real-time data analytics, remote management capabilities, and improved energy management features. The push for digitalization and automation in buildings and industrial facilities has been a primary catalyst, necessitating sophisticated and intelligent LV panelboard systems. Technological advancements have been instrumental, with manufacturers investing heavily in research and development to create products that not only meet but exceed evolving safety standards and performance expectations. The adoption metrics for smart panelboards have seen a significant uptick, with an estimated 30% increase in market penetration between 2019 and 2024. Furthermore, the increasing focus on sustainable construction practices and green building certifications has further propelled the demand for energy-efficient and environmentally friendly electrical infrastructure, including advanced LV panelboards. The industry's evolution is a testament to its ability to adapt to technological disruptions and anticipate the future needs of a rapidly modernizing world.
Leading Regions, Countries, or Segments in LV Panelboard
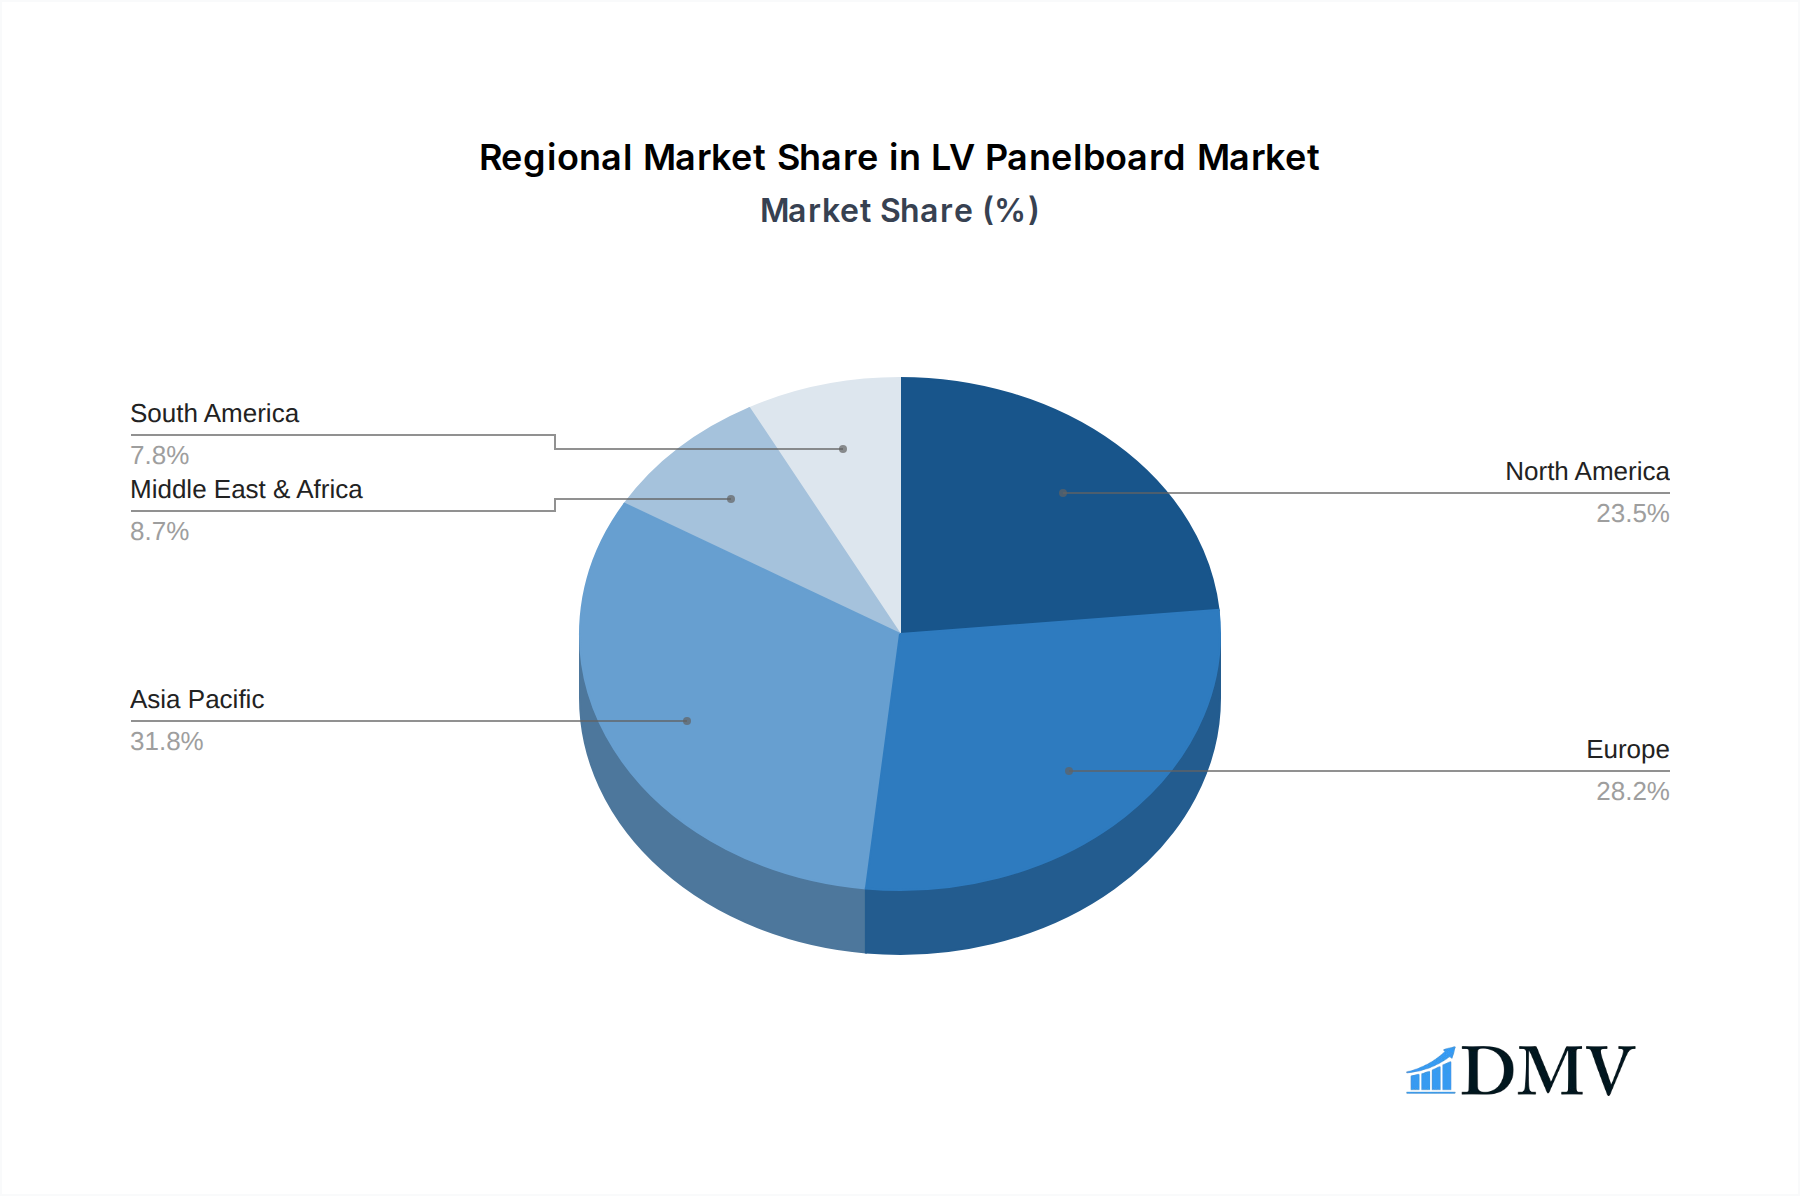
North America currently dominates the LV panelboard market, with an estimated market share of 30% in 2025, driven by robust demand in both commercial and industrial building applications. The region's leadership is further solidified by significant investment trends in infrastructure upgrades, smart city initiatives, and a strong emphasis on industrial automation. Stringent safety regulations and building codes, coupled with a high level of technological adoption, create a fertile ground for advanced LV panelboard solutions. The United States, in particular, is a key contributor, with major construction projects and a thriving manufacturing sector consistently requiring high-performance electrical distribution systems. The dominance is further amplified by the presence of major global players like Schneider Electric and Eaton Corporation, which have a strong established presence and extensive distribution networks in the region.
The Commercial Building segment within the Application category is a significant driver of this dominance. The ongoing wave of commercial construction, office space modernizations, and the expansion of data centers necessitate reliable, scalable, and intelligent electrical infrastructure. Key drivers for this segment's growth include:
- Increased Investment in Smart Buildings: Growing adoption of IoT devices and building management systems (BMS) requires sophisticated panelboards for seamless integration and control, estimated to increase by 25% in investment over the next five years.
- Energy Efficiency Mandates: Commercial buildings are increasingly subject to energy efficiency regulations, pushing for the adoption of panelboards that facilitate better energy monitoring and management, contributing to an estimated 15% reduction in energy consumption.
- Infrastructure Modernization: Aging commercial infrastructure requires upgrades to meet current safety standards and to accommodate increased power demands, leading to a demand for advanced LV panelboards, with an estimated 10 million worth of upgrades annually.
In terms of Types, Indoor panelboards represent the largest share, accounting for approximately 75% of the regional market. This is primarily due to the vast number of commercial and residential buildings that require indoor electrical distribution.
- Ubiquitous Application in Buildings: Virtually all indoor electrical systems in residential, commercial, and industrial settings rely on indoor panelboards for safe power distribution.
- Advancements in Compact and Modular Designs: Manufacturers are continuously innovating to create more compact and modular indoor panelboards, optimizing space utilization within buildings, leading to a 20% improvement in space efficiency.
- Enhanced Safety Features: Continuous improvements in arc flash mitigation, surge protection, and intelligent monitoring systems make indoor panelboards increasingly attractive and essential for modern infrastructure, with an estimated 30 million in safety feature investments.
The Industrial Building segment also plays a pivotal role, with a substantial demand for high-capacity, robust, and specialized LV panelboards. The manufacturing sector's continuous growth and the need for reliable power supply in complex industrial processes contribute significantly to the market's strength, with an estimated 20% of the total industrial market segment value.
- Automation and Electrification Trends: The increasing automation of industrial processes and the electrification of machinery drive the need for more advanced and higher-capacity panelboards, estimated to see a 10% increase in demand driven by automation.
- Harsh Environment Requirements: Industrial settings often demand panelboards built to withstand harsh environmental conditions, leading to specialized ruggedized and corrosion-resistant designs, with an estimated 5 million in specialized material investment.
- Critical Power Continuity: Uninterrupted power supply is paramount in industrial operations, driving demand for robust panelboards with superior fault current withstand capabilities and integrated backup power solutions, with an estimated 50 million in continuity solutions.
LV Panelboard Product Innovations
The LV panelboard market is currently experiencing a surge in product innovations focused on enhancing safety, intelligence, and connectivity. Manufacturers are integrating advanced features such as arc fault detection, remote monitoring capabilities via IoT platforms, and modular designs for easier installation and maintenance. For example, Schneider Electric's recent launch of its EcoStruxure Panel Server integrates digital connectivity into traditional panelboards, providing real-time data on energy consumption and equipment health, leading to an estimated 10% improvement in operational efficiency for end-users. Similarly, ABB's focus on intelligent switchgear incorporates advanced protection relays and communication protocols, enabling seamless integration into smart grids and building automation systems. These innovations are crucial for meeting the evolving demands for enhanced electrical safety, energy management, and operational efficiency across residential, commercial, and industrial applications.
Propelling Factors for LV Panelboard Growth
The LV panelboard market is being propelled by several key factors. Firstly, the escalating global demand for electricity, driven by population growth and industrial expansion, necessitates robust and reliable electrical distribution systems. Secondly, stringent government regulations and international standards concerning electrical safety and energy efficiency are compelling manufacturers and end-users to adopt advanced LV panelboards with superior protection mechanisms and energy management capabilities, estimated to drive an additional 15% market growth due to compliance. Thirdly, rapid urbanization and increasing construction activities, particularly in developing economies, are creating a substantial need for new electrical infrastructure. Finally, the growing adoption of smart technologies, including IoT and AI in buildings and industries, is creating a demand for intelligent panelboards that can be integrated into these advanced systems, potentially adding another 10% growth.
- Increasing Energy Demand: Driven by population growth and industrialization.
- Stringent Safety & Energy Regulations: Mandating advanced panelboard features.
- Urbanization & Construction Boom: Requiring new electrical infrastructure.
- Smart Technology Integration: Demand for IoT-enabled and intelligent panelboards.
Obstacles in the LV Panelboard Market
Despite the robust growth, the LV panelboard market faces several obstacles. High initial capital investment for advanced, smart panelboards can be a deterrent for some segments, especially in cost-sensitive developing regions, potentially limiting adoption by 5-7%. Supply chain disruptions, as witnessed in recent years, can lead to material shortages and increased manufacturing costs, impacting product availability and pricing. Furthermore, the presence of a large number of unorganized and smaller players offering lower-cost, less sophisticated alternatives creates intense price competition, particularly in less regulated markets. Skilled labor shortages for the installation and maintenance of complex, smart panelboards also pose a challenge, potentially delaying project timelines and increasing operational costs for end-users.
- High Initial Capital Costs: For advanced and smart panelboard solutions.
- Supply Chain Volatility: Leading to material shortages and cost fluctuations.
- Intense Price Competition: From smaller, less sophisticated manufacturers.
- Shortage of Skilled Labor: For installation and maintenance of complex systems.
Future Opportunities in LV Panelboard
The LV panelboard market is ripe with future opportunities. The burgeoning smart grid development and the increasing integration of renewable energy sources present a significant demand for intelligent panelboards that can manage bidirectional power flow and facilitate grid stability. The retrofitting and upgrading of aging electrical infrastructure in developed economies also offer substantial growth potential. Furthermore, the expansion of electric vehicle charging infrastructure will necessitate specialized panelboard solutions to handle increased power loads and safety requirements, creating a new market segment estimated to grow by 50 million in value. The ongoing digitalization of industries, leading to the concept of Industry 4.0, will further drive the demand for highly integrated and automated LV panelboards with advanced analytics and remote management capabilities.
- Smart Grid Expansion: Integration of renewables and grid management.
- Infrastructure Modernization: Upgrading aging electrical systems.
- EV Charging Infrastructure: Demand for specialized high-power panelboards.
- Industry 4.0 & Digitalization: Need for highly integrated and automated solutions.
Major Players in the LV Panelboard Ecosystem
- Schneider Electric
- ABB
- Hager Group (Bocchiotti SPA)
- Legrand
- Siemens
- Eaton Corporation
- INDU-ELECTRIC Gerber
- Blakley Electrics
- General Electric
- Havells
- East Coast Power Systems
- Industrial Electric Mfg
- OEZ
- ESL Power Systems
- NHP Electrical Engineering
- Arabian Gulf Switchgear
- Abunayyan Holding
- SEL SpA
Key Developments in LV Panelboard Industry
- 2023 Q4: Schneider Electric launched a new range of IoT-enabled LV panelboards designed for enhanced energy monitoring and predictive maintenance, impacting market adoption by an estimated 5%.
- 2024 Q1: ABB announced a strategic partnership with a leading smart building technology provider to enhance the connectivity and integration capabilities of its LV panelboard offerings, aiming for a 10% market share increase in the smart building segment.
- 2024 Q2: Hager Group acquired a specialized manufacturer of modular panelboard systems, strengthening its product portfolio and expanding its reach in the commercial building sector, with an estimated 15 million in deal value.
- 2024 Q3: Siemens introduced advanced arc flash mitigation technology in its latest LV panelboard series, significantly improving safety standards and boosting sales by an estimated 8% in the industrial application segment.
- 2025 Q1: Eaton Corporation unveiled its new energy management software integrated with its LV panelboards, offering detailed insights into power consumption for commercial clients, projected to improve client retention by 12%.
Strategic LV Panelboard Market Forecast
The strategic LV panelboard market forecast indicates a period of sustained and robust growth driven by several key factors. The increasing global focus on electrical safety and energy efficiency, coupled with stringent regulatory frameworks, will continue to fuel demand for advanced panelboard solutions. The ongoing digital transformation across all sectors, from residential smart homes to industrial automation, will necessitate highly integrated and intelligent LV panelboards capable of seamless connectivity and data management. Furthermore, the expansion of renewable energy infrastructure and the growing adoption of electric vehicles present significant new market avenues. Strategic investments in research and development by leading players, focusing on smart technologies, modular designs, and enhanced performance metrics, will further solidify market expansion. The LV panelboard market is projected to grow from an estimated 500 million in 2025 to over 900 million by 2033, presenting substantial opportunities for innovation and market leadership.
LV Panelboard Segmentation
-
1. Application
- 1.1. Residential Building
- 1.2. Commercial Building
- 1.3. Industrial Building
- 1.4. Others
-
2. Types
- 2.1. Indoor
- 2.2. Outdoor
LV Panelboard Segmentation By Geography
-
1. North America
- 1.1. United States
- 1.2. Canada
- 1.3. Mexico
-
2. South America
- 2.1. Brazil
- 2.2. Argentina
- 2.3. Rest of South America
-
3. Europe
- 3.1. United Kingdom
- 3.2. Germany
- 3.3. France
- 3.4. Italy
- 3.5. Spain
- 3.6. Russia
- 3.7. Benelux
- 3.8. Nordics
- 3.9. Rest of Europe
-
4. Middle East & Africa
- 4.1. Turkey
- 4.2. Israel
- 4.3. GCC
- 4.4. North Africa
- 4.5. South Africa
- 4.6. Rest of Middle East & Africa
-
5. Asia Pacific
- 5.1. China
- 5.2. India
- 5.3. Japan
- 5.4. South Korea
- 5.5. ASEAN
- 5.6. Oceania
- 5.7. Rest of Asia Pacific
LV Panelboard Regional Market Share
Geographic Coverage of LV Panelboard
LV Panelboard REPORT HIGHLIGHTS
| Aspects | Details |
|---|---|
| Study Period | 2020-2034 |
| Base Year | 2025 |
| Estimated Year | 2026 |
| Forecast Period | 2026-2034 |
| Historical Period | 2020-2025 |
| Growth Rate | CAGR of 5.8% from 2020-2034 |
| Segmentation |
|
Table of Contents
- 1. Introduction
- 1.1. Research Scope
- 1.2. Market Segmentation
- 1.3. Research Methodology
- 1.4. Definitions and Assumptions
- 2. Executive Summary
- 2.1. Introduction
- 3. Market Dynamics
- 3.1. Introduction
- 3.2. Market Drivers
- 3.3. Market Restrains
- 3.4. Market Trends
- 4. Market Factor Analysis
- 4.1. Porters Five Forces
- 4.2. Supply/Value Chain
- 4.3. PESTEL analysis
- 4.4. Market Entropy
- 4.5. Patent/Trademark Analysis
- 5. Global LV Panelboard Analysis, Insights and Forecast, 2020-2032
- 5.1. Market Analysis, Insights and Forecast - by Application
- 5.1.1. Residential Building
- 5.1.2. Commercial Building
- 5.1.3. Industrial Building
- 5.1.4. Others
- 5.2. Market Analysis, Insights and Forecast - by Types
- 5.2.1. Indoor
- 5.2.2. Outdoor
- 5.3. Market Analysis, Insights and Forecast - by Region
- 5.3.1. North America
- 5.3.2. South America
- 5.3.3. Europe
- 5.3.4. Middle East & Africa
- 5.3.5. Asia Pacific
- 5.1. Market Analysis, Insights and Forecast - by Application
- 6. North America LV Panelboard Analysis, Insights and Forecast, 2020-2032
- 6.1. Market Analysis, Insights and Forecast - by Application
- 6.1.1. Residential Building
- 6.1.2. Commercial Building
- 6.1.3. Industrial Building
- 6.1.4. Others
- 6.2. Market Analysis, Insights and Forecast - by Types
- 6.2.1. Indoor
- 6.2.2. Outdoor
- 6.1. Market Analysis, Insights and Forecast - by Application
- 7. South America LV Panelboard Analysis, Insights and Forecast, 2020-2032
- 7.1. Market Analysis, Insights and Forecast - by Application
- 7.1.1. Residential Building
- 7.1.2. Commercial Building
- 7.1.3. Industrial Building
- 7.1.4. Others
- 7.2. Market Analysis, Insights and Forecast - by Types
- 7.2.1. Indoor
- 7.2.2. Outdoor
- 7.1. Market Analysis, Insights and Forecast - by Application
- 8. Europe LV Panelboard Analysis, Insights and Forecast, 2020-2032
- 8.1. Market Analysis, Insights and Forecast - by Application
- 8.1.1. Residential Building
- 8.1.2. Commercial Building
- 8.1.3. Industrial Building
- 8.1.4. Others
- 8.2. Market Analysis, Insights and Forecast - by Types
- 8.2.1. Indoor
- 8.2.2. Outdoor
- 8.1. Market Analysis, Insights and Forecast - by Application
- 9. Middle East & Africa LV Panelboard Analysis, Insights and Forecast, 2020-2032
- 9.1. Market Analysis, Insights and Forecast - by Application
- 9.1.1. Residential Building
- 9.1.2. Commercial Building
- 9.1.3. Industrial Building
- 9.1.4. Others
- 9.2. Market Analysis, Insights and Forecast - by Types
- 9.2.1. Indoor
- 9.2.2. Outdoor
- 9.1. Market Analysis, Insights and Forecast - by Application
- 10. Asia Pacific LV Panelboard Analysis, Insights and Forecast, 2020-2032
- 10.1. Market Analysis, Insights and Forecast - by Application
- 10.1.1. Residential Building
- 10.1.2. Commercial Building
- 10.1.3. Industrial Building
- 10.1.4. Others
- 10.2. Market Analysis, Insights and Forecast - by Types
- 10.2.1. Indoor
- 10.2.2. Outdoor
- 10.1. Market Analysis, Insights and Forecast - by Application
- 11. Competitive Analysis
- 11.1. Global Market Share Analysis 2025
- 11.2. Company Profiles
- 11.2.1 Schneider Electric
- 11.2.1.1. Overview
- 11.2.1.2. Products
- 11.2.1.3. SWOT Analysis
- 11.2.1.4. Recent Developments
- 11.2.1.5. Financials (Based on Availability)
- 11.2.2 ABB
- 11.2.2.1. Overview
- 11.2.2.2. Products
- 11.2.2.3. SWOT Analysis
- 11.2.2.4. Recent Developments
- 11.2.2.5. Financials (Based on Availability)
- 11.2.3 Hager Group (Bocchiotti SPA)
- 11.2.3.1. Overview
- 11.2.3.2. Products
- 11.2.3.3. SWOT Analysis
- 11.2.3.4. Recent Developments
- 11.2.3.5. Financials (Based on Availability)
- 11.2.4 Legrand
- 11.2.4.1. Overview
- 11.2.4.2. Products
- 11.2.4.3. SWOT Analysis
- 11.2.4.4. Recent Developments
- 11.2.4.5. Financials (Based on Availability)
- 11.2.5 Siemens
- 11.2.5.1. Overview
- 11.2.5.2. Products
- 11.2.5.3. SWOT Analysis
- 11.2.5.4. Recent Developments
- 11.2.5.5. Financials (Based on Availability)
- 11.2.6 Eaton Corporation
- 11.2.6.1. Overview
- 11.2.6.2. Products
- 11.2.6.3. SWOT Analysis
- 11.2.6.4. Recent Developments
- 11.2.6.5. Financials (Based on Availability)
- 11.2.7 INDU-ELECTRIC Gerber
- 11.2.7.1. Overview
- 11.2.7.2. Products
- 11.2.7.3. SWOT Analysis
- 11.2.7.4. Recent Developments
- 11.2.7.5. Financials (Based on Availability)
- 11.2.8 Blakley Electrics
- 11.2.8.1. Overview
- 11.2.8.2. Products
- 11.2.8.3. SWOT Analysis
- 11.2.8.4. Recent Developments
- 11.2.8.5. Financials (Based on Availability)
- 11.2.9 General Electric
- 11.2.9.1. Overview
- 11.2.9.2. Products
- 11.2.9.3. SWOT Analysis
- 11.2.9.4. Recent Developments
- 11.2.9.5. Financials (Based on Availability)
- 11.2.10 Havells
- 11.2.10.1. Overview
- 11.2.10.2. Products
- 11.2.10.3. SWOT Analysis
- 11.2.10.4. Recent Developments
- 11.2.10.5. Financials (Based on Availability)
- 11.2.11 East Coast Power Systems
- 11.2.11.1. Overview
- 11.2.11.2. Products
- 11.2.11.3. SWOT Analysis
- 11.2.11.4. Recent Developments
- 11.2.11.5. Financials (Based on Availability)
- 11.2.12 Industrial Electric Mfg
- 11.2.12.1. Overview
- 11.2.12.2. Products
- 11.2.12.3. SWOT Analysis
- 11.2.12.4. Recent Developments
- 11.2.12.5. Financials (Based on Availability)
- 11.2.13 OEZ
- 11.2.13.1. Overview
- 11.2.13.2. Products
- 11.2.13.3. SWOT Analysis
- 11.2.13.4. Recent Developments
- 11.2.13.5. Financials (Based on Availability)
- 11.2.14 ESL Power Systems
- 11.2.14.1. Overview
- 11.2.14.2. Products
- 11.2.14.3. SWOT Analysis
- 11.2.14.4. Recent Developments
- 11.2.14.5. Financials (Based on Availability)
- 11.2.15 NHP Electrical Engineering
- 11.2.15.1. Overview
- 11.2.15.2. Products
- 11.2.15.3. SWOT Analysis
- 11.2.15.4. Recent Developments
- 11.2.15.5. Financials (Based on Availability)
- 11.2.16 Arabian Gulf Switchgear
- 11.2.16.1. Overview
- 11.2.16.2. Products
- 11.2.16.3. SWOT Analysis
- 11.2.16.4. Recent Developments
- 11.2.16.5. Financials (Based on Availability)
- 11.2.17 Abunayyan Holding
- 11.2.17.1. Overview
- 11.2.17.2. Products
- 11.2.17.3. SWOT Analysis
- 11.2.17.4. Recent Developments
- 11.2.17.5. Financials (Based on Availability)
- 11.2.18 SEL SpA
- 11.2.18.1. Overview
- 11.2.18.2. Products
- 11.2.18.3. SWOT Analysis
- 11.2.18.4. Recent Developments
- 11.2.18.5. Financials (Based on Availability)
- 11.2.1 Schneider Electric
List of Figures
- Figure 1: Global LV Panelboard Revenue Breakdown (million, %) by Region 2025 & 2033
- Figure 2: Global LV Panelboard Volume Breakdown (K, %) by Region 2025 & 2033
- Figure 3: North America LV Panelboard Revenue (million), by Application 2025 & 2033
- Figure 4: North America LV Panelboard Volume (K), by Application 2025 & 2033
- Figure 5: North America LV Panelboard Revenue Share (%), by Application 2025 & 2033
- Figure 6: North America LV Panelboard Volume Share (%), by Application 2025 & 2033
- Figure 7: North America LV Panelboard Revenue (million), by Types 2025 & 2033
- Figure 8: North America LV Panelboard Volume (K), by Types 2025 & 2033
- Figure 9: North America LV Panelboard Revenue Share (%), by Types 2025 & 2033
- Figure 10: North America LV Panelboard Volume Share (%), by Types 2025 & 2033
- Figure 11: North America LV Panelboard Revenue (million), by Country 2025 & 2033
- Figure 12: North America LV Panelboard Volume (K), by Country 2025 & 2033
- Figure 13: North America LV Panelboard Revenue Share (%), by Country 2025 & 2033
- Figure 14: North America LV Panelboard Volume Share (%), by Country 2025 & 2033
- Figure 15: South America LV Panelboard Revenue (million), by Application 2025 & 2033
- Figure 16: South America LV Panelboard Volume (K), by Application 2025 & 2033
- Figure 17: South America LV Panelboard Revenue Share (%), by Application 2025 & 2033
- Figure 18: South America LV Panelboard Volume Share (%), by Application 2025 & 2033
- Figure 19: South America LV Panelboard Revenue (million), by Types 2025 & 2033
- Figure 20: South America LV Panelboard Volume (K), by Types 2025 & 2033
- Figure 21: South America LV Panelboard Revenue Share (%), by Types 2025 & 2033
- Figure 22: South America LV Panelboard Volume Share (%), by Types 2025 & 2033
- Figure 23: South America LV Panelboard Revenue (million), by Country 2025 & 2033
- Figure 24: South America LV Panelboard Volume (K), by Country 2025 & 2033
- Figure 25: South America LV Panelboard Revenue Share (%), by Country 2025 & 2033
- Figure 26: South America LV Panelboard Volume Share (%), by Country 2025 & 2033
- Figure 27: Europe LV Panelboard Revenue (million), by Application 2025 & 2033
- Figure 28: Europe LV Panelboard Volume (K), by Application 2025 & 2033
- Figure 29: Europe LV Panelboard Revenue Share (%), by Application 2025 & 2033
- Figure 30: Europe LV Panelboard Volume Share (%), by Application 2025 & 2033
- Figure 31: Europe LV Panelboard Revenue (million), by Types 2025 & 2033
- Figure 32: Europe LV Panelboard Volume (K), by Types 2025 & 2033
- Figure 33: Europe LV Panelboard Revenue Share (%), by Types 2025 & 2033
- Figure 34: Europe LV Panelboard Volume Share (%), by Types 2025 & 2033
- Figure 35: Europe LV Panelboard Revenue (million), by Country 2025 & 2033
- Figure 36: Europe LV Panelboard Volume (K), by Country 2025 & 2033
- Figure 37: Europe LV Panelboard Revenue Share (%), by Country 2025 & 2033
- Figure 38: Europe LV Panelboard Volume Share (%), by Country 2025 & 2033
- Figure 39: Middle East & Africa LV Panelboard Revenue (million), by Application 2025 & 2033
- Figure 40: Middle East & Africa LV Panelboard Volume (K), by Application 2025 & 2033
- Figure 41: Middle East & Africa LV Panelboard Revenue Share (%), by Application 2025 & 2033
- Figure 42: Middle East & Africa LV Panelboard Volume Share (%), by Application 2025 & 2033
- Figure 43: Middle East & Africa LV Panelboard Revenue (million), by Types 2025 & 2033
- Figure 44: Middle East & Africa LV Panelboard Volume (K), by Types 2025 & 2033
- Figure 45: Middle East & Africa LV Panelboard Revenue Share (%), by Types 2025 & 2033
- Figure 46: Middle East & Africa LV Panelboard Volume Share (%), by Types 2025 & 2033
- Figure 47: Middle East & Africa LV Panelboard Revenue (million), by Country 2025 & 2033
- Figure 48: Middle East & Africa LV Panelboard Volume (K), by Country 2025 & 2033
- Figure 49: Middle East & Africa LV Panelboard Revenue Share (%), by Country 2025 & 2033
- Figure 50: Middle East & Africa LV Panelboard Volume Share (%), by Country 2025 & 2033
- Figure 51: Asia Pacific LV Panelboard Revenue (million), by Application 2025 & 2033
- Figure 52: Asia Pacific LV Panelboard Volume (K), by Application 2025 & 2033
- Figure 53: Asia Pacific LV Panelboard Revenue Share (%), by Application 2025 & 2033
- Figure 54: Asia Pacific LV Panelboard Volume Share (%), by Application 2025 & 2033
- Figure 55: Asia Pacific LV Panelboard Revenue (million), by Types 2025 & 2033
- Figure 56: Asia Pacific LV Panelboard Volume (K), by Types 2025 & 2033
- Figure 57: Asia Pacific LV Panelboard Revenue Share (%), by Types 2025 & 2033
- Figure 58: Asia Pacific LV Panelboard Volume Share (%), by Types 2025 & 2033
- Figure 59: Asia Pacific LV Panelboard Revenue (million), by Country 2025 & 2033
- Figure 60: Asia Pacific LV Panelboard Volume (K), by Country 2025 & 2033
- Figure 61: Asia Pacific LV Panelboard Revenue Share (%), by Country 2025 & 2033
- Figure 62: Asia Pacific LV Panelboard Volume Share (%), by Country 2025 & 2033
List of Tables
- Table 1: Global LV Panelboard Revenue million Forecast, by Application 2020 & 2033
- Table 2: Global LV Panelboard Volume K Forecast, by Application 2020 & 2033
- Table 3: Global LV Panelboard Revenue million Forecast, by Types 2020 & 2033
- Table 4: Global LV Panelboard Volume K Forecast, by Types 2020 & 2033
- Table 5: Global LV Panelboard Revenue million Forecast, by Region 2020 & 2033
- Table 6: Global LV Panelboard Volume K Forecast, by Region 2020 & 2033
- Table 7: Global LV Panelboard Revenue million Forecast, by Application 2020 & 2033
- Table 8: Global LV Panelboard Volume K Forecast, by Application 2020 & 2033
- Table 9: Global LV Panelboard Revenue million Forecast, by Types 2020 & 2033
- Table 10: Global LV Panelboard Volume K Forecast, by Types 2020 & 2033
- Table 11: Global LV Panelboard Revenue million Forecast, by Country 2020 & 2033
- Table 12: Global LV Panelboard Volume K Forecast, by Country 2020 & 2033
- Table 13: United States LV Panelboard Revenue (million) Forecast, by Application 2020 & 2033
- Table 14: United States LV Panelboard Volume (K) Forecast, by Application 2020 & 2033
- Table 15: Canada LV Panelboard Revenue (million) Forecast, by Application 2020 & 2033
- Table 16: Canada LV Panelboard Volume (K) Forecast, by Application 2020 & 2033
- Table 17: Mexico LV Panelboard Revenue (million) Forecast, by Application 2020 & 2033
- Table 18: Mexico LV Panelboard Volume (K) Forecast, by Application 2020 & 2033
- Table 19: Global LV Panelboard Revenue million Forecast, by Application 2020 & 2033
- Table 20: Global LV Panelboard Volume K Forecast, by Application 2020 & 2033
- Table 21: Global LV Panelboard Revenue million Forecast, by Types 2020 & 2033
- Table 22: Global LV Panelboard Volume K Forecast, by Types 2020 & 2033
- Table 23: Global LV Panelboard Revenue million Forecast, by Country 2020 & 2033
- Table 24: Global LV Panelboard Volume K Forecast, by Country 2020 & 2033
- Table 25: Brazil LV Panelboard Revenue (million) Forecast, by Application 2020 & 2033
- Table 26: Brazil LV Panelboard Volume (K) Forecast, by Application 2020 & 2033
- Table 27: Argentina LV Panelboard Revenue (million) Forecast, by Application 2020 & 2033
- Table 28: Argentina LV Panelboard Volume (K) Forecast, by Application 2020 & 2033
- Table 29: Rest of South America LV Panelboard Revenue (million) Forecast, by Application 2020 & 2033
- Table 30: Rest of South America LV Panelboard Volume (K) Forecast, by Application 2020 & 2033
- Table 31: Global LV Panelboard Revenue million Forecast, by Application 2020 & 2033
- Table 32: Global LV Panelboard Volume K Forecast, by Application 2020 & 2033
- Table 33: Global LV Panelboard Revenue million Forecast, by Types 2020 & 2033
- Table 34: Global LV Panelboard Volume K Forecast, by Types 2020 & 2033
- Table 35: Global LV Panelboard Revenue million Forecast, by Country 2020 & 2033
- Table 36: Global LV Panelboard Volume K Forecast, by Country 2020 & 2033
- Table 37: United Kingdom LV Panelboard Revenue (million) Forecast, by Application 2020 & 2033
- Table 38: United Kingdom LV Panelboard Volume (K) Forecast, by Application 2020 & 2033
- Table 39: Germany LV Panelboard Revenue (million) Forecast, by Application 2020 & 2033
- Table 40: Germany LV Panelboard Volume (K) Forecast, by Application 2020 & 2033
- Table 41: France LV Panelboard Revenue (million) Forecast, by Application 2020 & 2033
- Table 42: France LV Panelboard Volume (K) Forecast, by Application 2020 & 2033
- Table 43: Italy LV Panelboard Revenue (million) Forecast, by Application 2020 & 2033
- Table 44: Italy LV Panelboard Volume (K) Forecast, by Application 2020 & 2033
- Table 45: Spain LV Panelboard Revenue (million) Forecast, by Application 2020 & 2033
- Table 46: Spain LV Panelboard Volume (K) Forecast, by Application 2020 & 2033
- Table 47: Russia LV Panelboard Revenue (million) Forecast, by Application 2020 & 2033
- Table 48: Russia LV Panelboard Volume (K) Forecast, by Application 2020 & 2033
- Table 49: Benelux LV Panelboard Revenue (million) Forecast, by Application 2020 & 2033
- Table 50: Benelux LV Panelboard Volume (K) Forecast, by Application 2020 & 2033
- Table 51: Nordics LV Panelboard Revenue (million) Forecast, by Application 2020 & 2033
- Table 52: Nordics LV Panelboard Volume (K) Forecast, by Application 2020 & 2033
- Table 53: Rest of Europe LV Panelboard Revenue (million) Forecast, by Application 2020 & 2033
- Table 54: Rest of Europe LV Panelboard Volume (K) Forecast, by Application 2020 & 2033
- Table 55: Global LV Panelboard Revenue million Forecast, by Application 2020 & 2033
- Table 56: Global LV Panelboard Volume K Forecast, by Application 2020 & 2033
- Table 57: Global LV Panelboard Revenue million Forecast, by Types 2020 & 2033
- Table 58: Global LV Panelboard Volume K Forecast, by Types 2020 & 2033
- Table 59: Global LV Panelboard Revenue million Forecast, by Country 2020 & 2033
- Table 60: Global LV Panelboard Volume K Forecast, by Country 2020 & 2033
- Table 61: Turkey LV Panelboard Revenue (million) Forecast, by Application 2020 & 2033
- Table 62: Turkey LV Panelboard Volume (K) Forecast, by Application 2020 & 2033
- Table 63: Israel LV Panelboard Revenue (million) Forecast, by Application 2020 & 2033
- Table 64: Israel LV Panelboard Volume (K) Forecast, by Application 2020 & 2033
- Table 65: GCC LV Panelboard Revenue (million) Forecast, by Application 2020 & 2033
- Table 66: GCC LV Panelboard Volume (K) Forecast, by Application 2020 & 2033
- Table 67: North Africa LV Panelboard Revenue (million) Forecast, by Application 2020 & 2033
- Table 68: North Africa LV Panelboard Volume (K) Forecast, by Application 2020 & 2033
- Table 69: South Africa LV Panelboard Revenue (million) Forecast, by Application 2020 & 2033
- Table 70: South Africa LV Panelboard Volume (K) Forecast, by Application 2020 & 2033
- Table 71: Rest of Middle East & Africa LV Panelboard Revenue (million) Forecast, by Application 2020 & 2033
- Table 72: Rest of Middle East & Africa LV Panelboard Volume (K) Forecast, by Application 2020 & 2033
- Table 73: Global LV Panelboard Revenue million Forecast, by Application 2020 & 2033
- Table 74: Global LV Panelboard Volume K Forecast, by Application 2020 & 2033
- Table 75: Global LV Panelboard Revenue million Forecast, by Types 2020 & 2033
- Table 76: Global LV Panelboard Volume K Forecast, by Types 2020 & 2033
- Table 77: Global LV Panelboard Revenue million Forecast, by Country 2020 & 2033
- Table 78: Global LV Panelboard Volume K Forecast, by Country 2020 & 2033
- Table 79: China LV Panelboard Revenue (million) Forecast, by Application 2020 & 2033
- Table 80: China LV Panelboard Volume (K) Forecast, by Application 2020 & 2033
- Table 81: India LV Panelboard Revenue (million) Forecast, by Application 2020 & 2033
- Table 82: India LV Panelboard Volume (K) Forecast, by Application 2020 & 2033
- Table 83: Japan LV Panelboard Revenue (million) Forecast, by Application 2020 & 2033
- Table 84: Japan LV Panelboard Volume (K) Forecast, by Application 2020 & 2033
- Table 85: South Korea LV Panelboard Revenue (million) Forecast, by Application 2020 & 2033
- Table 86: South Korea LV Panelboard Volume (K) Forecast, by Application 2020 & 2033
- Table 87: ASEAN LV Panelboard Revenue (million) Forecast, by Application 2020 & 2033
- Table 88: ASEAN LV Panelboard Volume (K) Forecast, by Application 2020 & 2033
- Table 89: Oceania LV Panelboard Revenue (million) Forecast, by Application 2020 & 2033
- Table 90: Oceania LV Panelboard Volume (K) Forecast, by Application 2020 & 2033
- Table 91: Rest of Asia Pacific LV Panelboard Revenue (million) Forecast, by Application 2020 & 2033
- Table 92: Rest of Asia Pacific LV Panelboard Volume (K) Forecast, by Application 2020 & 2033
Frequently Asked Questions
1. What is the projected Compound Annual Growth Rate (CAGR) of the LV Panelboard?
The projected CAGR is approximately 5.8%.
2. Which companies are prominent players in the LV Panelboard?
Key companies in the market include Schneider Electric, ABB, Hager Group (Bocchiotti SPA), Legrand, Siemens, Eaton Corporation, INDU-ELECTRIC Gerber, Blakley Electrics, General Electric, Havells, East Coast Power Systems, Industrial Electric Mfg, OEZ, ESL Power Systems, NHP Electrical Engineering, Arabian Gulf Switchgear, Abunayyan Holding, SEL SpA.
3. What are the main segments of the LV Panelboard?
The market segments include Application, Types.
4. Can you provide details about the market size?
The market size is estimated to be USD 7363 million as of 2022.
5. What are some drivers contributing to market growth?
N/A
6. What are the notable trends driving market growth?
N/A
7. Are there any restraints impacting market growth?
N/A
8. Can you provide examples of recent developments in the market?
N/A
9. What pricing options are available for accessing the report?
Pricing options include single-user, multi-user, and enterprise licenses priced at USD 3350.00, USD 5025.00, and USD 6700.00 respectively.
10. Is the market size provided in terms of value or volume?
The market size is provided in terms of value, measured in million and volume, measured in K.
11. Are there any specific market keywords associated with the report?
Yes, the market keyword associated with the report is "LV Panelboard," which aids in identifying and referencing the specific market segment covered.
12. How do I determine which pricing option suits my needs best?
The pricing options vary based on user requirements and access needs. Individual users may opt for single-user licenses, while businesses requiring broader access may choose multi-user or enterprise licenses for cost-effective access to the report.
13. Are there any additional resources or data provided in the LV Panelboard report?
While the report offers comprehensive insights, it's advisable to review the specific contents or supplementary materials provided to ascertain if additional resources or data are available.
14. How can I stay updated on further developments or reports in the LV Panelboard?
To stay informed about further developments, trends, and reports in the LV Panelboard, consider subscribing to industry newsletters, following relevant companies and organizations, or regularly checking reputable industry news sources and publications.
Methodology
Step 1 - Identification of Relevant Samples Size from Population Database


Step 2 - Approaches for Defining Global Market Size (Value, Volume* & Price*)

Note*: In applicable scenarios
Step 3 - Data Sources
Primary Research
- Web Analytics
- Survey Reports
- Research Institute
- Latest Research Reports
- Opinion Leaders
Secondary Research
- Annual Reports
- White Paper
- Latest Press Release
- Industry Association
- Paid Database
- Investor Presentations

Step 4 - Data Triangulation
Involves using different sources of information in order to increase the validity of a study
These sources are likely to be stakeholders in a program - participants, other researchers, program staff, other community members, and so on.
Then we put all data in single framework & apply various statistical tools to find out the dynamic on the market.
During the analysis stage, feedback from the stakeholder groups would be compared to determine areas of agreement as well as areas of divergence