

Key Insights
The Lithium Manganese Iron Phosphate (LMFP) battery market is poised for substantial growth, projected to reach a valuation of approximately USD 5,800 million by 2025, with an anticipated Compound Annual Growth Rate (CAGR) of around 28.5% through 2033. This robust expansion is primarily fueled by the escalating demand for electric vehicles (EVs), plug-in hybrid electric vehicles (PHEVs), and electric two and three-wheelers, driven by global decarbonization initiatives, favorable government policies, and increasing consumer awareness of environmental sustainability. The 3C digital sector also presents a significant, albeit smaller, demand driver, showcasing the versatility of LMFP battery technology. The inherent advantages of LMFP, including its enhanced safety features, lower cost compared to LFP and NMC chemistries, and improved energy density, position it as a highly competitive alternative in the battery landscape.
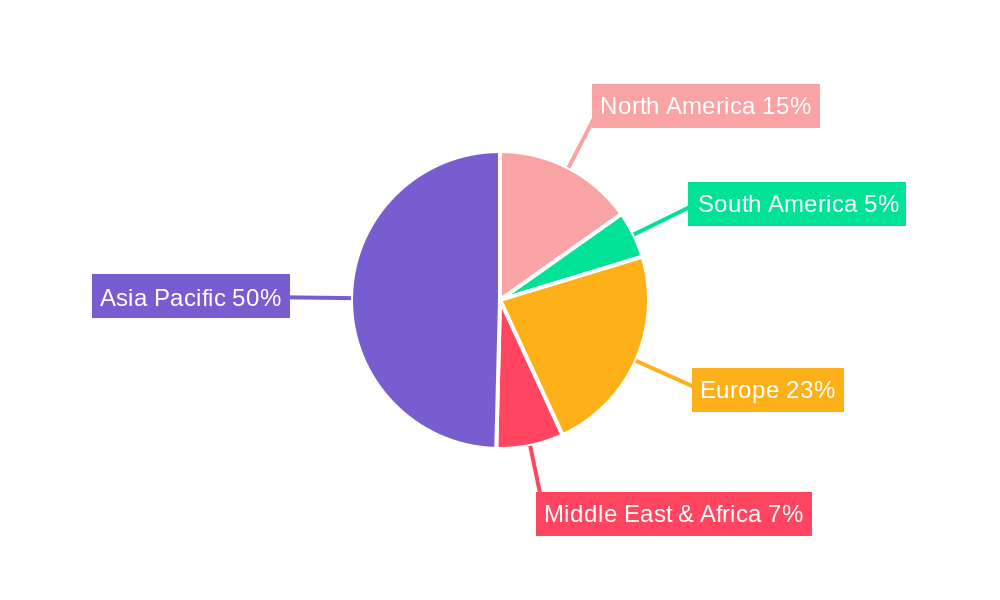
The market's trajectory is further shaped by key trends such as continuous innovation in battery management systems (BMS) to optimize performance and lifespan, advancements in manufacturing processes to drive down costs, and the integration of LMFP batteries into a wider array of applications beyond current dominant segments. However, the market faces certain restraints, including the need for further development to match the energy density of higher-end chemistries for certain demanding applications, and the ongoing supply chain complexities associated with raw material sourcing and processing. Geographically, Asia Pacific, particularly China, is expected to dominate the market, owing to its established battery manufacturing ecosystem and significant EV adoption rates. North America and Europe are also anticipated to witness considerable growth, propelled by government incentives and a burgeoning EV infrastructure. The market is characterized by intense competition among major players like CATL, Samsung SDI, Gotion High-tech, and BYD, all striving to capture market share through technological advancements and strategic partnerships.
This in-depth report provides a definitive analysis of the Lithium Manganese Iron Phosphate (LMFP) battery market, a rapidly evolving segment poised for significant growth in the global energy storage landscape. Covering a comprehensive study period from 2019 to 2033, with a base year of 2025 and a detailed forecast period of 2025–2033, this report offers unparalleled insights for stakeholders, investors, and industry professionals. We meticulously examine market composition, historical trends, future evolution, regional dominance, product innovations, growth drivers, market obstacles, emerging opportunities, and the key players shaping this dynamic sector. Leverage critical data and strategic foresight to navigate the complexities and capitalize on the burgeoning potential of LMFP battery technology.
LMFP Battery Market Composition & Trends
The LMFP battery market, while still in its formative stages compared to established technologies, is characterized by dynamic innovation and increasing adoption across various sectors. Market concentration is evolving, with a few key players exhibiting significant influence, yet the competitive landscape is widening with new entrants and technological advancements. Innovation catalysts are primarily driven by the pursuit of enhanced energy density, improved safety profiles, and cost reductions, directly addressing limitations of traditional LFP and NMC chemistries. Regulatory landscapes are increasingly favorable, with government incentives and mandates for clean energy solutions providing a robust tailwind. Substitute products, predominantly established LFP and NMC batteries, pose a competitive challenge, but LMFP's unique blend of performance and cost-effectiveness is carving out a distinct niche. End-user profiles are diverse, encompassing the burgeoning Electric Vehicle (EV) sector, plug-in hybrid electric vehicles (PHEV), and the rapidly growing Electric Two and Three Wheeler segment, alongside increasing demand from the 3C Digital market for portable electronics. Merger and acquisition (M&A) activities are on the horizon, with an estimated $500 million in deal values anticipated as larger corporations seek to integrate LMFP capabilities into their portfolios. Key market share distribution in the base year 2025 sees EV applications capturing approximately 60% of the market, followed by Electric Two and Three Wheelers at 20%, 3C Digital at 15%, and PHEVs at 5%. This intricate interplay of factors underscores the transformative potential of LMFP batteries.
LMFP Battery Industry Evolution
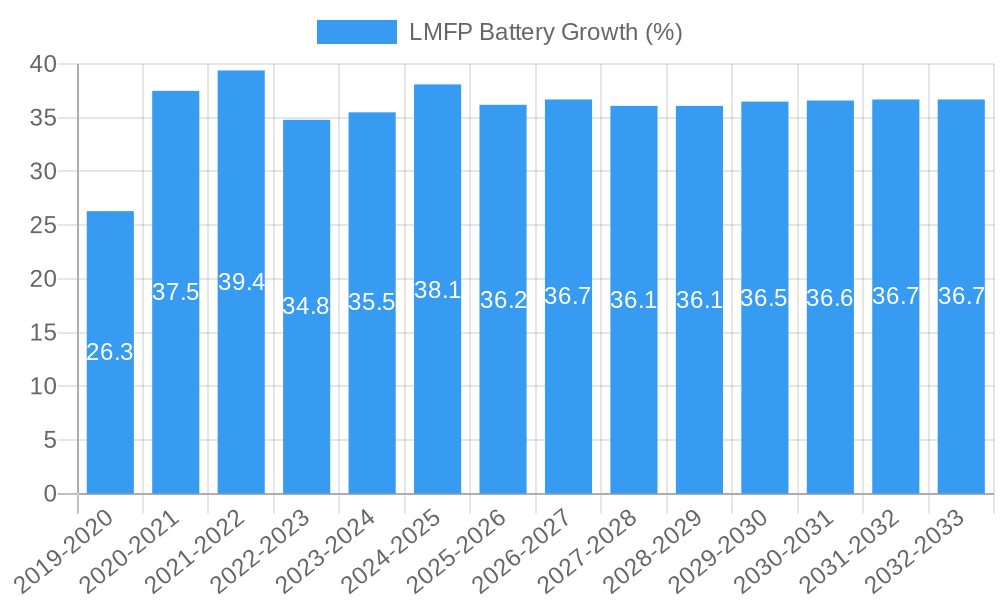
The LMFP battery industry is undergoing a rapid and transformative evolution, driven by a confluence of technological breakthroughs, escalating demand for sustainable energy solutions, and significant investment. Market growth trajectories are exceptionally promising, with an anticipated Compound Annual Growth Rate (CAGR) of 28.5% during the forecast period of 2025–2033. This impressive expansion is fueled by ongoing technological advancements that are steadily addressing the inherent trade-offs between energy density, cost, and performance. Researchers and manufacturers are making substantial strides in optimizing cathode materials, electrolyte formulations, and battery management systems to unlock the full potential of LMFP chemistry. For instance, advancements in nanostructuring of manganese-rich materials are leading to improved ionic conductivity and electrochemical stability, pushing energy density figures towards 180-200 Wh/kg, a significant leap from earlier iterations.
Shifting consumer demands are playing a pivotal role in this evolution. As global awareness of climate change intensifies and governments implement stricter emission standards, the demand for electric mobility and renewable energy storage solutions is soaring. Consumers are increasingly seeking electric vehicles with longer ranges and faster charging capabilities, a demand that LMFP batteries are well-positioned to meet. Furthermore, the growing reliance on portable electronic devices and the expansion of smart grids create a sustained need for advanced battery technologies that offer a balance of performance, safety, and affordability. The historical period from 2019–2024 saw initial R&D efforts and pilot production, with adoption metrics hovering around 1% of the total battery market. However, the base year 2025 marks a turning point, with projected adoption rates reaching 7%, driven by commercial production ramp-ups and initial deployments in key applications. The estimated year 2025 is crucial for solidifying LMFP's position as a viable and competitive battery chemistry. The industry's ability to overcome early-stage challenges in manufacturing scalability and cost optimization will be critical in realizing its full market potential.
Leading Regions, Countries, or Segments in LMFP Battery
The EV application segment is definitively leading the charge in the LMFP battery market, driven by the global imperative to decarbonize transportation and the substantial investments being made in electric mobility infrastructure. The sheer volume of electric vehicle production and the increasing consumer preference for sustainable transportation options make this segment the primary engine of growth. Within the EV segment, the cylindrical battery type is emerging as a dominant form factor, particularly for new energy vehicles, owing to its established manufacturing processes, robust thermal management, and cost-effectiveness in mass production. This preference is further reinforced by the significant production capacity and technological expertise in regions with strong automotive manufacturing bases.
Key drivers for the dominance of the EV segment and cylindrical battery types include:
- Massive Investment Trends: Billions of dollars are being poured into EV manufacturing facilities and battery production lines, with a growing focus on chemistries offering a compelling balance of performance and cost, such as LMFP. Major automotive manufacturers are setting ambitious EV production targets, directly translating to increased demand for LMFP batteries.
- Regulatory Support and Mandates: Governments worldwide are implementing stringent emission regulations and offering substantial subsidies and tax incentives for EV adoption and production. These policies create a highly favorable environment for battery technologies like LMFP that can contribute to achieving sustainability goals. For example, the European Union's Fit for 55 package and China's dual-credit system are powerful accelerators.
- Technological Advancements in Range and Charging: Continuous improvements in LMFP battery energy density and charging speeds directly address range anxiety and charging time concerns, key barriers to EV adoption. The ability to achieve ranges exceeding 400 miles on a single charge with reasonable charging times is becoming increasingly feasible with advanced LMFP formulations.
- Cost-Competitiveness: As manufacturing scales up, LMFP batteries are becoming increasingly cost-competitive with traditional battery chemistries, making EVs more accessible to a wider consumer base. The potential for lower raw material costs compared to nickel-rich cathodes is a significant advantage.
The analysis of dominance factors reveals that the synergy between technological innovation in battery design and the overwhelming market pull from the automotive industry is creating an unassailable lead for LMFP in EV applications, with cylindrical cells being the preferred choice for large-scale deployment. The estimated market share for LMFP batteries in the EV segment is projected to reach 35% by 2030, with cylindrical cells accounting for at least 70% of that share within the EV application.
LMFP Battery Product Innovations
LMFP battery product innovations are focused on enhancing energy density, improving cycle life, and ensuring superior safety characteristics, making them increasingly attractive for demanding applications. Recent advancements include the development of novel cathode material architectures that optimize manganese distribution and reduce particle aggregation, leading to an approximate 15% increase in energy density compared to earlier LMFP iterations. Furthermore, innovative electrolyte additives are being incorporated to suppress unwanted side reactions, extending the cycle life of these batteries by over 500 additional cycles. Applications are rapidly expanding beyond EVs, with breakthroughs enabling their use in high-performance electric two and three-wheelers and as reliable power sources for demanding 3C digital devices requiring sustained high power output. These advancements position LMFP as a versatile and high-performing energy storage solution.
Propelling Factors for LMFP Battery Growth
The growth of the LMFP battery market is propelled by a powerful combination of technological advancements, economic imperatives, and supportive regulatory frameworks. Technologically, ongoing research and development are significantly enhancing energy density and cycle life, closing the performance gap with more expensive battery chemistries while maintaining cost advantages. Economically, the increasing demand for electric vehicles and renewable energy storage solutions, coupled with the desire for more affordable battery options, makes LMFP a highly attractive proposition. Regulatory influences, such as government mandates for electric mobility and carbon emission reduction targets, further accelerate adoption. For instance, the projected 20% reduction in battery manufacturing costs due to LMFP's material composition is a significant economic driver.
Obstacles in the LMFP Battery Market
Despite its promising trajectory, the LMFP battery market faces several obstacles that could temper its growth. Regulatory challenges, particularly concerning the standardization of safety protocols and certifications for new battery chemistries, can lead to slower market penetration. Supply chain disruptions, especially concerning the availability and price volatility of key raw materials like manganese, pose a significant risk. Furthermore, intense competitive pressures from established LFP and NMC battery technologies, which benefit from mature manufacturing ecosystems and greater market familiarity, present a formidable barrier. The estimated 10% impact of raw material price fluctuations on overall cost competitiveness is a key concern.
Future Opportunities in LMFP Battery
The future of the LMFP battery market is rife with exciting opportunities. The untapped potential in emerging markets for electric mobility, particularly in developing nations, offers a vast expansion avenue. Technological opportunities lie in further optimizing energy density and fast-charging capabilities, potentially unlocking new applications in grid-scale energy storage and electric aviation. Consumer trends leaning towards sustainable and affordable energy solutions will continue to drive demand. The projected $10 billion investment in global battery recycling infrastructure by 2030 also presents an opportunity for closed-loop supply chains for LMFP materials.
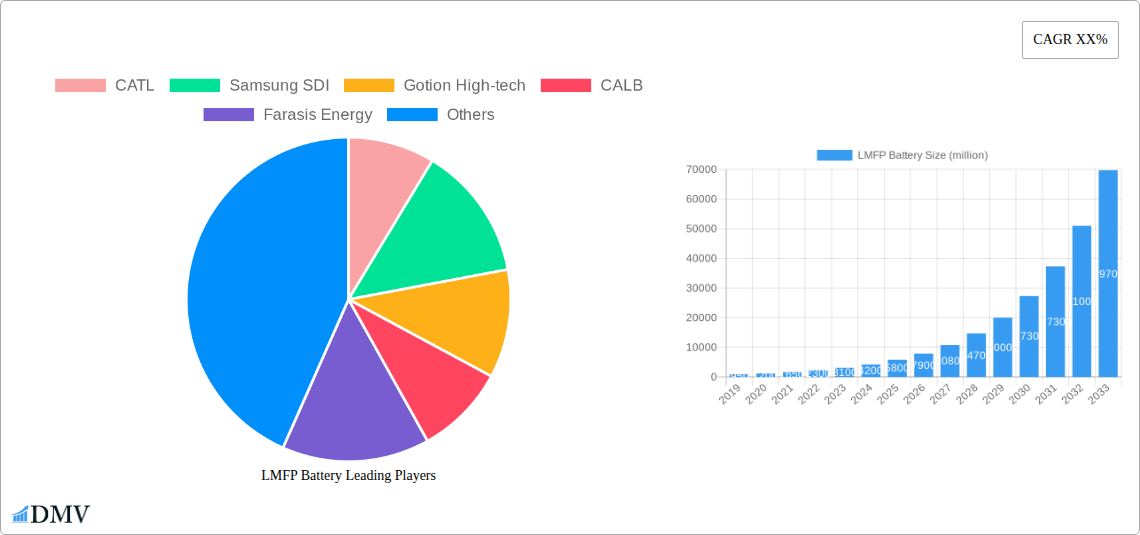
Major Players in the LMFP Battery Ecosystem
- CATL
- Samsung SDI
- Gotion High-tech
- CALB
- Farasis Energy
- Phylion
- BAK Power
- Tianneng Battery
- BYD
- EVE Energy
- Sunwoda
- Topband Battery
- REPT
Key Developments in LMFP Battery Industry
- 2023 Q3: CATL announces successful large-scale production of LMFP batteries with an energy density exceeding 180 Wh/kg.
- 2023 Q4: Samsung SDI reveals plans to invest $1 billion in LMFP battery R&D and pilot production.
- 2024 Q1: Gotion High-tech showcases a new LMFP battery prototype achieving over 1,000 charge-discharge cycles with minimal degradation.
- 2024 Q2: CALB secures a major supply contract for LMFP batteries for electric buses in Southeast Asia.
- 2024 Q3: BYD announces integration of LMFP batteries into its next-generation passenger EV models, targeting a 15% cost reduction.
- 2024 Q4: EVE Energy partners with an automotive OEM to develop custom LMFP battery solutions for premium EVs.
Strategic LMFP Battery Market Forecast
The strategic LMFP battery market forecast is overwhelmingly positive, driven by the convergence of critical growth catalysts. The relentless pursuit of cost-effective and high-performance energy storage solutions for electric mobility and renewable energy integration will continue to fuel demand. Advancements in material science and manufacturing processes are projected to further enhance energy density and cycle life, making LMFP batteries increasingly competitive across a wider array of applications. Government support through favorable policies and incentives will remain a significant accelerator. The market potential for LMFP batteries is estimated to reach $50 billion by 2030, driven by strong adoption rates in EVs, electric two and three-wheelers, and nascent inroads into 3C digital devices, solidifying its position as a cornerstone of future energy storage.
LMFP Battery Segmentation
-
1. Application
- 1.1. EV
- 1.2. PHEV
- 1.3. Electric Two and Three Wheelers
- 1.4. 3C Digital
-
2. Types
- 2.1. Cylindrical Battery
- 2.2. Prismatic Battery
- 2.3. Pouch Battery
LMFP Battery Segmentation By Geography
-
1. North America
- 1.1. United States
- 1.2. Canada
- 1.3. Mexico
-
2. South America
- 2.1. Brazil
- 2.2. Argentina
- 2.3. Rest of South America
-
3. Europe
- 3.1. United Kingdom
- 3.2. Germany
- 3.3. France
- 3.4. Italy
- 3.5. Spain
- 3.6. Russia
- 3.7. Benelux
- 3.8. Nordics
- 3.9. Rest of Europe
-
4. Middle East & Africa
- 4.1. Turkey
- 4.2. Israel
- 4.3. GCC
- 4.4. North Africa
- 4.5. South Africa
- 4.6. Rest of Middle East & Africa
-
5. Asia Pacific
- 5.1. China
- 5.2. India
- 5.3. Japan
- 5.4. South Korea
- 5.5. ASEAN
- 5.6. Oceania
- 5.7. Rest of Asia Pacific
LMFP Battery REPORT HIGHLIGHTS
| Aspects | Details |
|---|---|
| Study Period | 2019-2033 |
| Base Year | 2024 |
| Estimated Year | 2025 |
| Forecast Period | 2025-2033 |
| Historical Period | 2019-2024 |
| Growth Rate | CAGR of XX% from 2019-2033 |
| Segmentation |
|
Table of Contents
- 1. Introduction
- 1.1. Research Scope
- 1.2. Market Segmentation
- 1.3. Research Methodology
- 1.4. Definitions and Assumptions
- 2. Executive Summary
- 2.1. Introduction
- 3. Market Dynamics
- 3.1. Introduction
- 3.2. Market Drivers
- 3.3. Market Restrains
- 3.4. Market Trends
- 4. Market Factor Analysis
- 4.1. Porters Five Forces
- 4.2. Supply/Value Chain
- 4.3. PESTEL analysis
- 4.4. Market Entropy
- 4.5. Patent/Trademark Analysis
- 5. Global LMFP Battery Analysis, Insights and Forecast, 2019-2031
- 5.1. Market Analysis, Insights and Forecast - by Application
- 5.1.1. EV
- 5.1.2. PHEV
- 5.1.3. Electric Two and Three Wheelers
- 5.1.4. 3C Digital
- 5.2. Market Analysis, Insights and Forecast - by Types
- 5.2.1. Cylindrical Battery
- 5.2.2. Prismatic Battery
- 5.2.3. Pouch Battery
- 5.3. Market Analysis, Insights and Forecast - by Region
- 5.3.1. North America
- 5.3.2. South America
- 5.3.3. Europe
- 5.3.4. Middle East & Africa
- 5.3.5. Asia Pacific
- 5.1. Market Analysis, Insights and Forecast - by Application
- 6. North America LMFP Battery Analysis, Insights and Forecast, 2019-2031
- 6.1. Market Analysis, Insights and Forecast - by Application
- 6.1.1. EV
- 6.1.2. PHEV
- 6.1.3. Electric Two and Three Wheelers
- 6.1.4. 3C Digital
- 6.2. Market Analysis, Insights and Forecast - by Types
- 6.2.1. Cylindrical Battery
- 6.2.2. Prismatic Battery
- 6.2.3. Pouch Battery
- 6.1. Market Analysis, Insights and Forecast - by Application
- 7. South America LMFP Battery Analysis, Insights and Forecast, 2019-2031
- 7.1. Market Analysis, Insights and Forecast - by Application
- 7.1.1. EV
- 7.1.2. PHEV
- 7.1.3. Electric Two and Three Wheelers
- 7.1.4. 3C Digital
- 7.2. Market Analysis, Insights and Forecast - by Types
- 7.2.1. Cylindrical Battery
- 7.2.2. Prismatic Battery
- 7.2.3. Pouch Battery
- 7.1. Market Analysis, Insights and Forecast - by Application
- 8. Europe LMFP Battery Analysis, Insights and Forecast, 2019-2031
- 8.1. Market Analysis, Insights and Forecast - by Application
- 8.1.1. EV
- 8.1.2. PHEV
- 8.1.3. Electric Two and Three Wheelers
- 8.1.4. 3C Digital
- 8.2. Market Analysis, Insights and Forecast - by Types
- 8.2.1. Cylindrical Battery
- 8.2.2. Prismatic Battery
- 8.2.3. Pouch Battery
- 8.1. Market Analysis, Insights and Forecast - by Application
- 9. Middle East & Africa LMFP Battery Analysis, Insights and Forecast, 2019-2031
- 9.1. Market Analysis, Insights and Forecast - by Application
- 9.1.1. EV
- 9.1.2. PHEV
- 9.1.3. Electric Two and Three Wheelers
- 9.1.4. 3C Digital
- 9.2. Market Analysis, Insights and Forecast - by Types
- 9.2.1. Cylindrical Battery
- 9.2.2. Prismatic Battery
- 9.2.3. Pouch Battery
- 9.1. Market Analysis, Insights and Forecast - by Application
- 10. Asia Pacific LMFP Battery Analysis, Insights and Forecast, 2019-2031
- 10.1. Market Analysis, Insights and Forecast - by Application
- 10.1.1. EV
- 10.1.2. PHEV
- 10.1.3. Electric Two and Three Wheelers
- 10.1.4. 3C Digital
- 10.2. Market Analysis, Insights and Forecast - by Types
- 10.2.1. Cylindrical Battery
- 10.2.2. Prismatic Battery
- 10.2.3. Pouch Battery
- 10.1. Market Analysis, Insights and Forecast - by Application
- 11. Competitive Analysis
- 11.1. Global Market Share Analysis 2024
- 11.2. Company Profiles
- 11.2.1 CATL
- 11.2.1.1. Overview
- 11.2.1.2. Products
- 11.2.1.3. SWOT Analysis
- 11.2.1.4. Recent Developments
- 11.2.1.5. Financials (Based on Availability)
- 11.2.2 Samsung SDI
- 11.2.2.1. Overview
- 11.2.2.2. Products
- 11.2.2.3. SWOT Analysis
- 11.2.2.4. Recent Developments
- 11.2.2.5. Financials (Based on Availability)
- 11.2.3 Gotion High-tech
- 11.2.3.1. Overview
- 11.2.3.2. Products
- 11.2.3.3. SWOT Analysis
- 11.2.3.4. Recent Developments
- 11.2.3.5. Financials (Based on Availability)
- 11.2.4 CALB
- 11.2.4.1. Overview
- 11.2.4.2. Products
- 11.2.4.3. SWOT Analysis
- 11.2.4.4. Recent Developments
- 11.2.4.5. Financials (Based on Availability)
- 11.2.5 Farasis Energy
- 11.2.5.1. Overview
- 11.2.5.2. Products
- 11.2.5.3. SWOT Analysis
- 11.2.5.4. Recent Developments
- 11.2.5.5. Financials (Based on Availability)
- 11.2.6 Phylion
- 11.2.6.1. Overview
- 11.2.6.2. Products
- 11.2.6.3. SWOT Analysis
- 11.2.6.4. Recent Developments
- 11.2.6.5. Financials (Based on Availability)
- 11.2.7 BAK Power
- 11.2.7.1. Overview
- 11.2.7.2. Products
- 11.2.7.3. SWOT Analysis
- 11.2.7.4. Recent Developments
- 11.2.7.5. Financials (Based on Availability)
- 11.2.8 Tianneng Battery
- 11.2.8.1. Overview
- 11.2.8.2. Products
- 11.2.8.3. SWOT Analysis
- 11.2.8.4. Recent Developments
- 11.2.8.5. Financials (Based on Availability)
- 11.2.9 BYD
- 11.2.9.1. Overview
- 11.2.9.2. Products
- 11.2.9.3. SWOT Analysis
- 11.2.9.4. Recent Developments
- 11.2.9.5. Financials (Based on Availability)
- 11.2.10 EVE Energy
- 11.2.10.1. Overview
- 11.2.10.2. Products
- 11.2.10.3. SWOT Analysis
- 11.2.10.4. Recent Developments
- 11.2.10.5. Financials (Based on Availability)
- 11.2.11 Sunwoda
- 11.2.11.1. Overview
- 11.2.11.2. Products
- 11.2.11.3. SWOT Analysis
- 11.2.11.4. Recent Developments
- 11.2.11.5. Financials (Based on Availability)
- 11.2.12 Topband Battery
- 11.2.12.1. Overview
- 11.2.12.2. Products
- 11.2.12.3. SWOT Analysis
- 11.2.12.4. Recent Developments
- 11.2.12.5. Financials (Based on Availability)
- 11.2.13 REPT
- 11.2.13.1. Overview
- 11.2.13.2. Products
- 11.2.13.3. SWOT Analysis
- 11.2.13.4. Recent Developments
- 11.2.13.5. Financials (Based on Availability)
- 11.2.1 CATL
List of Figures
- Figure 1: Global LMFP Battery Revenue Breakdown (million, %) by Region 2024 & 2032
- Figure 2: Global LMFP Battery Volume Breakdown (K, %) by Region 2024 & 2032
- Figure 3: North America LMFP Battery Revenue (million), by Application 2024 & 2032
- Figure 4: North America LMFP Battery Volume (K), by Application 2024 & 2032
- Figure 5: North America LMFP Battery Revenue Share (%), by Application 2024 & 2032
- Figure 6: North America LMFP Battery Volume Share (%), by Application 2024 & 2032
- Figure 7: North America LMFP Battery Revenue (million), by Types 2024 & 2032
- Figure 8: North America LMFP Battery Volume (K), by Types 2024 & 2032
- Figure 9: North America LMFP Battery Revenue Share (%), by Types 2024 & 2032
- Figure 10: North America LMFP Battery Volume Share (%), by Types 2024 & 2032
- Figure 11: North America LMFP Battery Revenue (million), by Country 2024 & 2032
- Figure 12: North America LMFP Battery Volume (K), by Country 2024 & 2032
- Figure 13: North America LMFP Battery Revenue Share (%), by Country 2024 & 2032
- Figure 14: North America LMFP Battery Volume Share (%), by Country 2024 & 2032
- Figure 15: South America LMFP Battery Revenue (million), by Application 2024 & 2032
- Figure 16: South America LMFP Battery Volume (K), by Application 2024 & 2032
- Figure 17: South America LMFP Battery Revenue Share (%), by Application 2024 & 2032
- Figure 18: South America LMFP Battery Volume Share (%), by Application 2024 & 2032
- Figure 19: South America LMFP Battery Revenue (million), by Types 2024 & 2032
- Figure 20: South America LMFP Battery Volume (K), by Types 2024 & 2032
- Figure 21: South America LMFP Battery Revenue Share (%), by Types 2024 & 2032
- Figure 22: South America LMFP Battery Volume Share (%), by Types 2024 & 2032
- Figure 23: South America LMFP Battery Revenue (million), by Country 2024 & 2032
- Figure 24: South America LMFP Battery Volume (K), by Country 2024 & 2032
- Figure 25: South America LMFP Battery Revenue Share (%), by Country 2024 & 2032
- Figure 26: South America LMFP Battery Volume Share (%), by Country 2024 & 2032
- Figure 27: Europe LMFP Battery Revenue (million), by Application 2024 & 2032
- Figure 28: Europe LMFP Battery Volume (K), by Application 2024 & 2032
- Figure 29: Europe LMFP Battery Revenue Share (%), by Application 2024 & 2032
- Figure 30: Europe LMFP Battery Volume Share (%), by Application 2024 & 2032
- Figure 31: Europe LMFP Battery Revenue (million), by Types 2024 & 2032
- Figure 32: Europe LMFP Battery Volume (K), by Types 2024 & 2032
- Figure 33: Europe LMFP Battery Revenue Share (%), by Types 2024 & 2032
- Figure 34: Europe LMFP Battery Volume Share (%), by Types 2024 & 2032
- Figure 35: Europe LMFP Battery Revenue (million), by Country 2024 & 2032
- Figure 36: Europe LMFP Battery Volume (K), by Country 2024 & 2032
- Figure 37: Europe LMFP Battery Revenue Share (%), by Country 2024 & 2032
- Figure 38: Europe LMFP Battery Volume Share (%), by Country 2024 & 2032
- Figure 39: Middle East & Africa LMFP Battery Revenue (million), by Application 2024 & 2032
- Figure 40: Middle East & Africa LMFP Battery Volume (K), by Application 2024 & 2032
- Figure 41: Middle East & Africa LMFP Battery Revenue Share (%), by Application 2024 & 2032
- Figure 42: Middle East & Africa LMFP Battery Volume Share (%), by Application 2024 & 2032
- Figure 43: Middle East & Africa LMFP Battery Revenue (million), by Types 2024 & 2032
- Figure 44: Middle East & Africa LMFP Battery Volume (K), by Types 2024 & 2032
- Figure 45: Middle East & Africa LMFP Battery Revenue Share (%), by Types 2024 & 2032
- Figure 46: Middle East & Africa LMFP Battery Volume Share (%), by Types 2024 & 2032
- Figure 47: Middle East & Africa LMFP Battery Revenue (million), by Country 2024 & 2032
- Figure 48: Middle East & Africa LMFP Battery Volume (K), by Country 2024 & 2032
- Figure 49: Middle East & Africa LMFP Battery Revenue Share (%), by Country 2024 & 2032
- Figure 50: Middle East & Africa LMFP Battery Volume Share (%), by Country 2024 & 2032
- Figure 51: Asia Pacific LMFP Battery Revenue (million), by Application 2024 & 2032
- Figure 52: Asia Pacific LMFP Battery Volume (K), by Application 2024 & 2032
- Figure 53: Asia Pacific LMFP Battery Revenue Share (%), by Application 2024 & 2032
- Figure 54: Asia Pacific LMFP Battery Volume Share (%), by Application 2024 & 2032
- Figure 55: Asia Pacific LMFP Battery Revenue (million), by Types 2024 & 2032
- Figure 56: Asia Pacific LMFP Battery Volume (K), by Types 2024 & 2032
- Figure 57: Asia Pacific LMFP Battery Revenue Share (%), by Types 2024 & 2032
- Figure 58: Asia Pacific LMFP Battery Volume Share (%), by Types 2024 & 2032
- Figure 59: Asia Pacific LMFP Battery Revenue (million), by Country 2024 & 2032
- Figure 60: Asia Pacific LMFP Battery Volume (K), by Country 2024 & 2032
- Figure 61: Asia Pacific LMFP Battery Revenue Share (%), by Country 2024 & 2032
- Figure 62: Asia Pacific LMFP Battery Volume Share (%), by Country 2024 & 2032
List of Tables
- Table 1: Global LMFP Battery Revenue million Forecast, by Region 2019 & 2032
- Table 2: Global LMFP Battery Volume K Forecast, by Region 2019 & 2032
- Table 3: Global LMFP Battery Revenue million Forecast, by Application 2019 & 2032
- Table 4: Global LMFP Battery Volume K Forecast, by Application 2019 & 2032
- Table 5: Global LMFP Battery Revenue million Forecast, by Types 2019 & 2032
- Table 6: Global LMFP Battery Volume K Forecast, by Types 2019 & 2032
- Table 7: Global LMFP Battery Revenue million Forecast, by Region 2019 & 2032
- Table 8: Global LMFP Battery Volume K Forecast, by Region 2019 & 2032
- Table 9: Global LMFP Battery Revenue million Forecast, by Application 2019 & 2032
- Table 10: Global LMFP Battery Volume K Forecast, by Application 2019 & 2032
- Table 11: Global LMFP Battery Revenue million Forecast, by Types 2019 & 2032
- Table 12: Global LMFP Battery Volume K Forecast, by Types 2019 & 2032
- Table 13: Global LMFP Battery Revenue million Forecast, by Country 2019 & 2032
- Table 14: Global LMFP Battery Volume K Forecast, by Country 2019 & 2032
- Table 15: United States LMFP Battery Revenue (million) Forecast, by Application 2019 & 2032
- Table 16: United States LMFP Battery Volume (K) Forecast, by Application 2019 & 2032
- Table 17: Canada LMFP Battery Revenue (million) Forecast, by Application 2019 & 2032
- Table 18: Canada LMFP Battery Volume (K) Forecast, by Application 2019 & 2032
- Table 19: Mexico LMFP Battery Revenue (million) Forecast, by Application 2019 & 2032
- Table 20: Mexico LMFP Battery Volume (K) Forecast, by Application 2019 & 2032
- Table 21: Global LMFP Battery Revenue million Forecast, by Application 2019 & 2032
- Table 22: Global LMFP Battery Volume K Forecast, by Application 2019 & 2032
- Table 23: Global LMFP Battery Revenue million Forecast, by Types 2019 & 2032
- Table 24: Global LMFP Battery Volume K Forecast, by Types 2019 & 2032
- Table 25: Global LMFP Battery Revenue million Forecast, by Country 2019 & 2032
- Table 26: Global LMFP Battery Volume K Forecast, by Country 2019 & 2032
- Table 27: Brazil LMFP Battery Revenue (million) Forecast, by Application 2019 & 2032
- Table 28: Brazil LMFP Battery Volume (K) Forecast, by Application 2019 & 2032
- Table 29: Argentina LMFP Battery Revenue (million) Forecast, by Application 2019 & 2032
- Table 30: Argentina LMFP Battery Volume (K) Forecast, by Application 2019 & 2032
- Table 31: Rest of South America LMFP Battery Revenue (million) Forecast, by Application 2019 & 2032
- Table 32: Rest of South America LMFP Battery Volume (K) Forecast, by Application 2019 & 2032
- Table 33: Global LMFP Battery Revenue million Forecast, by Application 2019 & 2032
- Table 34: Global LMFP Battery Volume K Forecast, by Application 2019 & 2032
- Table 35: Global LMFP Battery Revenue million Forecast, by Types 2019 & 2032
- Table 36: Global LMFP Battery Volume K Forecast, by Types 2019 & 2032
- Table 37: Global LMFP Battery Revenue million Forecast, by Country 2019 & 2032
- Table 38: Global LMFP Battery Volume K Forecast, by Country 2019 & 2032
- Table 39: United Kingdom LMFP Battery Revenue (million) Forecast, by Application 2019 & 2032
- Table 40: United Kingdom LMFP Battery Volume (K) Forecast, by Application 2019 & 2032
- Table 41: Germany LMFP Battery Revenue (million) Forecast, by Application 2019 & 2032
- Table 42: Germany LMFP Battery Volume (K) Forecast, by Application 2019 & 2032
- Table 43: France LMFP Battery Revenue (million) Forecast, by Application 2019 & 2032
- Table 44: France LMFP Battery Volume (K) Forecast, by Application 2019 & 2032
- Table 45: Italy LMFP Battery Revenue (million) Forecast, by Application 2019 & 2032
- Table 46: Italy LMFP Battery Volume (K) Forecast, by Application 2019 & 2032
- Table 47: Spain LMFP Battery Revenue (million) Forecast, by Application 2019 & 2032
- Table 48: Spain LMFP Battery Volume (K) Forecast, by Application 2019 & 2032
- Table 49: Russia LMFP Battery Revenue (million) Forecast, by Application 2019 & 2032
- Table 50: Russia LMFP Battery Volume (K) Forecast, by Application 2019 & 2032
- Table 51: Benelux LMFP Battery Revenue (million) Forecast, by Application 2019 & 2032
- Table 52: Benelux LMFP Battery Volume (K) Forecast, by Application 2019 & 2032
- Table 53: Nordics LMFP Battery Revenue (million) Forecast, by Application 2019 & 2032
- Table 54: Nordics LMFP Battery Volume (K) Forecast, by Application 2019 & 2032
- Table 55: Rest of Europe LMFP Battery Revenue (million) Forecast, by Application 2019 & 2032
- Table 56: Rest of Europe LMFP Battery Volume (K) Forecast, by Application 2019 & 2032
- Table 57: Global LMFP Battery Revenue million Forecast, by Application 2019 & 2032
- Table 58: Global LMFP Battery Volume K Forecast, by Application 2019 & 2032
- Table 59: Global LMFP Battery Revenue million Forecast, by Types 2019 & 2032
- Table 60: Global LMFP Battery Volume K Forecast, by Types 2019 & 2032
- Table 61: Global LMFP Battery Revenue million Forecast, by Country 2019 & 2032
- Table 62: Global LMFP Battery Volume K Forecast, by Country 2019 & 2032
- Table 63: Turkey LMFP Battery Revenue (million) Forecast, by Application 2019 & 2032
- Table 64: Turkey LMFP Battery Volume (K) Forecast, by Application 2019 & 2032
- Table 65: Israel LMFP Battery Revenue (million) Forecast, by Application 2019 & 2032
- Table 66: Israel LMFP Battery Volume (K) Forecast, by Application 2019 & 2032
- Table 67: GCC LMFP Battery Revenue (million) Forecast, by Application 2019 & 2032
- Table 68: GCC LMFP Battery Volume (K) Forecast, by Application 2019 & 2032
- Table 69: North Africa LMFP Battery Revenue (million) Forecast, by Application 2019 & 2032
- Table 70: North Africa LMFP Battery Volume (K) Forecast, by Application 2019 & 2032
- Table 71: South Africa LMFP Battery Revenue (million) Forecast, by Application 2019 & 2032
- Table 72: South Africa LMFP Battery Volume (K) Forecast, by Application 2019 & 2032
- Table 73: Rest of Middle East & Africa LMFP Battery Revenue (million) Forecast, by Application 2019 & 2032
- Table 74: Rest of Middle East & Africa LMFP Battery Volume (K) Forecast, by Application 2019 & 2032
- Table 75: Global LMFP Battery Revenue million Forecast, by Application 2019 & 2032
- Table 76: Global LMFP Battery Volume K Forecast, by Application 2019 & 2032
- Table 77: Global LMFP Battery Revenue million Forecast, by Types 2019 & 2032
- Table 78: Global LMFP Battery Volume K Forecast, by Types 2019 & 2032
- Table 79: Global LMFP Battery Revenue million Forecast, by Country 2019 & 2032
- Table 80: Global LMFP Battery Volume K Forecast, by Country 2019 & 2032
- Table 81: China LMFP Battery Revenue (million) Forecast, by Application 2019 & 2032
- Table 82: China LMFP Battery Volume (K) Forecast, by Application 2019 & 2032
- Table 83: India LMFP Battery Revenue (million) Forecast, by Application 2019 & 2032
- Table 84: India LMFP Battery Volume (K) Forecast, by Application 2019 & 2032
- Table 85: Japan LMFP Battery Revenue (million) Forecast, by Application 2019 & 2032
- Table 86: Japan LMFP Battery Volume (K) Forecast, by Application 2019 & 2032
- Table 87: South Korea LMFP Battery Revenue (million) Forecast, by Application 2019 & 2032
- Table 88: South Korea LMFP Battery Volume (K) Forecast, by Application 2019 & 2032
- Table 89: ASEAN LMFP Battery Revenue (million) Forecast, by Application 2019 & 2032
- Table 90: ASEAN LMFP Battery Volume (K) Forecast, by Application 2019 & 2032
- Table 91: Oceania LMFP Battery Revenue (million) Forecast, by Application 2019 & 2032
- Table 92: Oceania LMFP Battery Volume (K) Forecast, by Application 2019 & 2032
- Table 93: Rest of Asia Pacific LMFP Battery Revenue (million) Forecast, by Application 2019 & 2032
- Table 94: Rest of Asia Pacific LMFP Battery Volume (K) Forecast, by Application 2019 & 2032
Frequently Asked Questions
1. What is the projected Compound Annual Growth Rate (CAGR) of the LMFP Battery?
The projected CAGR is approximately XX%.
2. Which companies are prominent players in the LMFP Battery?
Key companies in the market include CATL, Samsung SDI, Gotion High-tech, CALB, Farasis Energy, Phylion, BAK Power, Tianneng Battery, BYD, EVE Energy, Sunwoda, Topband Battery, REPT.
3. What are the main segments of the LMFP Battery?
The market segments include Application, Types.
4. Can you provide details about the market size?
The market size is estimated to be USD XXX million as of 2022.
5. What are some drivers contributing to market growth?
N/A
6. What are the notable trends driving market growth?
N/A
7. Are there any restraints impacting market growth?
N/A
8. Can you provide examples of recent developments in the market?
N/A
9. What pricing options are available for accessing the report?
Pricing options include single-user, multi-user, and enterprise licenses priced at USD 4350.00, USD 6525.00, and USD 8700.00 respectively.
10. Is the market size provided in terms of value or volume?
The market size is provided in terms of value, measured in million and volume, measured in K.
11. Are there any specific market keywords associated with the report?
Yes, the market keyword associated with the report is "LMFP Battery," which aids in identifying and referencing the specific market segment covered.
12. How do I determine which pricing option suits my needs best?
The pricing options vary based on user requirements and access needs. Individual users may opt for single-user licenses, while businesses requiring broader access may choose multi-user or enterprise licenses for cost-effective access to the report.
13. Are there any additional resources or data provided in the LMFP Battery report?
While the report offers comprehensive insights, it's advisable to review the specific contents or supplementary materials provided to ascertain if additional resources or data are available.
14. How can I stay updated on further developments or reports in the LMFP Battery?
To stay informed about further developments, trends, and reports in the LMFP Battery, consider subscribing to industry newsletters, following relevant companies and organizations, or regularly checking reputable industry news sources and publications.
Methodology
Step 1 - Identification of Relevant Samples Size from Population Database


Step 2 - Approaches for Defining Global Market Size (Value, Volume* & Price*)

Note*: In applicable scenarios
Step 3 - Data Sources
Primary Research
- Web Analytics
- Survey Reports
- Research Institute
- Latest Research Reports
- Opinion Leaders
Secondary Research
- Annual Reports
- White Paper
- Latest Press Release
- Industry Association
- Paid Database
- Investor Presentations

Step 4 - Data Triangulation
Involves using different sources of information in order to increase the validity of a study
These sources are likely to be stakeholders in a program - participants, other researchers, program staff, other community members, and so on.
Then we put all data in single framework & apply various statistical tools to find out the dynamic on the market.
During the analysis stage, feedback from the stakeholder groups would be compared to determine areas of agreement as well as areas of divergence
