

Key Insights
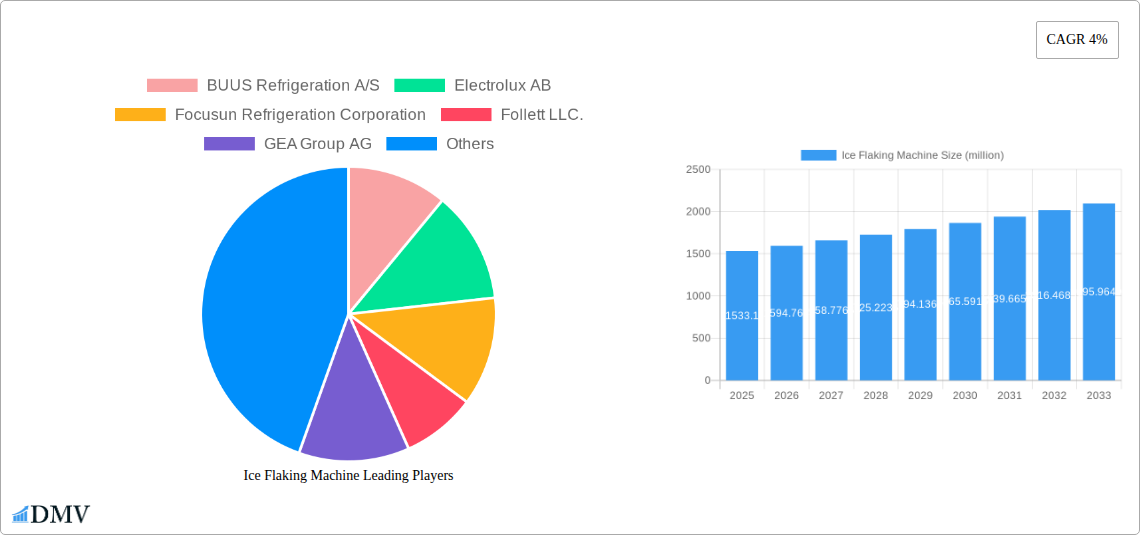
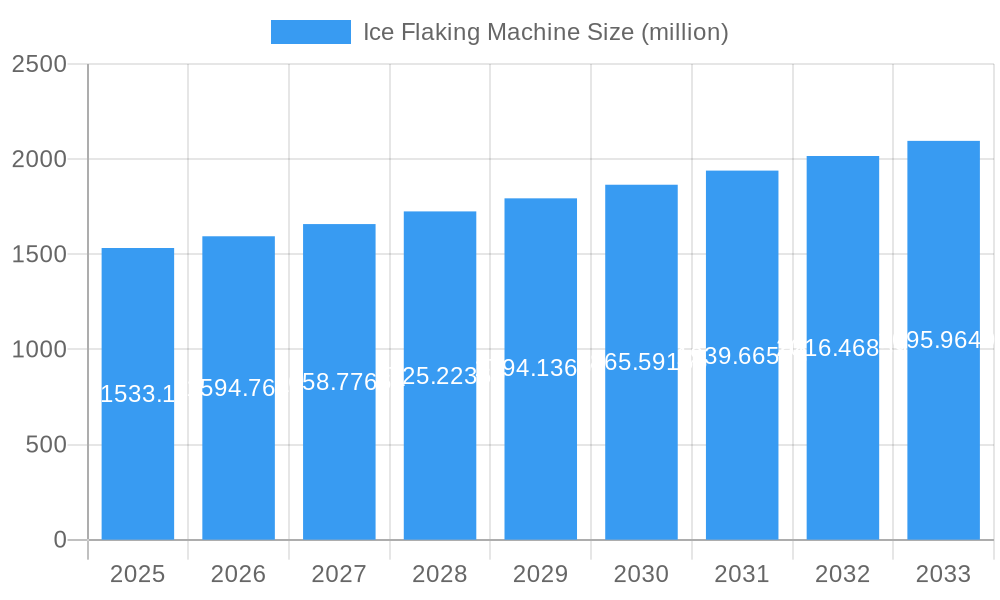
The global ice flaking machine market, valued at $1533.1 million in 2025, is projected to experience steady growth, driven by increasing demand across diverse sectors. The food and beverage industry remains a dominant consumer, utilizing flaked ice for chilling and preserving food products, particularly seafood and produce. The hospitality sector, encompassing hotels, restaurants, and bars, also contributes significantly to market growth due to the widespread use of flaked ice in beverages and food displays. Furthermore, the healthcare industry's reliance on flaked ice for therapeutic applications and in laboratory settings fuels market expansion. Technological advancements, such as energy-efficient designs and automated ice production systems, are further stimulating market growth. While the market faces challenges like fluctuating raw material prices and competition from alternative cooling methods, the overall growth trajectory remains positive, projected at a compound annual growth rate (CAGR) of 4% from 2025 to 2033. This steady expansion is fueled by increasing industrialization, rising disposable incomes in developing economies, and a consistent need for efficient and reliable ice production across varied applications.
Ice Flaking Machine Market Size (In Billion)
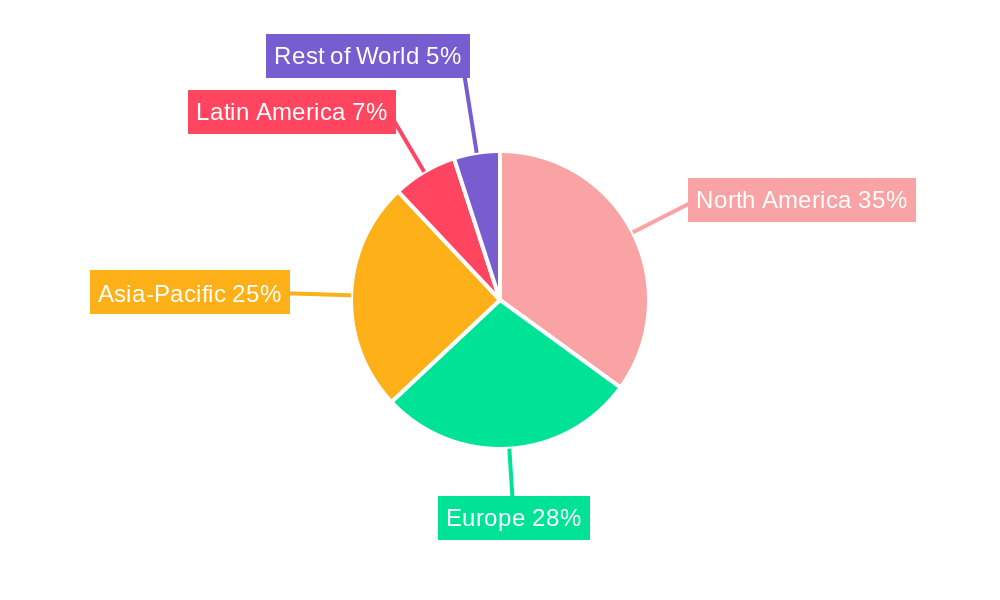
Growth will likely be influenced by regional variations. Developed regions, like North America and Europe, are expected to maintain a significant market share due to established infrastructure and high adoption rates. However, emerging economies in Asia-Pacific and Latin America are poised for rapid growth due to expanding food processing industries and increasing tourism. Key players in the market, including BUUS Refrigeration A/S, Electrolux AB, and Manitowoc Ice, are continuously innovating and investing in research and development to improve product efficiency and expand their market footprint. This competitive landscape fosters innovation and drives the market toward improved technology, sustainability, and cost-effectiveness. Specific segment data (e.g., by machine capacity or type) would provide further granular insights, but existing data already demonstrates the significant and sustained growth potential of the ice flaking machine market.
Ice Flaking Machine Company Market Share
Ice Flaking Machine Market Report: A Comprehensive Analysis (2019-2033)
This comprehensive report provides a detailed analysis of the global ice flaking machine market, offering invaluable insights for stakeholders seeking to understand current market dynamics and future growth prospects. The study period spans 2019-2033, with 2025 serving as the base and estimated year. The forecast period covers 2025-2033, while the historical period encompasses 2019-2024. This report leverages extensive data analysis to provide a clear picture of market size, trends, and key players, projecting a market value exceeding $XX million by 2033.
Ice Flaking Machine Market Composition & Trends
This section delves into the intricacies of the ice flaking machine market, examining its structure, influential trends, and competitive landscape. The market exhibits a moderately concentrated structure, with the top five players – Manitowoc Ice, Scotsman Ice Systems, Hoshizaki America, Inc., Follett LLC., and GEA Group AG – collectively holding an estimated XX% market share in 2025. Innovation in areas such as energy efficiency, automation, and hygiene are driving significant changes.
- Market Concentration: High, with top 5 players holding XX% of market share.
- Innovation Catalysts: Energy efficiency improvements, automated ice production, enhanced hygiene features, and smart connectivity.
- Regulatory Landscape: Stringent regulations regarding energy consumption and food safety are shaping market dynamics, particularly in developed regions.
- Substitute Products: While ice flaking machines dominate their niche, crushed ice machines and alternative cooling methods represent some level of substitution.
- End-User Profiles: The primary end-users include restaurants, supermarkets, hotels, healthcare facilities, and industrial food processing plants. These sectors show varying adoption rates and preferences based on specific needs.
- M&A Activities: Significant M&A activity was observed between 2019 and 2024, with total deal values exceeding $XX million. These transactions have reshaped the competitive landscape and spurred innovation. For example, the acquisition of Company X by Company Y in 2022 resulted in a significant expansion of the market share for Company Y.
Ice Flaking Machine Industry Evolution
The ice flaking machine market has undergone a significant transformation during the historical period (2019-2024). Driven by evolving consumer demands, technological advancements, and a growing need for efficient cooling solutions, the market experienced a Compound Annual Growth Rate (CAGR) of XX% from 2019 to 2024, reaching an estimated value of $XX million in 2024. This growth is predominantly attributed to several factors, including the increasing demand for food and beverage products needing efficient ice production, the implementation of advanced ice making technologies, and the growing trend towards automated and energy-efficient solutions. The adoption rate of energy-efficient models grew by XX% between 2021 and 2024. Furthermore, the increasing focus on food safety regulations is driving the adoption of hygienic and easy-to-clean ice flaking machines. Technological advancements, such as improved ice quality control and remote monitoring capabilities are also playing a critical role in market growth.
Leading Regions, Countries, or Segments in Ice Flaking Machine
North America currently dominates the global ice flaking machine market, accounting for approximately XX% of the total revenue in 2025. This dominance is primarily fueled by factors such as high per capita consumption of ice, a robust food service industry, and strong investments in commercial refrigeration equipment.
- Key Drivers for North American Dominance:
- High per capita consumption of iced beverages and food.
- Large and well-established food service and hospitality sector.
- Significant investments in commercial refrigeration infrastructure.
- Favorable regulatory environment for technological advancements in refrigeration systems.
This dominance is further solidified by the strong presence of major ice flaking machine manufacturers in the region and considerable government support for energy-efficient technologies, which is particularly relevant in the context of ice making. The substantial presence of key players in the region fosters competition and innovation, leading to increased product quality and technological advancements. Other regions, such as Europe and Asia-Pacific, are also exhibiting robust growth, driven by factors such as the rising demand for processed foods and the expansion of the food service industry in emerging markets.
Ice Flaking Machine Product Innovations
Recent innovations in ice flaking machines focus on enhancing ice quality, reducing energy consumption, and improving hygiene. Features like precise ice flake size control, optimized cooling systems, and automated cleaning mechanisms are becoming increasingly common. Manufacturers are also incorporating smart technology, allowing for remote monitoring and maintenance, optimizing operational efficiency and minimizing downtime. These improvements enhance the overall user experience and contribute to a reduction in operational costs, increasing the appeal to end-users.
Propelling Factors for Ice Flaking Machine Growth
Several factors are driving the growth of the ice flaking machine market. Firstly, the expansion of the food service sector, particularly quick-service restaurants and hotels, necessitates a higher demand for reliable and efficient ice production. Secondly, rising consumer preference for iced beverages and the increasing adoption of ice in various food applications is fueling growth. Finally, technological advancements leading to energy-efficient and user-friendly machines are boosting market adoption. The increasing focus on energy efficiency regulations further incentivizes the adoption of advanced technologies.
Obstacles in the Ice Flaking Machine Market
The ice flaking machine market faces challenges like increasing raw material costs and potential supply chain disruptions, leading to fluctuating production costs. Furthermore, intense competition from established and emerging players adds pressure on profit margins. Stringent environmental regulations surrounding refrigerant usage also pose a significant hurdle for manufacturers. These factors, coupled with fluctuations in global economic conditions, create an unpredictable market environment, impacting growth projections.
Future Opportunities in Ice Flaking Machine
Emerging opportunities exist in developing markets with growing food service sectors and expanding industrial applications. The integration of IoT and AI technologies offers the potential for further automation and remote management, optimizing operational efficiency and reducing maintenance needs. The market expansion into niche applications, such as specialized ice for medical purposes, presents new growth avenues.
Major Players in the Ice Flaking Machine Ecosystem
- BUUS Refrigeration A/S
- Electrolux AB
- Focusun Refrigeration Corporation
- Follett LLC.
- GEA Group AG
- Howe Corp.
- Manitowoc Ice
- Scotsman Ice Systems
- Hoshizaki America, Inc.
- Brema Ice Makers
Key Developments in Ice Flaking Machine Industry
- 2022 Q3: Manitowoc Ice launched a new line of energy-efficient ice flaking machines, significantly impacting market competition.
- 2021 Q4: A major merger between two key players resulted in a combined market share of XX%, altering the competitive landscape.
- 2020 Q1: Introduction of new hygiene standards impacting machine design and production costs.
- 2019 Q2: Significant investment in R&D across the industry, focusing on the integration of smart technology.
Strategic Ice Flaking Machine Market Forecast
The ice flaking machine market is poised for continued growth driven by the factors outlined above. Innovation in energy efficiency and automation will continue to shape market dynamics, presenting significant opportunities for manufacturers who embrace technological advancements and cater to evolving consumer demands. Expansion into emerging markets and the development of new applications will further fuel market expansion. The forecast indicates strong growth throughout the forecast period (2025-2033), leading to a substantial increase in market value.
Ice Flaking Machine Segmentation
-
1. Application
- 1.1. Food Processing
- 1.2. Medical
- 1.3. Chemical Industry
- 1.4. Others
-
2. Types
- 2.1. Low Capacity (less than 3000 KG/Day)
- 2.2. Medium Capacity (3000 KG/Day to 10000 KG/Day)
- 2.3. High Capacity (More than 1000 KG/Day)
Ice Flaking Machine Segmentation By Geography
-
1. North America
- 1.1. United States
- 1.2. Canada
- 1.3. Mexico
-
2. South America
- 2.1. Brazil
- 2.2. Argentina
- 2.3. Rest of South America
-
3. Europe
- 3.1. United Kingdom
- 3.2. Germany
- 3.3. France
- 3.4. Italy
- 3.5. Spain
- 3.6. Russia
- 3.7. Benelux
- 3.8. Nordics
- 3.9. Rest of Europe
-
4. Middle East & Africa
- 4.1. Turkey
- 4.2. Israel
- 4.3. GCC
- 4.4. North Africa
- 4.5. South Africa
- 4.6. Rest of Middle East & Africa
-
5. Asia Pacific
- 5.1. China
- 5.2. India
- 5.3. Japan
- 5.4. South Korea
- 5.5. ASEAN
- 5.6. Oceania
- 5.7. Rest of Asia Pacific
Ice Flaking Machine Regional Market Share
Geographic Coverage of Ice Flaking Machine
Ice Flaking Machine REPORT HIGHLIGHTS
| Aspects | Details |
|---|---|
| Study Period | 2020-2034 |
| Base Year | 2025 |
| Estimated Year | 2026 |
| Forecast Period | 2026-2034 |
| Historical Period | 2020-2025 |
| Growth Rate | CAGR of 12.8% from 2020-2034 |
| Segmentation |
|
Table of Contents
- 1. Introduction
- 1.1. Research Scope
- 1.2. Market Segmentation
- 1.3. Research Methodology
- 1.4. Definitions and Assumptions
- 2. Executive Summary
- 2.1. Introduction
- 3. Market Dynamics
- 3.1. Introduction
- 3.2. Market Drivers
- 3.3. Market Restrains
- 3.4. Market Trends
- 4. Market Factor Analysis
- 4.1. Porters Five Forces
- 4.2. Supply/Value Chain
- 4.3. PESTEL analysis
- 4.4. Market Entropy
- 4.5. Patent/Trademark Analysis
- 5. Global Ice Flaking Machine Analysis, Insights and Forecast, 2020-2032
- 5.1. Market Analysis, Insights and Forecast - by Application
- 5.1.1. Food Processing
- 5.1.2. Medical
- 5.1.3. Chemical Industry
- 5.1.4. Others
- 5.2. Market Analysis, Insights and Forecast - by Types
- 5.2.1. Low Capacity (less than 3000 KG/Day)
- 5.2.2. Medium Capacity (3000 KG/Day to 10000 KG/Day)
- 5.2.3. High Capacity (More than 1000 KG/Day)
- 5.3. Market Analysis, Insights and Forecast - by Region
- 5.3.1. North America
- 5.3.2. South America
- 5.3.3. Europe
- 5.3.4. Middle East & Africa
- 5.3.5. Asia Pacific
- 5.1. Market Analysis, Insights and Forecast - by Application
- 6. North America Ice Flaking Machine Analysis, Insights and Forecast, 2020-2032
- 6.1. Market Analysis, Insights and Forecast - by Application
- 6.1.1. Food Processing
- 6.1.2. Medical
- 6.1.3. Chemical Industry
- 6.1.4. Others
- 6.2. Market Analysis, Insights and Forecast - by Types
- 6.2.1. Low Capacity (less than 3000 KG/Day)
- 6.2.2. Medium Capacity (3000 KG/Day to 10000 KG/Day)
- 6.2.3. High Capacity (More than 1000 KG/Day)
- 6.1. Market Analysis, Insights and Forecast - by Application
- 7. South America Ice Flaking Machine Analysis, Insights and Forecast, 2020-2032
- 7.1. Market Analysis, Insights and Forecast - by Application
- 7.1.1. Food Processing
- 7.1.2. Medical
- 7.1.3. Chemical Industry
- 7.1.4. Others
- 7.2. Market Analysis, Insights and Forecast - by Types
- 7.2.1. Low Capacity (less than 3000 KG/Day)
- 7.2.2. Medium Capacity (3000 KG/Day to 10000 KG/Day)
- 7.2.3. High Capacity (More than 1000 KG/Day)
- 7.1. Market Analysis, Insights and Forecast - by Application
- 8. Europe Ice Flaking Machine Analysis, Insights and Forecast, 2020-2032
- 8.1. Market Analysis, Insights and Forecast - by Application
- 8.1.1. Food Processing
- 8.1.2. Medical
- 8.1.3. Chemical Industry
- 8.1.4. Others
- 8.2. Market Analysis, Insights and Forecast - by Types
- 8.2.1. Low Capacity (less than 3000 KG/Day)
- 8.2.2. Medium Capacity (3000 KG/Day to 10000 KG/Day)
- 8.2.3. High Capacity (More than 1000 KG/Day)
- 8.1. Market Analysis, Insights and Forecast - by Application
- 9. Middle East & Africa Ice Flaking Machine Analysis, Insights and Forecast, 2020-2032
- 9.1. Market Analysis, Insights and Forecast - by Application
- 9.1.1. Food Processing
- 9.1.2. Medical
- 9.1.3. Chemical Industry
- 9.1.4. Others
- 9.2. Market Analysis, Insights and Forecast - by Types
- 9.2.1. Low Capacity (less than 3000 KG/Day)
- 9.2.2. Medium Capacity (3000 KG/Day to 10000 KG/Day)
- 9.2.3. High Capacity (More than 1000 KG/Day)
- 9.1. Market Analysis, Insights and Forecast - by Application
- 10. Asia Pacific Ice Flaking Machine Analysis, Insights and Forecast, 2020-2032
- 10.1. Market Analysis, Insights and Forecast - by Application
- 10.1.1. Food Processing
- 10.1.2. Medical
- 10.1.3. Chemical Industry
- 10.1.4. Others
- 10.2. Market Analysis, Insights and Forecast - by Types
- 10.2.1. Low Capacity (less than 3000 KG/Day)
- 10.2.2. Medium Capacity (3000 KG/Day to 10000 KG/Day)
- 10.2.3. High Capacity (More than 1000 KG/Day)
- 10.1. Market Analysis, Insights and Forecast - by Application
- 11. Competitive Analysis
- 11.1. Global Market Share Analysis 2025
- 11.2. Company Profiles
- 11.2.1 BUUS Refrigeration A/S
- 11.2.1.1. Overview
- 11.2.1.2. Products
- 11.2.1.3. SWOT Analysis
- 11.2.1.4. Recent Developments
- 11.2.1.5. Financials (Based on Availability)
- 11.2.2 Electrolux AB
- 11.2.2.1. Overview
- 11.2.2.2. Products
- 11.2.2.3. SWOT Analysis
- 11.2.2.4. Recent Developments
- 11.2.2.5. Financials (Based on Availability)
- 11.2.3 Focusun Refrigeration Corporation
- 11.2.3.1. Overview
- 11.2.3.2. Products
- 11.2.3.3. SWOT Analysis
- 11.2.3.4. Recent Developments
- 11.2.3.5. Financials (Based on Availability)
- 11.2.4 Follett LLC.
- 11.2.4.1. Overview
- 11.2.4.2. Products
- 11.2.4.3. SWOT Analysis
- 11.2.4.4. Recent Developments
- 11.2.4.5. Financials (Based on Availability)
- 11.2.5 GEA Group AG
- 11.2.5.1. Overview
- 11.2.5.2. Products
- 11.2.5.3. SWOT Analysis
- 11.2.5.4. Recent Developments
- 11.2.5.5. Financials (Based on Availability)
- 11.2.6 Howe Corp.
- 11.2.6.1. Overview
- 11.2.6.2. Products
- 11.2.6.3. SWOT Analysis
- 11.2.6.4. Recent Developments
- 11.2.6.5. Financials (Based on Availability)
- 11.2.7 Manitowoc Ice
- 11.2.7.1. Overview
- 11.2.7.2. Products
- 11.2.7.3. SWOT Analysis
- 11.2.7.4. Recent Developments
- 11.2.7.5. Financials (Based on Availability)
- 11.2.8 Scotsman Ice Systems
- 11.2.8.1. Overview
- 11.2.8.2. Products
- 11.2.8.3. SWOT Analysis
- 11.2.8.4. Recent Developments
- 11.2.8.5. Financials (Based on Availability)
- 11.2.9 Hoshizaki America
- 11.2.9.1. Overview
- 11.2.9.2. Products
- 11.2.9.3. SWOT Analysis
- 11.2.9.4. Recent Developments
- 11.2.9.5. Financials (Based on Availability)
- 11.2.10 Inc.
- 11.2.10.1. Overview
- 11.2.10.2. Products
- 11.2.10.3. SWOT Analysis
- 11.2.10.4. Recent Developments
- 11.2.10.5. Financials (Based on Availability)
- 11.2.11 Brema Ice Makers
- 11.2.11.1. Overview
- 11.2.11.2. Products
- 11.2.11.3. SWOT Analysis
- 11.2.11.4. Recent Developments
- 11.2.11.5. Financials (Based on Availability)
- 11.2.1 BUUS Refrigeration A/S
List of Figures
- Figure 1: Global Ice Flaking Machine Revenue Breakdown (undefined, %) by Region 2025 & 2033
- Figure 2: Global Ice Flaking Machine Volume Breakdown (K, %) by Region 2025 & 2033
- Figure 3: North America Ice Flaking Machine Revenue (undefined), by Application 2025 & 2033
- Figure 4: North America Ice Flaking Machine Volume (K), by Application 2025 & 2033
- Figure 5: North America Ice Flaking Machine Revenue Share (%), by Application 2025 & 2033
- Figure 6: North America Ice Flaking Machine Volume Share (%), by Application 2025 & 2033
- Figure 7: North America Ice Flaking Machine Revenue (undefined), by Types 2025 & 2033
- Figure 8: North America Ice Flaking Machine Volume (K), by Types 2025 & 2033
- Figure 9: North America Ice Flaking Machine Revenue Share (%), by Types 2025 & 2033
- Figure 10: North America Ice Flaking Machine Volume Share (%), by Types 2025 & 2033
- Figure 11: North America Ice Flaking Machine Revenue (undefined), by Country 2025 & 2033
- Figure 12: North America Ice Flaking Machine Volume (K), by Country 2025 & 2033
- Figure 13: North America Ice Flaking Machine Revenue Share (%), by Country 2025 & 2033
- Figure 14: North America Ice Flaking Machine Volume Share (%), by Country 2025 & 2033
- Figure 15: South America Ice Flaking Machine Revenue (undefined), by Application 2025 & 2033
- Figure 16: South America Ice Flaking Machine Volume (K), by Application 2025 & 2033
- Figure 17: South America Ice Flaking Machine Revenue Share (%), by Application 2025 & 2033
- Figure 18: South America Ice Flaking Machine Volume Share (%), by Application 2025 & 2033
- Figure 19: South America Ice Flaking Machine Revenue (undefined), by Types 2025 & 2033
- Figure 20: South America Ice Flaking Machine Volume (K), by Types 2025 & 2033
- Figure 21: South America Ice Flaking Machine Revenue Share (%), by Types 2025 & 2033
- Figure 22: South America Ice Flaking Machine Volume Share (%), by Types 2025 & 2033
- Figure 23: South America Ice Flaking Machine Revenue (undefined), by Country 2025 & 2033
- Figure 24: South America Ice Flaking Machine Volume (K), by Country 2025 & 2033
- Figure 25: South America Ice Flaking Machine Revenue Share (%), by Country 2025 & 2033
- Figure 26: South America Ice Flaking Machine Volume Share (%), by Country 2025 & 2033
- Figure 27: Europe Ice Flaking Machine Revenue (undefined), by Application 2025 & 2033
- Figure 28: Europe Ice Flaking Machine Volume (K), by Application 2025 & 2033
- Figure 29: Europe Ice Flaking Machine Revenue Share (%), by Application 2025 & 2033
- Figure 30: Europe Ice Flaking Machine Volume Share (%), by Application 2025 & 2033
- Figure 31: Europe Ice Flaking Machine Revenue (undefined), by Types 2025 & 2033
- Figure 32: Europe Ice Flaking Machine Volume (K), by Types 2025 & 2033
- Figure 33: Europe Ice Flaking Machine Revenue Share (%), by Types 2025 & 2033
- Figure 34: Europe Ice Flaking Machine Volume Share (%), by Types 2025 & 2033
- Figure 35: Europe Ice Flaking Machine Revenue (undefined), by Country 2025 & 2033
- Figure 36: Europe Ice Flaking Machine Volume (K), by Country 2025 & 2033
- Figure 37: Europe Ice Flaking Machine Revenue Share (%), by Country 2025 & 2033
- Figure 38: Europe Ice Flaking Machine Volume Share (%), by Country 2025 & 2033
- Figure 39: Middle East & Africa Ice Flaking Machine Revenue (undefined), by Application 2025 & 2033
- Figure 40: Middle East & Africa Ice Flaking Machine Volume (K), by Application 2025 & 2033
- Figure 41: Middle East & Africa Ice Flaking Machine Revenue Share (%), by Application 2025 & 2033
- Figure 42: Middle East & Africa Ice Flaking Machine Volume Share (%), by Application 2025 & 2033
- Figure 43: Middle East & Africa Ice Flaking Machine Revenue (undefined), by Types 2025 & 2033
- Figure 44: Middle East & Africa Ice Flaking Machine Volume (K), by Types 2025 & 2033
- Figure 45: Middle East & Africa Ice Flaking Machine Revenue Share (%), by Types 2025 & 2033
- Figure 46: Middle East & Africa Ice Flaking Machine Volume Share (%), by Types 2025 & 2033
- Figure 47: Middle East & Africa Ice Flaking Machine Revenue (undefined), by Country 2025 & 2033
- Figure 48: Middle East & Africa Ice Flaking Machine Volume (K), by Country 2025 & 2033
- Figure 49: Middle East & Africa Ice Flaking Machine Revenue Share (%), by Country 2025 & 2033
- Figure 50: Middle East & Africa Ice Flaking Machine Volume Share (%), by Country 2025 & 2033
- Figure 51: Asia Pacific Ice Flaking Machine Revenue (undefined), by Application 2025 & 2033
- Figure 52: Asia Pacific Ice Flaking Machine Volume (K), by Application 2025 & 2033
- Figure 53: Asia Pacific Ice Flaking Machine Revenue Share (%), by Application 2025 & 2033
- Figure 54: Asia Pacific Ice Flaking Machine Volume Share (%), by Application 2025 & 2033
- Figure 55: Asia Pacific Ice Flaking Machine Revenue (undefined), by Types 2025 & 2033
- Figure 56: Asia Pacific Ice Flaking Machine Volume (K), by Types 2025 & 2033
- Figure 57: Asia Pacific Ice Flaking Machine Revenue Share (%), by Types 2025 & 2033
- Figure 58: Asia Pacific Ice Flaking Machine Volume Share (%), by Types 2025 & 2033
- Figure 59: Asia Pacific Ice Flaking Machine Revenue (undefined), by Country 2025 & 2033
- Figure 60: Asia Pacific Ice Flaking Machine Volume (K), by Country 2025 & 2033
- Figure 61: Asia Pacific Ice Flaking Machine Revenue Share (%), by Country 2025 & 2033
- Figure 62: Asia Pacific Ice Flaking Machine Volume Share (%), by Country 2025 & 2033
List of Tables
- Table 1: Global Ice Flaking Machine Revenue undefined Forecast, by Application 2020 & 2033
- Table 2: Global Ice Flaking Machine Volume K Forecast, by Application 2020 & 2033
- Table 3: Global Ice Flaking Machine Revenue undefined Forecast, by Types 2020 & 2033
- Table 4: Global Ice Flaking Machine Volume K Forecast, by Types 2020 & 2033
- Table 5: Global Ice Flaking Machine Revenue undefined Forecast, by Region 2020 & 2033
- Table 6: Global Ice Flaking Machine Volume K Forecast, by Region 2020 & 2033
- Table 7: Global Ice Flaking Machine Revenue undefined Forecast, by Application 2020 & 2033
- Table 8: Global Ice Flaking Machine Volume K Forecast, by Application 2020 & 2033
- Table 9: Global Ice Flaking Machine Revenue undefined Forecast, by Types 2020 & 2033
- Table 10: Global Ice Flaking Machine Volume K Forecast, by Types 2020 & 2033
- Table 11: Global Ice Flaking Machine Revenue undefined Forecast, by Country 2020 & 2033
- Table 12: Global Ice Flaking Machine Volume K Forecast, by Country 2020 & 2033
- Table 13: United States Ice Flaking Machine Revenue (undefined) Forecast, by Application 2020 & 2033
- Table 14: United States Ice Flaking Machine Volume (K) Forecast, by Application 2020 & 2033
- Table 15: Canada Ice Flaking Machine Revenue (undefined) Forecast, by Application 2020 & 2033
- Table 16: Canada Ice Flaking Machine Volume (K) Forecast, by Application 2020 & 2033
- Table 17: Mexico Ice Flaking Machine Revenue (undefined) Forecast, by Application 2020 & 2033
- Table 18: Mexico Ice Flaking Machine Volume (K) Forecast, by Application 2020 & 2033
- Table 19: Global Ice Flaking Machine Revenue undefined Forecast, by Application 2020 & 2033
- Table 20: Global Ice Flaking Machine Volume K Forecast, by Application 2020 & 2033
- Table 21: Global Ice Flaking Machine Revenue undefined Forecast, by Types 2020 & 2033
- Table 22: Global Ice Flaking Machine Volume K Forecast, by Types 2020 & 2033
- Table 23: Global Ice Flaking Machine Revenue undefined Forecast, by Country 2020 & 2033
- Table 24: Global Ice Flaking Machine Volume K Forecast, by Country 2020 & 2033
- Table 25: Brazil Ice Flaking Machine Revenue (undefined) Forecast, by Application 2020 & 2033
- Table 26: Brazil Ice Flaking Machine Volume (K) Forecast, by Application 2020 & 2033
- Table 27: Argentina Ice Flaking Machine Revenue (undefined) Forecast, by Application 2020 & 2033
- Table 28: Argentina Ice Flaking Machine Volume (K) Forecast, by Application 2020 & 2033
- Table 29: Rest of South America Ice Flaking Machine Revenue (undefined) Forecast, by Application 2020 & 2033
- Table 30: Rest of South America Ice Flaking Machine Volume (K) Forecast, by Application 2020 & 2033
- Table 31: Global Ice Flaking Machine Revenue undefined Forecast, by Application 2020 & 2033
- Table 32: Global Ice Flaking Machine Volume K Forecast, by Application 2020 & 2033
- Table 33: Global Ice Flaking Machine Revenue undefined Forecast, by Types 2020 & 2033
- Table 34: Global Ice Flaking Machine Volume K Forecast, by Types 2020 & 2033
- Table 35: Global Ice Flaking Machine Revenue undefined Forecast, by Country 2020 & 2033
- Table 36: Global Ice Flaking Machine Volume K Forecast, by Country 2020 & 2033
- Table 37: United Kingdom Ice Flaking Machine Revenue (undefined) Forecast, by Application 2020 & 2033
- Table 38: United Kingdom Ice Flaking Machine Volume (K) Forecast, by Application 2020 & 2033
- Table 39: Germany Ice Flaking Machine Revenue (undefined) Forecast, by Application 2020 & 2033
- Table 40: Germany Ice Flaking Machine Volume (K) Forecast, by Application 2020 & 2033
- Table 41: France Ice Flaking Machine Revenue (undefined) Forecast, by Application 2020 & 2033
- Table 42: France Ice Flaking Machine Volume (K) Forecast, by Application 2020 & 2033
- Table 43: Italy Ice Flaking Machine Revenue (undefined) Forecast, by Application 2020 & 2033
- Table 44: Italy Ice Flaking Machine Volume (K) Forecast, by Application 2020 & 2033
- Table 45: Spain Ice Flaking Machine Revenue (undefined) Forecast, by Application 2020 & 2033
- Table 46: Spain Ice Flaking Machine Volume (K) Forecast, by Application 2020 & 2033
- Table 47: Russia Ice Flaking Machine Revenue (undefined) Forecast, by Application 2020 & 2033
- Table 48: Russia Ice Flaking Machine Volume (K) Forecast, by Application 2020 & 2033
- Table 49: Benelux Ice Flaking Machine Revenue (undefined) Forecast, by Application 2020 & 2033
- Table 50: Benelux Ice Flaking Machine Volume (K) Forecast, by Application 2020 & 2033
- Table 51: Nordics Ice Flaking Machine Revenue (undefined) Forecast, by Application 2020 & 2033
- Table 52: Nordics Ice Flaking Machine Volume (K) Forecast, by Application 2020 & 2033
- Table 53: Rest of Europe Ice Flaking Machine Revenue (undefined) Forecast, by Application 2020 & 2033
- Table 54: Rest of Europe Ice Flaking Machine Volume (K) Forecast, by Application 2020 & 2033
- Table 55: Global Ice Flaking Machine Revenue undefined Forecast, by Application 2020 & 2033
- Table 56: Global Ice Flaking Machine Volume K Forecast, by Application 2020 & 2033
- Table 57: Global Ice Flaking Machine Revenue undefined Forecast, by Types 2020 & 2033
- Table 58: Global Ice Flaking Machine Volume K Forecast, by Types 2020 & 2033
- Table 59: Global Ice Flaking Machine Revenue undefined Forecast, by Country 2020 & 2033
- Table 60: Global Ice Flaking Machine Volume K Forecast, by Country 2020 & 2033
- Table 61: Turkey Ice Flaking Machine Revenue (undefined) Forecast, by Application 2020 & 2033
- Table 62: Turkey Ice Flaking Machine Volume (K) Forecast, by Application 2020 & 2033
- Table 63: Israel Ice Flaking Machine Revenue (undefined) Forecast, by Application 2020 & 2033
- Table 64: Israel Ice Flaking Machine Volume (K) Forecast, by Application 2020 & 2033
- Table 65: GCC Ice Flaking Machine Revenue (undefined) Forecast, by Application 2020 & 2033
- Table 66: GCC Ice Flaking Machine Volume (K) Forecast, by Application 2020 & 2033
- Table 67: North Africa Ice Flaking Machine Revenue (undefined) Forecast, by Application 2020 & 2033
- Table 68: North Africa Ice Flaking Machine Volume (K) Forecast, by Application 2020 & 2033
- Table 69: South Africa Ice Flaking Machine Revenue (undefined) Forecast, by Application 2020 & 2033
- Table 70: South Africa Ice Flaking Machine Volume (K) Forecast, by Application 2020 & 2033
- Table 71: Rest of Middle East & Africa Ice Flaking Machine Revenue (undefined) Forecast, by Application 2020 & 2033
- Table 72: Rest of Middle East & Africa Ice Flaking Machine Volume (K) Forecast, by Application 2020 & 2033
- Table 73: Global Ice Flaking Machine Revenue undefined Forecast, by Application 2020 & 2033
- Table 74: Global Ice Flaking Machine Volume K Forecast, by Application 2020 & 2033
- Table 75: Global Ice Flaking Machine Revenue undefined Forecast, by Types 2020 & 2033
- Table 76: Global Ice Flaking Machine Volume K Forecast, by Types 2020 & 2033
- Table 77: Global Ice Flaking Machine Revenue undefined Forecast, by Country 2020 & 2033
- Table 78: Global Ice Flaking Machine Volume K Forecast, by Country 2020 & 2033
- Table 79: China Ice Flaking Machine Revenue (undefined) Forecast, by Application 2020 & 2033
- Table 80: China Ice Flaking Machine Volume (K) Forecast, by Application 2020 & 2033
- Table 81: India Ice Flaking Machine Revenue (undefined) Forecast, by Application 2020 & 2033
- Table 82: India Ice Flaking Machine Volume (K) Forecast, by Application 2020 & 2033
- Table 83: Japan Ice Flaking Machine Revenue (undefined) Forecast, by Application 2020 & 2033
- Table 84: Japan Ice Flaking Machine Volume (K) Forecast, by Application 2020 & 2033
- Table 85: South Korea Ice Flaking Machine Revenue (undefined) Forecast, by Application 2020 & 2033
- Table 86: South Korea Ice Flaking Machine Volume (K) Forecast, by Application 2020 & 2033
- Table 87: ASEAN Ice Flaking Machine Revenue (undefined) Forecast, by Application 2020 & 2033
- Table 88: ASEAN Ice Flaking Machine Volume (K) Forecast, by Application 2020 & 2033
- Table 89: Oceania Ice Flaking Machine Revenue (undefined) Forecast, by Application 2020 & 2033
- Table 90: Oceania Ice Flaking Machine Volume (K) Forecast, by Application 2020 & 2033
- Table 91: Rest of Asia Pacific Ice Flaking Machine Revenue (undefined) Forecast, by Application 2020 & 2033
- Table 92: Rest of Asia Pacific Ice Flaking Machine Volume (K) Forecast, by Application 2020 & 2033
Frequently Asked Questions
1. What is the projected Compound Annual Growth Rate (CAGR) of the Ice Flaking Machine?
The projected CAGR is approximately 12.8%.
2. Which companies are prominent players in the Ice Flaking Machine?
Key companies in the market include BUUS Refrigeration A/S, Electrolux AB, Focusun Refrigeration Corporation, Follett LLC., GEA Group AG, Howe Corp., Manitowoc Ice, Scotsman Ice Systems, Hoshizaki America, Inc., Brema Ice Makers.
3. What are the main segments of the Ice Flaking Machine?
The market segments include Application, Types.
4. Can you provide details about the market size?
The market size is estimated to be USD XXX N/A as of 2022.
5. What are some drivers contributing to market growth?
N/A
6. What are the notable trends driving market growth?
N/A
7. Are there any restraints impacting market growth?
N/A
8. Can you provide examples of recent developments in the market?
N/A
9. What pricing options are available for accessing the report?
Pricing options include single-user, multi-user, and enterprise licenses priced at USD 3350.00, USD 5025.00, and USD 6700.00 respectively.
10. Is the market size provided in terms of value or volume?
The market size is provided in terms of value, measured in N/A and volume, measured in K.
11. Are there any specific market keywords associated with the report?
Yes, the market keyword associated with the report is "Ice Flaking Machine," which aids in identifying and referencing the specific market segment covered.
12. How do I determine which pricing option suits my needs best?
The pricing options vary based on user requirements and access needs. Individual users may opt for single-user licenses, while businesses requiring broader access may choose multi-user or enterprise licenses for cost-effective access to the report.
13. Are there any additional resources or data provided in the Ice Flaking Machine report?
While the report offers comprehensive insights, it's advisable to review the specific contents or supplementary materials provided to ascertain if additional resources or data are available.
14. How can I stay updated on further developments or reports in the Ice Flaking Machine?
To stay informed about further developments, trends, and reports in the Ice Flaking Machine, consider subscribing to industry newsletters, following relevant companies and organizations, or regularly checking reputable industry news sources and publications.
Methodology
Step 1 - Identification of Relevant Samples Size from Population Database


Step 2 - Approaches for Defining Global Market Size (Value, Volume* & Price*)

Note*: In applicable scenarios
Step 3 - Data Sources
Primary Research
- Web Analytics
- Survey Reports
- Research Institute
- Latest Research Reports
- Opinion Leaders
Secondary Research
- Annual Reports
- White Paper
- Latest Press Release
- Industry Association
- Paid Database
- Investor Presentations

Step 4 - Data Triangulation
Involves using different sources of information in order to increase the validity of a study
These sources are likely to be stakeholders in a program - participants, other researchers, program staff, other community members, and so on.
Then we put all data in single framework & apply various statistical tools to find out the dynamic on the market.
During the analysis stage, feedback from the stakeholder groups would be compared to determine areas of agreement as well as areas of divergence