

Key Insights
The global Gluten-Free Products market is set for significant expansion, projected to reach a market size of $8.34 billion by 2025, with an estimated Compound Annual Growth Rate (CAGR) of 7.2% through 2033. This growth is driven by increased awareness of celiac disease and gluten sensitivity, boosting demand for safe and healthy food alternatives. Consumers are adopting gluten-free diets for medical reasons and perceived health benefits like improved digestion and weight management. The growing availability and variety of gluten-free products across retail channels enhance accessibility and appeal.
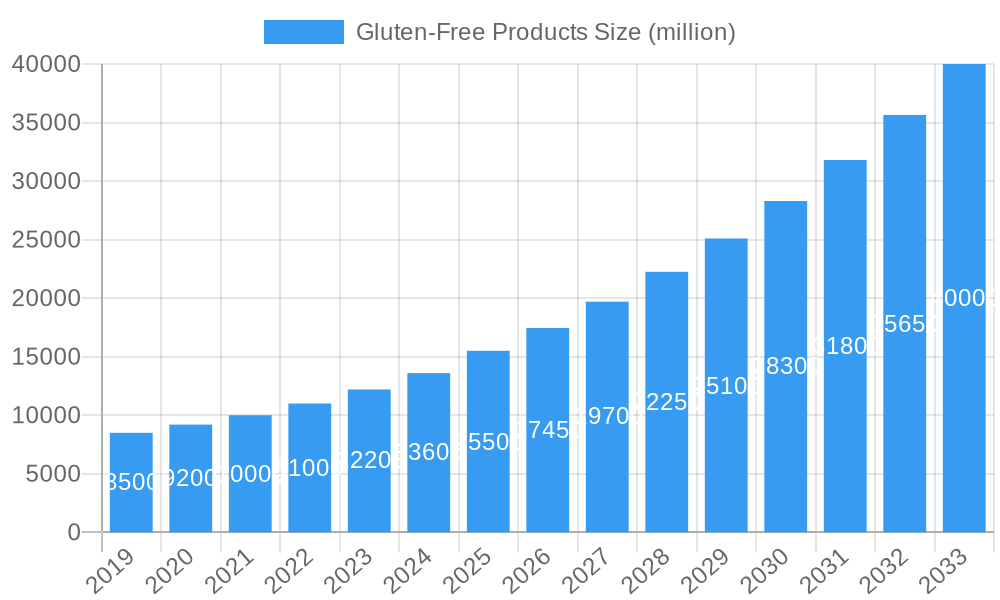
Gluten-Free Products Market Size (In Billion)
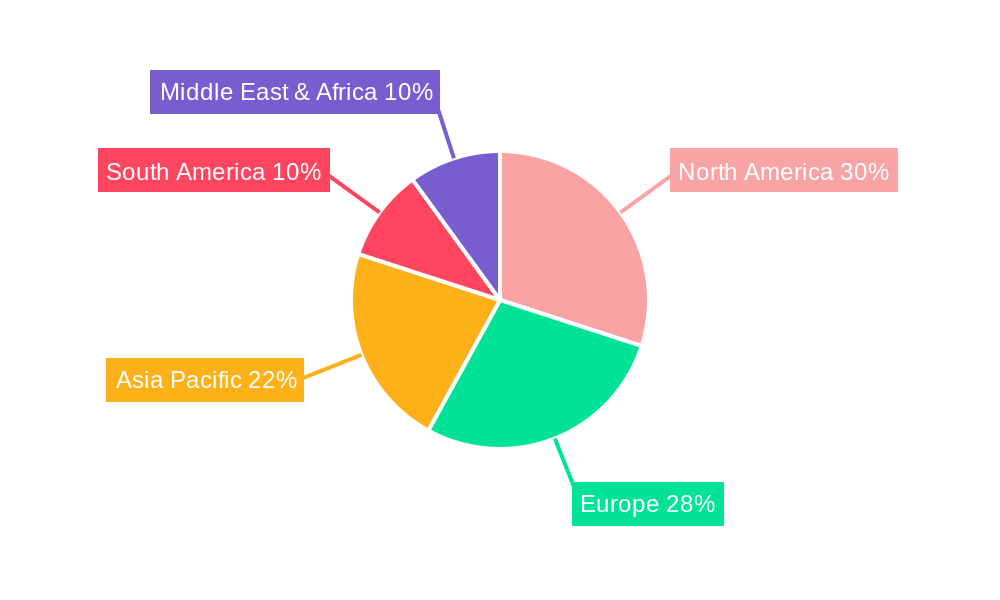
Evolving consumer preferences and a heightened health consciousness are key market dynamics. Increased prevalence of lifestyle diseases and allergies fuels demand for healthier food choices. The food industry is responding with innovation, clear labeling, and marketing that emphasizes gluten-free benefits. While strong growth is evident, higher ingredient costs and potential taste/texture compromises present challenges. Continuous research and development are improving product quality and affordability. The market spans diverse applications including conventional stores, hospitality, and healthcare. North America and Europe currently lead, with Asia Pacific emerging as a significant growth region due to rising incomes and health awareness.
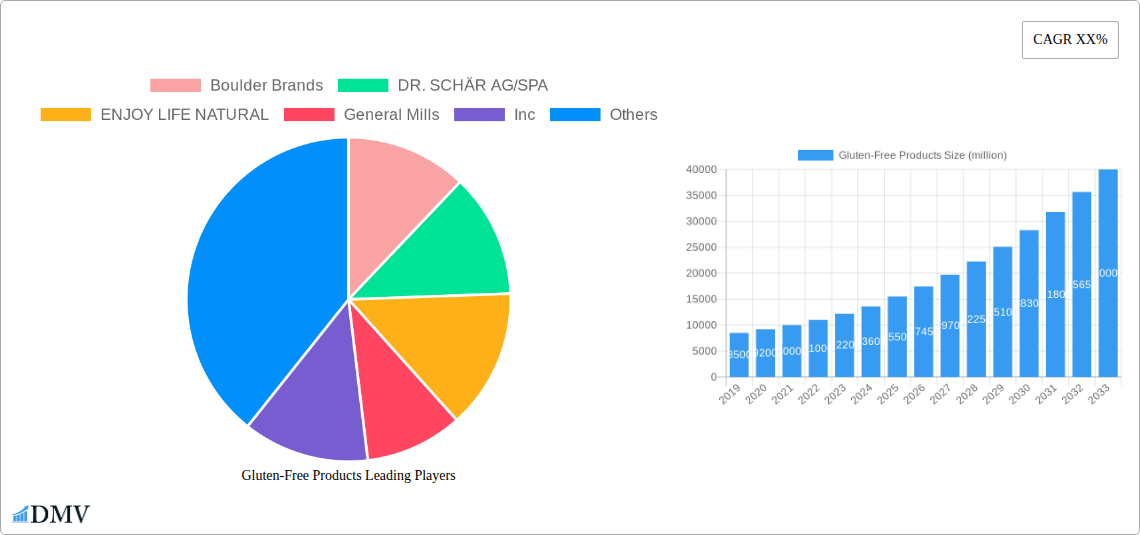
Gluten-Free Products Company Market Share
Gluten-Free Products Market Composition & Trends
The global gluten-free products market is characterized by a moderate to high concentration, with key players like The Hain Celestial Group, General Mills, Inc., and Boulder Brands holding significant market share. Innovation serves as a primary catalyst, driven by increasing consumer awareness of celiac disease, gluten sensitivities, and the perceived health benefits of gluten-free diets. The regulatory landscape, particularly in North America and Europe, mandates clear labeling of gluten-free claims, fostering consumer trust and market expansion. Substitute products, while present, have seen their impact tempered by the growing demand for dedicated gluten-free options. End-user profiles span a wide demographic, from individuals with diagnosed gluten-related disorders to health-conscious consumers seeking alternative food choices. Mergers and acquisitions (M&A) activity has been a consistent feature, with deals valued in the hundreds of millions, aiming to consolidate market position and expand product portfolios. For example, acquisitions of smaller, innovative gluten-free brands by larger food conglomerates are common. The market share distribution within the gluten-free sector shows a substantial portion attributed to bakery products and cereals & snacks, reflecting their widespread consumer appeal. M&A deal values are estimated to reach approximately $500 million annually, impacting market dynamics significantly.
Gluten-Free Products Industry Evolution
The gluten-free products industry has witnessed a remarkable evolution, driven by a confluence of factors that have reshaped its growth trajectory. From 2019 to 2024, the historical period showcased a burgeoning interest in gluten-free alternatives, largely propelled by increasing diagnoses of celiac disease and non-celiac gluten sensitivity. This initial phase saw a growth rate of approximately 8% annually as awareness and availability expanded. Technological advancements in processing and ingredient development have been pivotal. Innovations in alternative flours (e.g., almond, coconut, rice) and binding agents have enabled the creation of gluten-free products that closely mimic the taste and texture of traditional counterparts, significantly improving consumer acceptance. Shifting consumer demands have played an equally crucial role. Beyond those with medical necessity, a broader segment of the population has embraced gluten-free diets for perceived wellness benefits, leading to a surge in demand for a wider variety of gluten-free options, from baked goods to ready-to-eat meals. The estimated market growth rate is projected to be around 10% annually during the forecast period of 2025–2033. Adoption metrics for gluten-free products have seen a steady increase, with over 60 million consumers worldwide actively seeking gluten-free options. The market size, valued at over $10,000 million in 2019, is anticipated to reach over $25,000 million by 2033. This evolution underscores the industry's successful adaptation to evolving consumer needs and technological progress, transforming gluten-free from a niche segment to a mainstream dietary choice.
Leading Regions, Countries, or Segments in Gluten-Free Products
The gluten-free products market exhibits a dynamic regional and segmental dominance, with North America consistently leading the charge. This leadership is underpinned by a robust combination of high consumer awareness regarding gluten intolerance, proactive regulatory frameworks, and a well-established retail infrastructure that prioritizes the stocking of gluten-free alternatives. Within North America, the United States stands out as a key country, driven by extensive public health campaigns and a significant number of diagnosed celiacs and gluten-sensitive individuals.
Application Dominance:
- Conventional Stores: This segment accounts for the largest share of gluten-free product sales, benefiting from widespread accessibility and a broad consumer base seeking convenient purchase options. The availability of gluten-free lines alongside traditional products makes it the primary channel for most consumers.
- Specialty Services: This segment, encompassing online retailers and direct-to-consumer subscription boxes, is experiencing rapid growth. It caters to a more dedicated consumer base seeking specialized products and convenience, contributing approximately 15% of the market value.
Type Dominance:
- Bakery Products: This category remains the cornerstone of the gluten-free market. Innovations in gluten-free bread, cakes, and pastries have significantly improved quality, driving high demand. This segment alone represents over 30% of the total gluten-free product market share.
- Cereals & Snacks: This segment is a close second, driven by the demand for breakfast cereals, granola bars, and savory snacks that cater to on-the-go consumption and health-conscious consumers. The market for gluten-free cereals and snacks is valued at over $6,000 million.
Key drivers of this dominance include significant investment trends in product development and marketing by leading companies like General Mills, Inc. and The Hain Celestial Group, which collectively invest over $500 million annually in research and development for this segment. Furthermore, supportive regulatory environments, such as the FDA's gluten-free labeling rule, instill confidence and encourage market growth. The presence of major gluten-free manufacturers like Boulder Brands and Enjoy Life Natural further solidifies North America's leading position. Investment trends in the region are expected to grow by a CAGR of 9.5% through 2033, reinforcing its market supremacy.
Gluten-Free Products Product Innovations
Product innovation in the gluten-free sector is rapidly closing the gap between gluten-free and conventional offerings. Manufacturers are focusing on improving texture, taste, and nutritional profiles. Advancements in plant-based protein inclusion and the use of novel gluten-free flours, such as sorghum and teff, are enhancing the appeal and versatility of products. Unique selling propositions often revolve around clean labels, allergen-free formulations, and functional benefits like added fiber or probiotics. Technological advancements in baking processes and ingredient encapsulation are key to achieving superior sensory experiences and extended shelf life. The market for innovative gluten-free products is projected to grow by over 12% annually.
Propelling Factors for Gluten-Free Products Growth
Several key factors are propelling the growth of the gluten-free products market. Technological advancements in food science have enabled the creation of gluten-free alternatives with improved taste and texture, mirroring traditional products. Economic factors, such as rising disposable incomes in emerging economies, allow more consumers to afford premium gluten-free options. Furthermore, increasing health consciousness and a growing prevalence of gluten-related disorders (celiac disease, gluten sensitivity) are significant drivers. Regulatory support, including clear labeling standards, builds consumer trust. The estimated annual market growth attributed to these factors is around 10%.
Obstacles in the Gluten-Free Products Market
Despite robust growth, the gluten-free products market faces certain obstacles. Higher production costs associated with specialized ingredients and manufacturing processes often translate into higher retail prices, limiting accessibility for some consumers. Supply chain disruptions, particularly for niche gluten-free ingredients, can impact availability and consistency. Consumer confusion regarding the true necessity of gluten-free diets for non-celiac individuals can create market saturation and skepticism. Competitive pressures from a growing number of players, including private labels, also present challenges, with an estimated impact of reduced profit margins by approximately 5% on average.
Future Opportunities in Gluten-Free Products
Emerging opportunities in the gluten-free products market are abundant. Expansion into emerging markets in Asia-Pacific and Latin America, where awareness is growing, presents significant potential. Development of fortified gluten-free products with added vitamins, minerals, and protein will cater to health-conscious consumers. Innovations in plant-based gluten-free alternatives will tap into a growing vegan and vegetarian market. Furthermore, exploring the foodservice sector with readily available gluten-free options for restaurants and cafes offers a substantial growth avenue. The projected untapped market potential is estimated to be over $15,000 million.
Major Players in the Gluten-Free Products Ecosystem
- Boulder Brands
- DR. SCHÄR AG/SPA
- ENJOY LIFE NATURAL
- General Mills, Inc.
- The Hain Celestial Group
- Kraft Heinz
- HERO GROUP AG
- KELKIN LTD
- NQPC
- RAISIO PLC
- Kellogg's Company
- Big Oz Industries
- Domino's Pizza
Key Developments in Gluten-Free Products Industry
- 2023 Q4: Kellogg's Company launches a new line of gluten-free breakfast cereals, expanding its presence in the health-conscious segment.
- 2023 Q3: The Hain Celestial Group acquires a niche gluten-free bakery brand, strengthening its portfolio in premium baked goods.
- 2023 Q2: DR. SCHÄR AG/SPA introduces innovative gluten-free pasta varieties with enhanced protein content, catering to dietary needs.
- 2022 Q4: General Mills, Inc. reports a 15% increase in sales for its gluten-free product division, driven by strong consumer demand.
- 2022 Q3: Boulder Brands invests heavily in expanding its production capacity for gluten-free snacks to meet rising demand.
- 2021 Q4: Kraft Heinz explores strategic partnerships to enhance its gluten-free product offerings across multiple categories.
- 2021 Q3: Enjoy Life Natural launches allergen-free gluten-free cookies, targeting consumers with multiple dietary restrictions.
- 2020 Q4: HERO GROUP AG announces a new product development initiative focusing on gluten-free baby food.
- 2020 Q3: Raisio plc invests in advanced gluten-free oat processing technology.
- 2019 Q4: Kelkin Ltd expands its distribution network for gluten-free products into new European markets.
- 2019 Q3: Big Oz Industries pioneers a new method for producing gluten-free rice-based snacks.
- 2019 Q2: Domino's Pizza introduces gluten-free pizza crust options in select markets, a significant development for the foodservice sector.
Strategic Gluten-Free Products Market Forecast
The strategic forecast for the gluten-free products market is exceptionally positive, driven by sustained consumer demand for healthier food options and increased awareness of gluten-related disorders. Innovations in product development, particularly in taste, texture, and nutritional fortification, will continue to expand the market's appeal beyond medically necessitated consumers. Emerging market penetration and the growing influence of plant-based diets will unlock new growth avenues. The market is poised for continued expansion, with a projected compound annual growth rate of approximately 10% through 2033, presenting lucrative opportunities for both established players and new entrants. The estimated total market value by 2033 is projected to exceed $25,000 million.
Gluten-Free Products Segmentation
-
1. Application
- 1.1. Conventional Stores
- 1.2. Hotels & Restaurants
- 1.3. Educational Institutions
- 1.4. Hospitals & Drug Stores
- 1.5. Specialty Services
-
2. Types
- 2.1. Bakery Products
- 2.2. Pizzas & Pastas
- 2.3. Cereals & Snacks
- 2.4. Savories
- 2.5. Others
Gluten-Free Products Segmentation By Geography
-
1. North America
- 1.1. United States
- 1.2. Canada
- 1.3. Mexico
-
2. South America
- 2.1. Brazil
- 2.2. Argentina
- 2.3. Rest of South America
-
3. Europe
- 3.1. United Kingdom
- 3.2. Germany
- 3.3. France
- 3.4. Italy
- 3.5. Spain
- 3.6. Russia
- 3.7. Benelux
- 3.8. Nordics
- 3.9. Rest of Europe
-
4. Middle East & Africa
- 4.1. Turkey
- 4.2. Israel
- 4.3. GCC
- 4.4. North Africa
- 4.5. South Africa
- 4.6. Rest of Middle East & Africa
-
5. Asia Pacific
- 5.1. China
- 5.2. India
- 5.3. Japan
- 5.4. South Korea
- 5.5. ASEAN
- 5.6. Oceania
- 5.7. Rest of Asia Pacific
Gluten-Free Products Regional Market Share
Geographic Coverage of Gluten-Free Products
Gluten-Free Products REPORT HIGHLIGHTS
| Aspects | Details |
|---|---|
| Study Period | 2020-2034 |
| Base Year | 2025 |
| Estimated Year | 2026 |
| Forecast Period | 2026-2034 |
| Historical Period | 2020-2025 |
| Growth Rate | CAGR of 7.2% from 2020-2034 |
| Segmentation |
|
Table of Contents
- 1. Introduction
- 1.1. Research Scope
- 1.2. Market Segmentation
- 1.3. Research Methodology
- 1.4. Definitions and Assumptions
- 2. Executive Summary
- 2.1. Introduction
- 3. Market Dynamics
- 3.1. Introduction
- 3.2. Market Drivers
- 3.3. Market Restrains
- 3.4. Market Trends
- 4. Market Factor Analysis
- 4.1. Porters Five Forces
- 4.2. Supply/Value Chain
- 4.3. PESTEL analysis
- 4.4. Market Entropy
- 4.5. Patent/Trademark Analysis
- 5. Global Gluten-Free Products Analysis, Insights and Forecast, 2020-2032
- 5.1. Market Analysis, Insights and Forecast - by Application
- 5.1.1. Conventional Stores
- 5.1.2. Hotels & Restaurants
- 5.1.3. Educational Institutions
- 5.1.4. Hospitals & Drug Stores
- 5.1.5. Specialty Services
- 5.2. Market Analysis, Insights and Forecast - by Types
- 5.2.1. Bakery Products
- 5.2.2. Pizzas & Pastas
- 5.2.3. Cereals & Snacks
- 5.2.4. Savories
- 5.2.5. Others
- 5.3. Market Analysis, Insights and Forecast - by Region
- 5.3.1. North America
- 5.3.2. South America
- 5.3.3. Europe
- 5.3.4. Middle East & Africa
- 5.3.5. Asia Pacific
- 5.1. Market Analysis, Insights and Forecast - by Application
- 6. North America Gluten-Free Products Analysis, Insights and Forecast, 2020-2032
- 6.1. Market Analysis, Insights and Forecast - by Application
- 6.1.1. Conventional Stores
- 6.1.2. Hotels & Restaurants
- 6.1.3. Educational Institutions
- 6.1.4. Hospitals & Drug Stores
- 6.1.5. Specialty Services
- 6.2. Market Analysis, Insights and Forecast - by Types
- 6.2.1. Bakery Products
- 6.2.2. Pizzas & Pastas
- 6.2.3. Cereals & Snacks
- 6.2.4. Savories
- 6.2.5. Others
- 6.1. Market Analysis, Insights and Forecast - by Application
- 7. South America Gluten-Free Products Analysis, Insights and Forecast, 2020-2032
- 7.1. Market Analysis, Insights and Forecast - by Application
- 7.1.1. Conventional Stores
- 7.1.2. Hotels & Restaurants
- 7.1.3. Educational Institutions
- 7.1.4. Hospitals & Drug Stores
- 7.1.5. Specialty Services
- 7.2. Market Analysis, Insights and Forecast - by Types
- 7.2.1. Bakery Products
- 7.2.2. Pizzas & Pastas
- 7.2.3. Cereals & Snacks
- 7.2.4. Savories
- 7.2.5. Others
- 7.1. Market Analysis, Insights and Forecast - by Application
- 8. Europe Gluten-Free Products Analysis, Insights and Forecast, 2020-2032
- 8.1. Market Analysis, Insights and Forecast - by Application
- 8.1.1. Conventional Stores
- 8.1.2. Hotels & Restaurants
- 8.1.3. Educational Institutions
- 8.1.4. Hospitals & Drug Stores
- 8.1.5. Specialty Services
- 8.2. Market Analysis, Insights and Forecast - by Types
- 8.2.1. Bakery Products
- 8.2.2. Pizzas & Pastas
- 8.2.3. Cereals & Snacks
- 8.2.4. Savories
- 8.2.5. Others
- 8.1. Market Analysis, Insights and Forecast - by Application
- 9. Middle East & Africa Gluten-Free Products Analysis, Insights and Forecast, 2020-2032
- 9.1. Market Analysis, Insights and Forecast - by Application
- 9.1.1. Conventional Stores
- 9.1.2. Hotels & Restaurants
- 9.1.3. Educational Institutions
- 9.1.4. Hospitals & Drug Stores
- 9.1.5. Specialty Services
- 9.2. Market Analysis, Insights and Forecast - by Types
- 9.2.1. Bakery Products
- 9.2.2. Pizzas & Pastas
- 9.2.3. Cereals & Snacks
- 9.2.4. Savories
- 9.2.5. Others
- 9.1. Market Analysis, Insights and Forecast - by Application
- 10. Asia Pacific Gluten-Free Products Analysis, Insights and Forecast, 2020-2032
- 10.1. Market Analysis, Insights and Forecast - by Application
- 10.1.1. Conventional Stores
- 10.1.2. Hotels & Restaurants
- 10.1.3. Educational Institutions
- 10.1.4. Hospitals & Drug Stores
- 10.1.5. Specialty Services
- 10.2. Market Analysis, Insights and Forecast - by Types
- 10.2.1. Bakery Products
- 10.2.2. Pizzas & Pastas
- 10.2.3. Cereals & Snacks
- 10.2.4. Savories
- 10.2.5. Others
- 10.1. Market Analysis, Insights and Forecast - by Application
- 11. Competitive Analysis
- 11.1. Global Market Share Analysis 2025
- 11.2. Company Profiles
- 11.2.1 Boulder Brands
- 11.2.1.1. Overview
- 11.2.1.2. Products
- 11.2.1.3. SWOT Analysis
- 11.2.1.4. Recent Developments
- 11.2.1.5. Financials (Based on Availability)
- 11.2.2 DR. SCHÄR AG/SPA
- 11.2.2.1. Overview
- 11.2.2.2. Products
- 11.2.2.3. SWOT Analysis
- 11.2.2.4. Recent Developments
- 11.2.2.5. Financials (Based on Availability)
- 11.2.3 ENJOY LIFE NATURAL
- 11.2.3.1. Overview
- 11.2.3.2. Products
- 11.2.3.3. SWOT Analysis
- 11.2.3.4. Recent Developments
- 11.2.3.5. Financials (Based on Availability)
- 11.2.4 General Mills
- 11.2.4.1. Overview
- 11.2.4.2. Products
- 11.2.4.3. SWOT Analysis
- 11.2.4.4. Recent Developments
- 11.2.4.5. Financials (Based on Availability)
- 11.2.5 Inc
- 11.2.5.1. Overview
- 11.2.5.2. Products
- 11.2.5.3. SWOT Analysis
- 11.2.5.4. Recent Developments
- 11.2.5.5. Financials (Based on Availability)
- 11.2.6 The Hain Celestial Group
- 11.2.6.1. Overview
- 11.2.6.2. Products
- 11.2.6.3. SWOT Analysis
- 11.2.6.4. Recent Developments
- 11.2.6.5. Financials (Based on Availability)
- 11.2.7 Kraft Heinz
- 11.2.7.1. Overview
- 11.2.7.2. Products
- 11.2.7.3. SWOT Analysis
- 11.2.7.4. Recent Developments
- 11.2.7.5. Financials (Based on Availability)
- 11.2.8 HERO GROUP AG
- 11.2.8.1. Overview
- 11.2.8.2. Products
- 11.2.8.3. SWOT Analysis
- 11.2.8.4. Recent Developments
- 11.2.8.5. Financials (Based on Availability)
- 11.2.9 KELKIN LTD
- 11.2.9.1. Overview
- 11.2.9.2. Products
- 11.2.9.3. SWOT Analysis
- 11.2.9.4. Recent Developments
- 11.2.9.5. Financials (Based on Availability)
- 11.2.10 NQPC
- 11.2.10.1. Overview
- 11.2.10.2. Products
- 11.2.10.3. SWOT Analysis
- 11.2.10.4. Recent Developments
- 11.2.10.5. Financials (Based on Availability)
- 11.2.11 RAISIO PLC
- 11.2.11.1. Overview
- 11.2.11.2. Products
- 11.2.11.3. SWOT Analysis
- 11.2.11.4. Recent Developments
- 11.2.11.5. Financials (Based on Availability)
- 11.2.12 Kellogg's Company
- 11.2.12.1. Overview
- 11.2.12.2. Products
- 11.2.12.3. SWOT Analysis
- 11.2.12.4. Recent Developments
- 11.2.12.5. Financials (Based on Availability)
- 11.2.13 Big Oz Industries
- 11.2.13.1. Overview
- 11.2.13.2. Products
- 11.2.13.3. SWOT Analysis
- 11.2.13.4. Recent Developments
- 11.2.13.5. Financials (Based on Availability)
- 11.2.14 Domino's Pizza
- 11.2.14.1. Overview
- 11.2.14.2. Products
- 11.2.14.3. SWOT Analysis
- 11.2.14.4. Recent Developments
- 11.2.14.5. Financials (Based on Availability)
- 11.2.1 Boulder Brands
List of Figures
- Figure 1: Global Gluten-Free Products Revenue Breakdown (billion, %) by Region 2025 & 2033
- Figure 2: North America Gluten-Free Products Revenue (billion), by Application 2025 & 2033
- Figure 3: North America Gluten-Free Products Revenue Share (%), by Application 2025 & 2033
- Figure 4: North America Gluten-Free Products Revenue (billion), by Types 2025 & 2033
- Figure 5: North America Gluten-Free Products Revenue Share (%), by Types 2025 & 2033
- Figure 6: North America Gluten-Free Products Revenue (billion), by Country 2025 & 2033
- Figure 7: North America Gluten-Free Products Revenue Share (%), by Country 2025 & 2033
- Figure 8: South America Gluten-Free Products Revenue (billion), by Application 2025 & 2033
- Figure 9: South America Gluten-Free Products Revenue Share (%), by Application 2025 & 2033
- Figure 10: South America Gluten-Free Products Revenue (billion), by Types 2025 & 2033
- Figure 11: South America Gluten-Free Products Revenue Share (%), by Types 2025 & 2033
- Figure 12: South America Gluten-Free Products Revenue (billion), by Country 2025 & 2033
- Figure 13: South America Gluten-Free Products Revenue Share (%), by Country 2025 & 2033
- Figure 14: Europe Gluten-Free Products Revenue (billion), by Application 2025 & 2033
- Figure 15: Europe Gluten-Free Products Revenue Share (%), by Application 2025 & 2033
- Figure 16: Europe Gluten-Free Products Revenue (billion), by Types 2025 & 2033
- Figure 17: Europe Gluten-Free Products Revenue Share (%), by Types 2025 & 2033
- Figure 18: Europe Gluten-Free Products Revenue (billion), by Country 2025 & 2033
- Figure 19: Europe Gluten-Free Products Revenue Share (%), by Country 2025 & 2033
- Figure 20: Middle East & Africa Gluten-Free Products Revenue (billion), by Application 2025 & 2033
- Figure 21: Middle East & Africa Gluten-Free Products Revenue Share (%), by Application 2025 & 2033
- Figure 22: Middle East & Africa Gluten-Free Products Revenue (billion), by Types 2025 & 2033
- Figure 23: Middle East & Africa Gluten-Free Products Revenue Share (%), by Types 2025 & 2033
- Figure 24: Middle East & Africa Gluten-Free Products Revenue (billion), by Country 2025 & 2033
- Figure 25: Middle East & Africa Gluten-Free Products Revenue Share (%), by Country 2025 & 2033
- Figure 26: Asia Pacific Gluten-Free Products Revenue (billion), by Application 2025 & 2033
- Figure 27: Asia Pacific Gluten-Free Products Revenue Share (%), by Application 2025 & 2033
- Figure 28: Asia Pacific Gluten-Free Products Revenue (billion), by Types 2025 & 2033
- Figure 29: Asia Pacific Gluten-Free Products Revenue Share (%), by Types 2025 & 2033
- Figure 30: Asia Pacific Gluten-Free Products Revenue (billion), by Country 2025 & 2033
- Figure 31: Asia Pacific Gluten-Free Products Revenue Share (%), by Country 2025 & 2033
List of Tables
- Table 1: Global Gluten-Free Products Revenue billion Forecast, by Application 2020 & 2033
- Table 2: Global Gluten-Free Products Revenue billion Forecast, by Types 2020 & 2033
- Table 3: Global Gluten-Free Products Revenue billion Forecast, by Region 2020 & 2033
- Table 4: Global Gluten-Free Products Revenue billion Forecast, by Application 2020 & 2033
- Table 5: Global Gluten-Free Products Revenue billion Forecast, by Types 2020 & 2033
- Table 6: Global Gluten-Free Products Revenue billion Forecast, by Country 2020 & 2033
- Table 7: United States Gluten-Free Products Revenue (billion) Forecast, by Application 2020 & 2033
- Table 8: Canada Gluten-Free Products Revenue (billion) Forecast, by Application 2020 & 2033
- Table 9: Mexico Gluten-Free Products Revenue (billion) Forecast, by Application 2020 & 2033
- Table 10: Global Gluten-Free Products Revenue billion Forecast, by Application 2020 & 2033
- Table 11: Global Gluten-Free Products Revenue billion Forecast, by Types 2020 & 2033
- Table 12: Global Gluten-Free Products Revenue billion Forecast, by Country 2020 & 2033
- Table 13: Brazil Gluten-Free Products Revenue (billion) Forecast, by Application 2020 & 2033
- Table 14: Argentina Gluten-Free Products Revenue (billion) Forecast, by Application 2020 & 2033
- Table 15: Rest of South America Gluten-Free Products Revenue (billion) Forecast, by Application 2020 & 2033
- Table 16: Global Gluten-Free Products Revenue billion Forecast, by Application 2020 & 2033
- Table 17: Global Gluten-Free Products Revenue billion Forecast, by Types 2020 & 2033
- Table 18: Global Gluten-Free Products Revenue billion Forecast, by Country 2020 & 2033
- Table 19: United Kingdom Gluten-Free Products Revenue (billion) Forecast, by Application 2020 & 2033
- Table 20: Germany Gluten-Free Products Revenue (billion) Forecast, by Application 2020 & 2033
- Table 21: France Gluten-Free Products Revenue (billion) Forecast, by Application 2020 & 2033
- Table 22: Italy Gluten-Free Products Revenue (billion) Forecast, by Application 2020 & 2033
- Table 23: Spain Gluten-Free Products Revenue (billion) Forecast, by Application 2020 & 2033
- Table 24: Russia Gluten-Free Products Revenue (billion) Forecast, by Application 2020 & 2033
- Table 25: Benelux Gluten-Free Products Revenue (billion) Forecast, by Application 2020 & 2033
- Table 26: Nordics Gluten-Free Products Revenue (billion) Forecast, by Application 2020 & 2033
- Table 27: Rest of Europe Gluten-Free Products Revenue (billion) Forecast, by Application 2020 & 2033
- Table 28: Global Gluten-Free Products Revenue billion Forecast, by Application 2020 & 2033
- Table 29: Global Gluten-Free Products Revenue billion Forecast, by Types 2020 & 2033
- Table 30: Global Gluten-Free Products Revenue billion Forecast, by Country 2020 & 2033
- Table 31: Turkey Gluten-Free Products Revenue (billion) Forecast, by Application 2020 & 2033
- Table 32: Israel Gluten-Free Products Revenue (billion) Forecast, by Application 2020 & 2033
- Table 33: GCC Gluten-Free Products Revenue (billion) Forecast, by Application 2020 & 2033
- Table 34: North Africa Gluten-Free Products Revenue (billion) Forecast, by Application 2020 & 2033
- Table 35: South Africa Gluten-Free Products Revenue (billion) Forecast, by Application 2020 & 2033
- Table 36: Rest of Middle East & Africa Gluten-Free Products Revenue (billion) Forecast, by Application 2020 & 2033
- Table 37: Global Gluten-Free Products Revenue billion Forecast, by Application 2020 & 2033
- Table 38: Global Gluten-Free Products Revenue billion Forecast, by Types 2020 & 2033
- Table 39: Global Gluten-Free Products Revenue billion Forecast, by Country 2020 & 2033
- Table 40: China Gluten-Free Products Revenue (billion) Forecast, by Application 2020 & 2033
- Table 41: India Gluten-Free Products Revenue (billion) Forecast, by Application 2020 & 2033
- Table 42: Japan Gluten-Free Products Revenue (billion) Forecast, by Application 2020 & 2033
- Table 43: South Korea Gluten-Free Products Revenue (billion) Forecast, by Application 2020 & 2033
- Table 44: ASEAN Gluten-Free Products Revenue (billion) Forecast, by Application 2020 & 2033
- Table 45: Oceania Gluten-Free Products Revenue (billion) Forecast, by Application 2020 & 2033
- Table 46: Rest of Asia Pacific Gluten-Free Products Revenue (billion) Forecast, by Application 2020 & 2033
Frequently Asked Questions
1. What is the projected Compound Annual Growth Rate (CAGR) of the Gluten-Free Products?
The projected CAGR is approximately 7.2%.
2. Which companies are prominent players in the Gluten-Free Products?
Key companies in the market include Boulder Brands, DR. SCHÄR AG/SPA, ENJOY LIFE NATURAL, General Mills, Inc, The Hain Celestial Group, Kraft Heinz, HERO GROUP AG, KELKIN LTD, NQPC, RAISIO PLC, Kellogg's Company, Big Oz Industries, Domino's Pizza.
3. What are the main segments of the Gluten-Free Products?
The market segments include Application, Types.
4. Can you provide details about the market size?
The market size is estimated to be USD 8.34 billion as of 2022.
5. What are some drivers contributing to market growth?
N/A
6. What are the notable trends driving market growth?
N/A
7. Are there any restraints impacting market growth?
N/A
8. Can you provide examples of recent developments in the market?
N/A
9. What pricing options are available for accessing the report?
Pricing options include single-user, multi-user, and enterprise licenses priced at USD 5600.00, USD 8400.00, and USD 11200.00 respectively.
10. Is the market size provided in terms of value or volume?
The market size is provided in terms of value, measured in billion.
11. Are there any specific market keywords associated with the report?
Yes, the market keyword associated with the report is "Gluten-Free Products," which aids in identifying and referencing the specific market segment covered.
12. How do I determine which pricing option suits my needs best?
The pricing options vary based on user requirements and access needs. Individual users may opt for single-user licenses, while businesses requiring broader access may choose multi-user or enterprise licenses for cost-effective access to the report.
13. Are there any additional resources or data provided in the Gluten-Free Products report?
While the report offers comprehensive insights, it's advisable to review the specific contents or supplementary materials provided to ascertain if additional resources or data are available.
14. How can I stay updated on further developments or reports in the Gluten-Free Products?
To stay informed about further developments, trends, and reports in the Gluten-Free Products, consider subscribing to industry newsletters, following relevant companies and organizations, or regularly checking reputable industry news sources and publications.
Methodology
Step 1 - Identification of Relevant Samples Size from Population Database


Step 2 - Approaches for Defining Global Market Size (Value, Volume* & Price*)

Note*: In applicable scenarios
Step 3 - Data Sources
Primary Research
- Web Analytics
- Survey Reports
- Research Institute
- Latest Research Reports
- Opinion Leaders
Secondary Research
- Annual Reports
- White Paper
- Latest Press Release
- Industry Association
- Paid Database
- Investor Presentations

Step 4 - Data Triangulation
Involves using different sources of information in order to increase the validity of a study
These sources are likely to be stakeholders in a program - participants, other researchers, program staff, other community members, and so on.
Then we put all data in single framework & apply various statistical tools to find out the dynamic on the market.
During the analysis stage, feedback from the stakeholder groups would be compared to determine areas of agreement as well as areas of divergence