

Key Insights
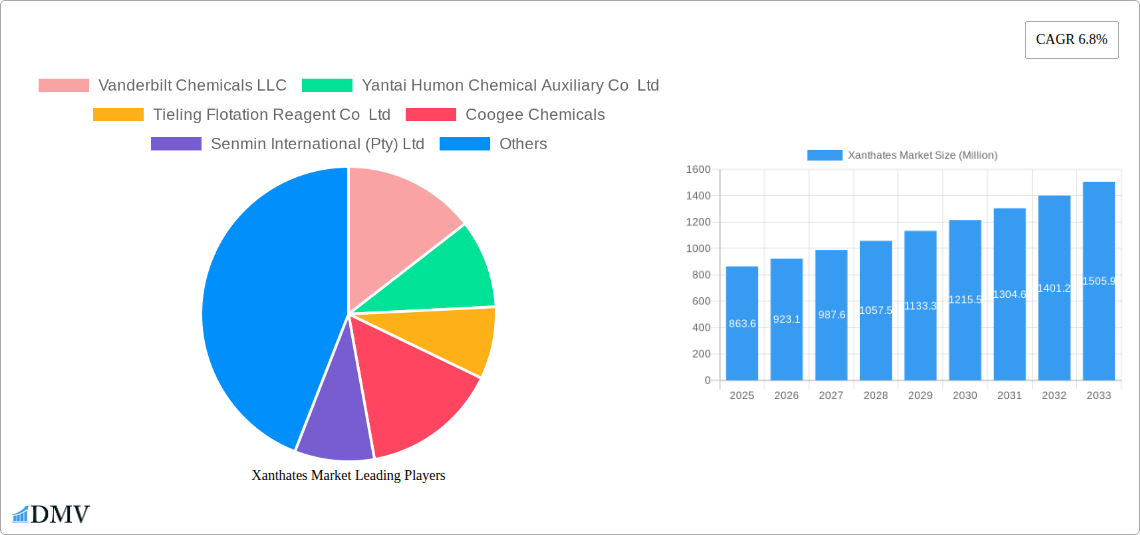
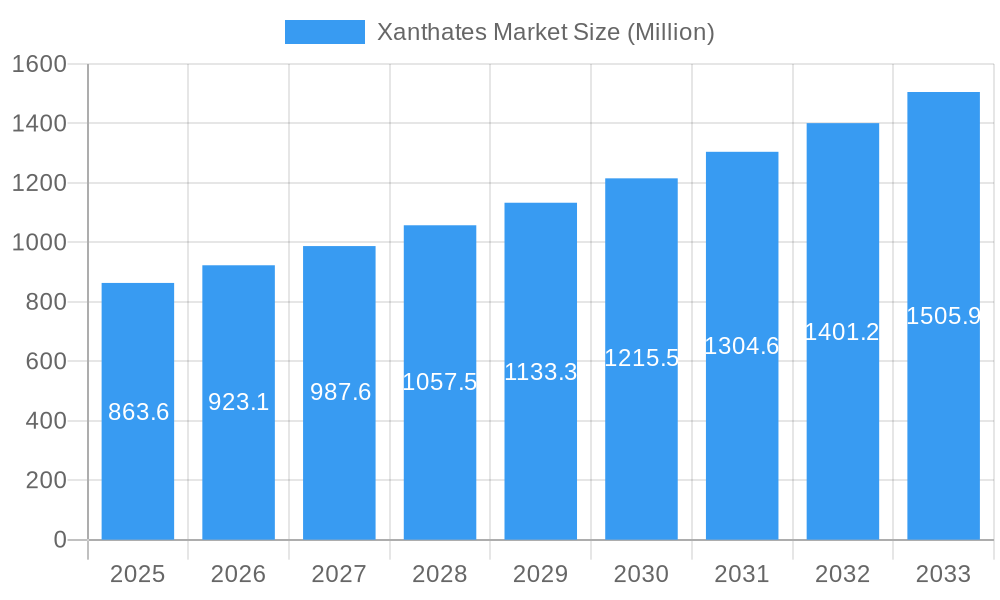
The global xanthates market, valued at $863.6 million in 2025, is projected to experience robust growth, driven by a Compound Annual Growth Rate (CAGR) of 6.8% from 2025 to 2033. This expansion is primarily fueled by the burgeoning mining industry, particularly the increasing demand for copper, gold, and other minerals. The rising adoption of xanthates in flotation processes for efficient mineral extraction contributes significantly to market growth. Furthermore, the expanding rubber processing sector, utilizing xanthates as accelerators and modifiers, is another key driver. While growth is expected across various applications, including agrochemicals, the mining segment remains the dominant force, shaping market trends and influencing future investments. Competition among established players like Vanderbilt Chemicals LLC, Orica Limited, and SNF Group, alongside emerging regional manufacturers, is expected to intensify, leading to pricing pressures and product innovation. The market's geographic distribution shows significant concentration in the Asia-Pacific region, fueled by China's robust mining and manufacturing sectors. North America and Europe also hold considerable market share, driven by established industries and stringent environmental regulations in these regions.
Xanthates Market Market Size (In Million)
The market segmentation reveals sodium ethyl xanthate as the leading product type, benefiting from its widespread application in diverse industries. However, other xanthate types, such as sodium isopropyl and sodium isobutyl xanthate, are expected to witness substantial growth owing to their specific advantages in certain applications. While the mining sector currently dominates application segments, growth opportunities exist within rubber processing and agrochemicals as these sectors witness technological advancements and increased demand. Potential restraints include fluctuating raw material prices, stringent environmental regulations concerning the handling and disposal of xanthates, and the exploration of alternative flotation reagents. However, ongoing research and development efforts focused on enhancing the efficiency and environmental profile of xanthates are expected to mitigate these challenges and support continued market expansion over the forecast period.
Xanthates Market Company Market Share
Xanthates Market: A Comprehensive Report (2019-2033)
This insightful report provides a detailed analysis of the global Xanthates Market, offering a comprehensive overview of its current state, future trajectory, and key players. Covering the period from 2019 to 2033, with a focus on 2025 as the base and estimated year, this report is essential for stakeholders seeking to understand and capitalize on opportunities within this dynamic market. The total market size in 2025 is estimated to be xx Million.
Xanthates Market Composition & Trends
This section delves into the intricate structure of the Xanthates Market, examining market concentration, innovation drivers, regulatory landscapes, substitute products, end-user profiles, and mergers & acquisitions (M&A) activities. We analyze the market share distribution among key players, revealing the competitive landscape. The report also quantifies the impact of M&A activities, estimating deal values in Millions. For instance, the market is moderately concentrated, with the top 5 players holding approximately xx% of the market share in 2025. Innovation in Xanthate production is driven primarily by the need for improved efficiency and environmental sustainability. Stringent environmental regulations are shaping the industry, influencing production methods and the development of eco-friendly alternatives.
- Market Concentration: Moderate, with top 5 players holding approximately xx% market share in 2025.
- Innovation Catalysts: Demand for higher efficiency and eco-friendly alternatives.
- Regulatory Landscape: Stringent environmental regulations are driving innovation.
- Substitute Products: Limited, with competition primarily from other flotation reagents.
- End-User Profiles: Predominantly mining, rubber processing, and agrochemical industries.
- M&A Activities: xx Million in deal values observed between 2019 and 2024.
Xanthates Market Industry Evolution
This section provides a detailed analysis of the Xanthates Market's evolution from 2019 to 2033, focusing on market growth trajectories, technological advancements, and shifting consumer demands. We explore the historical growth rate (2019-2024) at xx% CAGR and project the forecast growth rate (2025-2033) at xx% CAGR. Technological advancements, such as improved synthesis methods and the development of specialized Xanthates for specific applications, have significantly impacted market growth. The increasing demand for environmentally friendly chemicals has also driven innovation and influenced market trends. The shifting demand patterns toward specific Xanthate types based on application requirements are detailed in the report.
Leading Regions, Countries, or Segments in Xanthates Market
This section identifies the dominant regions, countries, and segments within the Xanthates Market. The mining sector consistently dominates the application segment, accounting for approximately xx% of total consumption in 2025. Sodium Ethyl Xanthate maintains its position as the leading product type, driven by its cost-effectiveness and wide applicability.
- Dominant Region: Asia-Pacific, driven by robust mining activities and manufacturing capabilities.
- Dominant Product Type: Sodium Ethyl Xanthate, due to cost-effectiveness and wide application.
- Dominant Application: Mining, due to its widespread use in mineral flotation.
Key Drivers:
- Mining Sector Growth: Significant investments in mining operations globally fuel demand.
- Government Support: Policies promoting sustainable mining practices contribute positively.
- Technological Advancements: Improved synthesis methods enhance production efficiency.
Xanthates Market Product Innovations
Recent innovations in Xanthate technology focus on enhancing performance characteristics, including improved selectivity, reduced consumption rates, and enhanced environmental friendliness. New formulations are being developed to address specific challenges in different applications, such as harsh mining conditions or specialized rubber processing needs. This includes the introduction of bio-based Xanthates and enhanced collector properties. These advancements offer significant improvements in terms of efficiency and sustainability, thus driving market growth.
Propelling Factors for Xanthates Market Growth
The Xanthates Market's growth is primarily driven by the expanding mining industry, particularly in developing economies. Technological advancements leading to more efficient and environmentally friendly production processes also contribute significantly. Furthermore, favorable government regulations in key regions support the continued expansion of the market.
Obstacles in the Xanthates Market Market
Significant obstacles include fluctuating raw material prices, environmental regulations, and intense competition from other flotation reagents. These factors can lead to price volatility and constrain market expansion. Supply chain disruptions due to geopolitical events can also impact production and availability, impacting market stability.
Future Opportunities in Xanthates Market
Emerging opportunities lie in the development of specialized Xanthates for niche applications, such as lithium extraction and rare earth element processing. Expanding into new geographical markets and further research into environmentally friendly alternatives represent significant growth potential for the market.
Major Players in the Xanthates Market Ecosystem
- Vanderbilt Chemicals LLC
- Yantai Humon Chemical Auxiliary Co Ltd
- Tieling Flotation Reagent Co Ltd
- Coogee Chemicals
- Senmin International (Pty) Ltd
- QiXia TongDa Flotation Reagent Co Ltd
- CTC Energy & Mining Company
- Orica Limited
- Amruta Industries
- SNF Group
Key Developments in Xanthates Market Industry
- 2022-Q4: Orica Limited launches a new, environmentally friendly Xanthate formulation.
- 2023-Q1: Merger between two smaller Xanthate producers leads to increased market consolidation.
- 2024-Q3: New regulations in the EU impact the production and distribution of certain Xanthate types.
Strategic Xanthates Market Market Forecast
The Xanthates Market is projected to witness strong growth in the forecast period (2025-2033), driven by the continuing expansion of the mining and related industries. Emerging applications and ongoing technological advancements are expected to further fuel market expansion. The focus on sustainability and the development of environmentally friendly alternatives will also play a significant role in shaping the future of the market.
Xanthates Market Segmentation
-
1. Product Type
- 1.1. Sodium Ethyl Xanthate
- 1.2. Sodium Isopropyl Xanthate
- 1.3. Sodium Isobutyl Xanthate
- 1.4. Potassium Amyl Xanthate
- 1.5. Other Product Types
-
2. Application
- 2.1. Mining
- 2.2. Rubber Processing
- 2.3. Agrochemicals
- 2.4. Other Applications
Xanthates Market Segmentation By Geography
-
1. Asia Pacific
- 1.1. China
- 1.2. India
- 1.3. Japan
- 1.4. South Korea
- 1.5. Rest of Asia Pacific
-
2. North America
- 2.1. United States
- 2.2. Canada
- 2.3. Mexico
-
3. Europe
- 3.1. Germany
- 3.2. United Kingdom
- 3.3. Italy
- 3.4. France
- 3.5. Rest of Europe
-
4. South America
- 4.1. Brazil
- 4.2. Argentina
- 4.3. Rest of South America
-
5. Middle East and Africa
- 5.1. Saudi Arabia
- 5.2. South Africa
- 5.3. Rest of Middle East and Africa
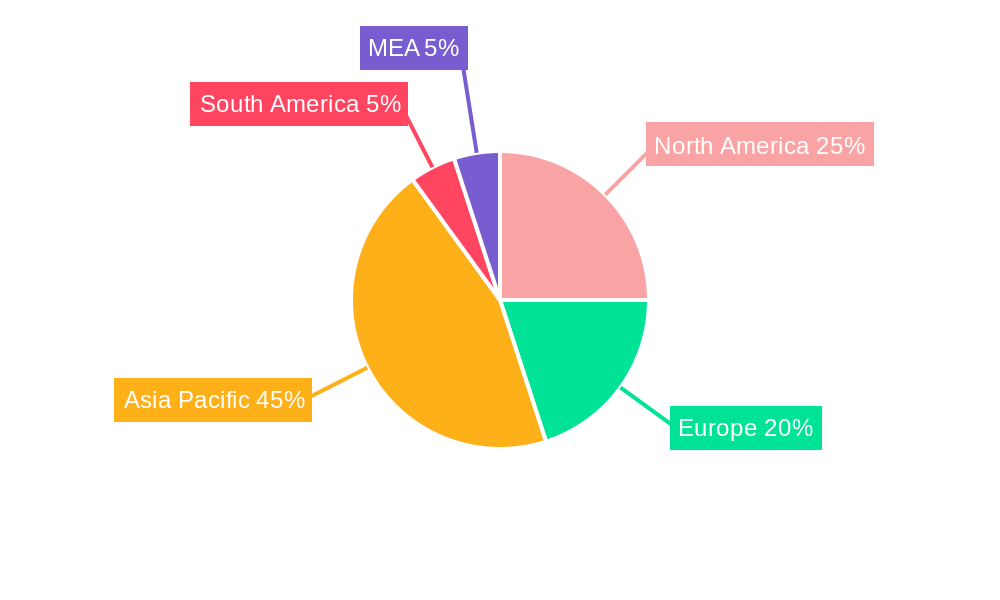
Xanthates Market Regional Market Share
Geographic Coverage of Xanthates Market
Xanthates Market REPORT HIGHLIGHTS
| Aspects | Details |
|---|---|
| Study Period | 2020-2034 |
| Base Year | 2025 |
| Estimated Year | 2026 |
| Forecast Period | 2026-2034 |
| Historical Period | 2020-2025 |
| Growth Rate | CAGR of 6.8% from 2020-2034 |
| Segmentation |
|
Table of Contents
- 1. Introduction
- 1.1. Research Scope
- 1.2. Market Segmentation
- 1.3. Research Objective
- 1.4. Definitions and Assumptions
- 2. Executive Summary
- 2.1. Market Snapshot
- 3. Market Dynamics
- 3.1. Market Drivers
- 3.2. Market Restrains
- 3.3. Market Trends
- 3.4. Market Opportunities
- 4. Market Factor Analysis
- 4.1. Porters Five Forces
- 4.1.1. Bargaining Power of Suppliers
- 4.1.2. Bargaining Power of Buyers
- 4.1.3. Threat of New Entrants
- 4.1.4. Threat of Substitutes
- 4.1.5. Competitive Rivalry
- 4.2. PESTEL analysis
- 4.3. BCG Analysis
- 4.3.1. Stars (High Growth, High Market Share)
- 4.3.2. Cash Cows (Low Growth, High Market Share)
- 4.3.3. Question Mark (High Growth, Low Market Share)
- 4.3.4. Dogs (Low Growth, Low Market Share)
- 4.4. Ansoff Matrix Analysis
- 4.5. Supply Chain Analysis
- 4.6. Regulatory Landscape
- 4.7. Current Market Potential and Opportunity Assessment (TAM–SAM–SOM Framework)
- 4.8. DMV Analyst Note
- 4.1. Porters Five Forces
- 5. Market Analysis, Insights and Forecast 2021-2033
- 5.1. Market Analysis, Insights and Forecast - by Product Type
- 5.1.1. Sodium Ethyl Xanthate
- 5.1.2. Sodium Isopropyl Xanthate
- 5.1.3. Sodium Isobutyl Xanthate
- 5.1.4. Potassium Amyl Xanthate
- 5.1.5. Other Product Types
- 5.2. Market Analysis, Insights and Forecast - by Application
- 5.2.1. Mining
- 5.2.2. Rubber Processing
- 5.2.3. Agrochemicals
- 5.2.4. Other Applications
- 5.3. Market Analysis, Insights and Forecast - by Region
- 5.3.1. Asia Pacific
- 5.3.2. North America
- 5.3.3. Europe
- 5.3.4. South America
- 5.3.5. Middle East and Africa
- 5.1. Market Analysis, Insights and Forecast - by Product Type
- 6. Global Xanthates Market Analysis, Insights and Forecast, 2021-2033
- 6.1. Market Analysis, Insights and Forecast - by Product Type
- 6.1.1. Sodium Ethyl Xanthate
- 6.1.2. Sodium Isopropyl Xanthate
- 6.1.3. Sodium Isobutyl Xanthate
- 6.1.4. Potassium Amyl Xanthate
- 6.1.5. Other Product Types
- 6.2. Market Analysis, Insights and Forecast - by Application
- 6.2.1. Mining
- 6.2.2. Rubber Processing
- 6.2.3. Agrochemicals
- 6.2.4. Other Applications
- 6.1. Market Analysis, Insights and Forecast - by Product Type
- 7. Asia Pacific Xanthates Market Analysis, Insights and Forecast, 2020-2032
- 7.1. Market Analysis, Insights and Forecast - by Product Type
- 7.1.1. Sodium Ethyl Xanthate
- 7.1.2. Sodium Isopropyl Xanthate
- 7.1.3. Sodium Isobutyl Xanthate
- 7.1.4. Potassium Amyl Xanthate
- 7.1.5. Other Product Types
- 7.2. Market Analysis, Insights and Forecast - by Application
- 7.2.1. Mining
- 7.2.2. Rubber Processing
- 7.2.3. Agrochemicals
- 7.2.4. Other Applications
- 7.1. Market Analysis, Insights and Forecast - by Product Type
- 8. North America Xanthates Market Analysis, Insights and Forecast, 2020-2032
- 8.1. Market Analysis, Insights and Forecast - by Product Type
- 8.1.1. Sodium Ethyl Xanthate
- 8.1.2. Sodium Isopropyl Xanthate
- 8.1.3. Sodium Isobutyl Xanthate
- 8.1.4. Potassium Amyl Xanthate
- 8.1.5. Other Product Types
- 8.2. Market Analysis, Insights and Forecast - by Application
- 8.2.1. Mining
- 8.2.2. Rubber Processing
- 8.2.3. Agrochemicals
- 8.2.4. Other Applications
- 8.1. Market Analysis, Insights and Forecast - by Product Type
- 9. Europe Xanthates Market Analysis, Insights and Forecast, 2020-2032
- 9.1. Market Analysis, Insights and Forecast - by Product Type
- 9.1.1. Sodium Ethyl Xanthate
- 9.1.2. Sodium Isopropyl Xanthate
- 9.1.3. Sodium Isobutyl Xanthate
- 9.1.4. Potassium Amyl Xanthate
- 9.1.5. Other Product Types
- 9.2. Market Analysis, Insights and Forecast - by Application
- 9.2.1. Mining
- 9.2.2. Rubber Processing
- 9.2.3. Agrochemicals
- 9.2.4. Other Applications
- 9.1. Market Analysis, Insights and Forecast - by Product Type
- 10. South America Xanthates Market Analysis, Insights and Forecast, 2020-2032
- 10.1. Market Analysis, Insights and Forecast - by Product Type
- 10.1.1. Sodium Ethyl Xanthate
- 10.1.2. Sodium Isopropyl Xanthate
- 10.1.3. Sodium Isobutyl Xanthate
- 10.1.4. Potassium Amyl Xanthate
- 10.1.5. Other Product Types
- 10.2. Market Analysis, Insights and Forecast - by Application
- 10.2.1. Mining
- 10.2.2. Rubber Processing
- 10.2.3. Agrochemicals
- 10.2.4. Other Applications
- 10.1. Market Analysis, Insights and Forecast - by Product Type
- 11. Middle East and Africa Xanthates Market Analysis, Insights and Forecast, 2020-2032
- 11.1. Market Analysis, Insights and Forecast - by Product Type
- 11.1.1. Sodium Ethyl Xanthate
- 11.1.2. Sodium Isopropyl Xanthate
- 11.1.3. Sodium Isobutyl Xanthate
- 11.1.4. Potassium Amyl Xanthate
- 11.1.5. Other Product Types
- 11.2. Market Analysis, Insights and Forecast - by Application
- 11.2.1. Mining
- 11.2.2. Rubber Processing
- 11.2.3. Agrochemicals
- 11.2.4. Other Applications
- 11.1. Market Analysis, Insights and Forecast - by Product Type
- 12. Competitive Analysis
- 12.1. Company Profiles
- 12.1.1 Vanderbilt Chemicals LLC
- 12.1.1.1. Company Overview
- 12.1.1.2. Products
- 12.1.1.3. Company Financials
- 12.1.1.4. SWOT Analysis
- 12.1.2 Yantai Humon Chemical Auxiliary Co Ltd
- 12.1.2.1. Company Overview
- 12.1.2.2. Products
- 12.1.2.3. Company Financials
- 12.1.2.4. SWOT Analysis
- 12.1.3 Tieling Flotation Reagent Co Ltd
- 12.1.3.1. Company Overview
- 12.1.3.2. Products
- 12.1.3.3. Company Financials
- 12.1.3.4. SWOT Analysis
- 12.1.4 Coogee Chemicals
- 12.1.4.1. Company Overview
- 12.1.4.2. Products
- 12.1.4.3. Company Financials
- 12.1.4.4. SWOT Analysis
- 12.1.5 Senmin International (Pty) Ltd
- 12.1.5.1. Company Overview
- 12.1.5.2. Products
- 12.1.5.3. Company Financials
- 12.1.5.4. SWOT Analysis
- 12.1.6 QiXia TongDa Flotation Reagent Co Ltd
- 12.1.6.1. Company Overview
- 12.1.6.2. Products
- 12.1.6.3. Company Financials
- 12.1.6.4. SWOT Analysis
- 12.1.7 CTC Energy & Mining Company
- 12.1.7.1. Company Overview
- 12.1.7.2. Products
- 12.1.7.3. Company Financials
- 12.1.7.4. SWOT Analysis
- 12.1.8 Orica Limited
- 12.1.8.1. Company Overview
- 12.1.8.2. Products
- 12.1.8.3. Company Financials
- 12.1.8.4. SWOT Analysis
- 12.1.9 Amruta Industries
- 12.1.9.1. Company Overview
- 12.1.9.2. Products
- 12.1.9.3. Company Financials
- 12.1.9.4. SWOT Analysis
- 12.1.10 SNF Group
- 12.1.10.1. Company Overview
- 12.1.10.2. Products
- 12.1.10.3. Company Financials
- 12.1.10.4. SWOT Analysis
- 12.1.1 Vanderbilt Chemicals LLC
- 12.2. Market Entropy
- 12.2.1 Company's Key Areas Served
- 12.2.2 Recent Developments
- 12.3. Company Market Share Analysis 2025
- 12.3.1 Top 5 Companies Market Share Analysis
- 12.3.2 Top 3 Companies Market Share Analysis
- 12.4. List of Potential Customers
- 13. Research Methodology
List of Figures
- Figure 1: Global Xanthates Market Revenue Breakdown (Million, %) by Region 2025 & 2033
- Figure 2: Global Xanthates Market Volume Breakdown (K Tons, %) by Region 2025 & 2033
- Figure 3: Asia Pacific Xanthates Market Revenue (Million), by Product Type 2025 & 2033
- Figure 4: Asia Pacific Xanthates Market Volume (K Tons), by Product Type 2025 & 2033
- Figure 5: Asia Pacific Xanthates Market Revenue Share (%), by Product Type 2025 & 2033
- Figure 6: Asia Pacific Xanthates Market Volume Share (%), by Product Type 2025 & 2033
- Figure 7: Asia Pacific Xanthates Market Revenue (Million), by Application 2025 & 2033
- Figure 8: Asia Pacific Xanthates Market Volume (K Tons), by Application 2025 & 2033
- Figure 9: Asia Pacific Xanthates Market Revenue Share (%), by Application 2025 & 2033
- Figure 10: Asia Pacific Xanthates Market Volume Share (%), by Application 2025 & 2033
- Figure 11: Asia Pacific Xanthates Market Revenue (Million), by Country 2025 & 2033
- Figure 12: Asia Pacific Xanthates Market Volume (K Tons), by Country 2025 & 2033
- Figure 13: Asia Pacific Xanthates Market Revenue Share (%), by Country 2025 & 2033
- Figure 14: Asia Pacific Xanthates Market Volume Share (%), by Country 2025 & 2033
- Figure 15: North America Xanthates Market Revenue (Million), by Product Type 2025 & 2033
- Figure 16: North America Xanthates Market Volume (K Tons), by Product Type 2025 & 2033
- Figure 17: North America Xanthates Market Revenue Share (%), by Product Type 2025 & 2033
- Figure 18: North America Xanthates Market Volume Share (%), by Product Type 2025 & 2033
- Figure 19: North America Xanthates Market Revenue (Million), by Application 2025 & 2033
- Figure 20: North America Xanthates Market Volume (K Tons), by Application 2025 & 2033
- Figure 21: North America Xanthates Market Revenue Share (%), by Application 2025 & 2033
- Figure 22: North America Xanthates Market Volume Share (%), by Application 2025 & 2033
- Figure 23: North America Xanthates Market Revenue (Million), by Country 2025 & 2033
- Figure 24: North America Xanthates Market Volume (K Tons), by Country 2025 & 2033
- Figure 25: North America Xanthates Market Revenue Share (%), by Country 2025 & 2033
- Figure 26: North America Xanthates Market Volume Share (%), by Country 2025 & 2033
- Figure 27: Europe Xanthates Market Revenue (Million), by Product Type 2025 & 2033
- Figure 28: Europe Xanthates Market Volume (K Tons), by Product Type 2025 & 2033
- Figure 29: Europe Xanthates Market Revenue Share (%), by Product Type 2025 & 2033
- Figure 30: Europe Xanthates Market Volume Share (%), by Product Type 2025 & 2033
- Figure 31: Europe Xanthates Market Revenue (Million), by Application 2025 & 2033
- Figure 32: Europe Xanthates Market Volume (K Tons), by Application 2025 & 2033
- Figure 33: Europe Xanthates Market Revenue Share (%), by Application 2025 & 2033
- Figure 34: Europe Xanthates Market Volume Share (%), by Application 2025 & 2033
- Figure 35: Europe Xanthates Market Revenue (Million), by Country 2025 & 2033
- Figure 36: Europe Xanthates Market Volume (K Tons), by Country 2025 & 2033
- Figure 37: Europe Xanthates Market Revenue Share (%), by Country 2025 & 2033
- Figure 38: Europe Xanthates Market Volume Share (%), by Country 2025 & 2033
- Figure 39: South America Xanthates Market Revenue (Million), by Product Type 2025 & 2033
- Figure 40: South America Xanthates Market Volume (K Tons), by Product Type 2025 & 2033
- Figure 41: South America Xanthates Market Revenue Share (%), by Product Type 2025 & 2033
- Figure 42: South America Xanthates Market Volume Share (%), by Product Type 2025 & 2033
- Figure 43: South America Xanthates Market Revenue (Million), by Application 2025 & 2033
- Figure 44: South America Xanthates Market Volume (K Tons), by Application 2025 & 2033
- Figure 45: South America Xanthates Market Revenue Share (%), by Application 2025 & 2033
- Figure 46: South America Xanthates Market Volume Share (%), by Application 2025 & 2033
- Figure 47: South America Xanthates Market Revenue (Million), by Country 2025 & 2033
- Figure 48: South America Xanthates Market Volume (K Tons), by Country 2025 & 2033
- Figure 49: South America Xanthates Market Revenue Share (%), by Country 2025 & 2033
- Figure 50: South America Xanthates Market Volume Share (%), by Country 2025 & 2033
- Figure 51: Middle East and Africa Xanthates Market Revenue (Million), by Product Type 2025 & 2033
- Figure 52: Middle East and Africa Xanthates Market Volume (K Tons), by Product Type 2025 & 2033
- Figure 53: Middle East and Africa Xanthates Market Revenue Share (%), by Product Type 2025 & 2033
- Figure 54: Middle East and Africa Xanthates Market Volume Share (%), by Product Type 2025 & 2033
- Figure 55: Middle East and Africa Xanthates Market Revenue (Million), by Application 2025 & 2033
- Figure 56: Middle East and Africa Xanthates Market Volume (K Tons), by Application 2025 & 2033
- Figure 57: Middle East and Africa Xanthates Market Revenue Share (%), by Application 2025 & 2033
- Figure 58: Middle East and Africa Xanthates Market Volume Share (%), by Application 2025 & 2033
- Figure 59: Middle East and Africa Xanthates Market Revenue (Million), by Country 2025 & 2033
- Figure 60: Middle East and Africa Xanthates Market Volume (K Tons), by Country 2025 & 2033
- Figure 61: Middle East and Africa Xanthates Market Revenue Share (%), by Country 2025 & 2033
- Figure 62: Middle East and Africa Xanthates Market Volume Share (%), by Country 2025 & 2033
List of Tables
- Table 1: Global Xanthates Market Revenue Million Forecast, by Product Type 2020 & 2033
- Table 2: Global Xanthates Market Volume K Tons Forecast, by Product Type 2020 & 2033
- Table 3: Global Xanthates Market Revenue Million Forecast, by Application 2020 & 2033
- Table 4: Global Xanthates Market Volume K Tons Forecast, by Application 2020 & 2033
- Table 5: Global Xanthates Market Revenue Million Forecast, by Region 2020 & 2033
- Table 6: Global Xanthates Market Volume K Tons Forecast, by Region 2020 & 2033
- Table 7: Global Xanthates Market Revenue Million Forecast, by Product Type 2020 & 2033
- Table 8: Global Xanthates Market Volume K Tons Forecast, by Product Type 2020 & 2033
- Table 9: Global Xanthates Market Revenue Million Forecast, by Application 2020 & 2033
- Table 10: Global Xanthates Market Volume K Tons Forecast, by Application 2020 & 2033
- Table 11: Global Xanthates Market Revenue Million Forecast, by Country 2020 & 2033
- Table 12: Global Xanthates Market Volume K Tons Forecast, by Country 2020 & 2033
- Table 13: China Xanthates Market Revenue (Million) Forecast, by Application 2020 & 2033
- Table 14: China Xanthates Market Volume (K Tons) Forecast, by Application 2020 & 2033
- Table 15: India Xanthates Market Revenue (Million) Forecast, by Application 2020 & 2033
- Table 16: India Xanthates Market Volume (K Tons) Forecast, by Application 2020 & 2033
- Table 17: Japan Xanthates Market Revenue (Million) Forecast, by Application 2020 & 2033
- Table 18: Japan Xanthates Market Volume (K Tons) Forecast, by Application 2020 & 2033
- Table 19: South Korea Xanthates Market Revenue (Million) Forecast, by Application 2020 & 2033
- Table 20: South Korea Xanthates Market Volume (K Tons) Forecast, by Application 2020 & 2033
- Table 21: Rest of Asia Pacific Xanthates Market Revenue (Million) Forecast, by Application 2020 & 2033
- Table 22: Rest of Asia Pacific Xanthates Market Volume (K Tons) Forecast, by Application 2020 & 2033
- Table 23: Global Xanthates Market Revenue Million Forecast, by Product Type 2020 & 2033
- Table 24: Global Xanthates Market Volume K Tons Forecast, by Product Type 2020 & 2033
- Table 25: Global Xanthates Market Revenue Million Forecast, by Application 2020 & 2033
- Table 26: Global Xanthates Market Volume K Tons Forecast, by Application 2020 & 2033
- Table 27: Global Xanthates Market Revenue Million Forecast, by Country 2020 & 2033
- Table 28: Global Xanthates Market Volume K Tons Forecast, by Country 2020 & 2033
- Table 29: United States Xanthates Market Revenue (Million) Forecast, by Application 2020 & 2033
- Table 30: United States Xanthates Market Volume (K Tons) Forecast, by Application 2020 & 2033
- Table 31: Canada Xanthates Market Revenue (Million) Forecast, by Application 2020 & 2033
- Table 32: Canada Xanthates Market Volume (K Tons) Forecast, by Application 2020 & 2033
- Table 33: Mexico Xanthates Market Revenue (Million) Forecast, by Application 2020 & 2033
- Table 34: Mexico Xanthates Market Volume (K Tons) Forecast, by Application 2020 & 2033
- Table 35: Global Xanthates Market Revenue Million Forecast, by Product Type 2020 & 2033
- Table 36: Global Xanthates Market Volume K Tons Forecast, by Product Type 2020 & 2033
- Table 37: Global Xanthates Market Revenue Million Forecast, by Application 2020 & 2033
- Table 38: Global Xanthates Market Volume K Tons Forecast, by Application 2020 & 2033
- Table 39: Global Xanthates Market Revenue Million Forecast, by Country 2020 & 2033
- Table 40: Global Xanthates Market Volume K Tons Forecast, by Country 2020 & 2033
- Table 41: Germany Xanthates Market Revenue (Million) Forecast, by Application 2020 & 2033
- Table 42: Germany Xanthates Market Volume (K Tons) Forecast, by Application 2020 & 2033
- Table 43: United Kingdom Xanthates Market Revenue (Million) Forecast, by Application 2020 & 2033
- Table 44: United Kingdom Xanthates Market Volume (K Tons) Forecast, by Application 2020 & 2033
- Table 45: Italy Xanthates Market Revenue (Million) Forecast, by Application 2020 & 2033
- Table 46: Italy Xanthates Market Volume (K Tons) Forecast, by Application 2020 & 2033
- Table 47: France Xanthates Market Revenue (Million) Forecast, by Application 2020 & 2033
- Table 48: France Xanthates Market Volume (K Tons) Forecast, by Application 2020 & 2033
- Table 49: Rest of Europe Xanthates Market Revenue (Million) Forecast, by Application 2020 & 2033
- Table 50: Rest of Europe Xanthates Market Volume (K Tons) Forecast, by Application 2020 & 2033
- Table 51: Global Xanthates Market Revenue Million Forecast, by Product Type 2020 & 2033
- Table 52: Global Xanthates Market Volume K Tons Forecast, by Product Type 2020 & 2033
- Table 53: Global Xanthates Market Revenue Million Forecast, by Application 2020 & 2033
- Table 54: Global Xanthates Market Volume K Tons Forecast, by Application 2020 & 2033
- Table 55: Global Xanthates Market Revenue Million Forecast, by Country 2020 & 2033
- Table 56: Global Xanthates Market Volume K Tons Forecast, by Country 2020 & 2033
- Table 57: Brazil Xanthates Market Revenue (Million) Forecast, by Application 2020 & 2033
- Table 58: Brazil Xanthates Market Volume (K Tons) Forecast, by Application 2020 & 2033
- Table 59: Argentina Xanthates Market Revenue (Million) Forecast, by Application 2020 & 2033
- Table 60: Argentina Xanthates Market Volume (K Tons) Forecast, by Application 2020 & 2033
- Table 61: Rest of South America Xanthates Market Revenue (Million) Forecast, by Application 2020 & 2033
- Table 62: Rest of South America Xanthates Market Volume (K Tons) Forecast, by Application 2020 & 2033
- Table 63: Global Xanthates Market Revenue Million Forecast, by Product Type 2020 & 2033
- Table 64: Global Xanthates Market Volume K Tons Forecast, by Product Type 2020 & 2033
- Table 65: Global Xanthates Market Revenue Million Forecast, by Application 2020 & 2033
- Table 66: Global Xanthates Market Volume K Tons Forecast, by Application 2020 & 2033
- Table 67: Global Xanthates Market Revenue Million Forecast, by Country 2020 & 2033
- Table 68: Global Xanthates Market Volume K Tons Forecast, by Country 2020 & 2033
- Table 69: Saudi Arabia Xanthates Market Revenue (Million) Forecast, by Application 2020 & 2033
- Table 70: Saudi Arabia Xanthates Market Volume (K Tons) Forecast, by Application 2020 & 2033
- Table 71: South Africa Xanthates Market Revenue (Million) Forecast, by Application 2020 & 2033
- Table 72: South Africa Xanthates Market Volume (K Tons) Forecast, by Application 2020 & 2033
- Table 73: Rest of Middle East and Africa Xanthates Market Revenue (Million) Forecast, by Application 2020 & 2033
- Table 74: Rest of Middle East and Africa Xanthates Market Volume (K Tons) Forecast, by Application 2020 & 2033
Frequently Asked Questions
1. What is the projected Compound Annual Growth Rate (CAGR) of the Xanthates Market?
The projected CAGR is approximately 6.8%.
2. Which companies are prominent players in the Xanthates Market?
Key companies in the market include Vanderbilt Chemicals LLC, Yantai Humon Chemical Auxiliary Co Ltd, Tieling Flotation Reagent Co Ltd, Coogee Chemicals, Senmin International (Pty) Ltd, QiXia TongDa Flotation Reagent Co Ltd, CTC Energy & Mining Company, Orica Limited, Amruta Industries, SNF Group.
3. What are the main segments of the Xanthates Market?
The market segments include Product Type, Application.
4. Can you provide details about the market size?
The market size is estimated to be USD 863.6 Million as of 2022.
5. What are some drivers contributing to market growth?
Rising Mining Activities Across the Globe; Widening Use of Xanthates in Rubber Industry.
6. What are the notable trends driving market growth?
Rising Mining Activities Across the Globe.
7. Are there any restraints impacting market growth?
Emergence of Xanthates Replacement Technology; Environmental Regulations Associated with Mining Activities.
8. Can you provide examples of recent developments in the market?
N/A
9. What pricing options are available for accessing the report?
Pricing options include single-user, multi-user, and enterprise licenses priced at USD 4750, USD 5250, and USD 8750 respectively.
10. Is the market size provided in terms of value or volume?
The market size is provided in terms of value, measured in Million and volume, measured in K Tons.
11. Are there any specific market keywords associated with the report?
Yes, the market keyword associated with the report is "Xanthates Market," which aids in identifying and referencing the specific market segment covered.
12. How do I determine which pricing option suits my needs best?
The pricing options vary based on user requirements and access needs. Individual users may opt for single-user licenses, while businesses requiring broader access may choose multi-user or enterprise licenses for cost-effective access to the report.
13. Are there any additional resources or data provided in the Xanthates Market report?
While the report offers comprehensive insights, it's advisable to review the specific contents or supplementary materials provided to ascertain if additional resources or data are available.
14. How can I stay updated on further developments or reports in the Xanthates Market?
To stay informed about further developments, trends, and reports in the Xanthates Market, consider subscribing to industry newsletters, following relevant companies and organizations, or regularly checking reputable industry news sources and publications.
Methodology
Step 1 - Identification of Relevant Samples Size from Population Database


Step 2 - Approaches for Defining Global Market Size (Value, Volume* & Price*)

Note*: In applicable scenarios
Step 3 - Data Sources
Primary Research
- Web Analytics
- Survey Reports
- Research Institute
- Latest Research Reports
- Opinion Leaders
Secondary Research
- Annual Reports
- White Paper
- Latest Press Release
- Industry Association
- Paid Database
- Investor Presentations

Step 4 - Data Triangulation
Involves using different sources of information in order to increase the validity of a study
These sources are likely to be stakeholders in a program - participants, other researchers, program staff, other community members, and so on.
Then we put all data in single framework & apply various statistical tools to find out the dynamic on the market.
During the analysis stage, feedback from the stakeholder groups would be compared to determine areas of agreement as well as areas of divergence