

Key Insights
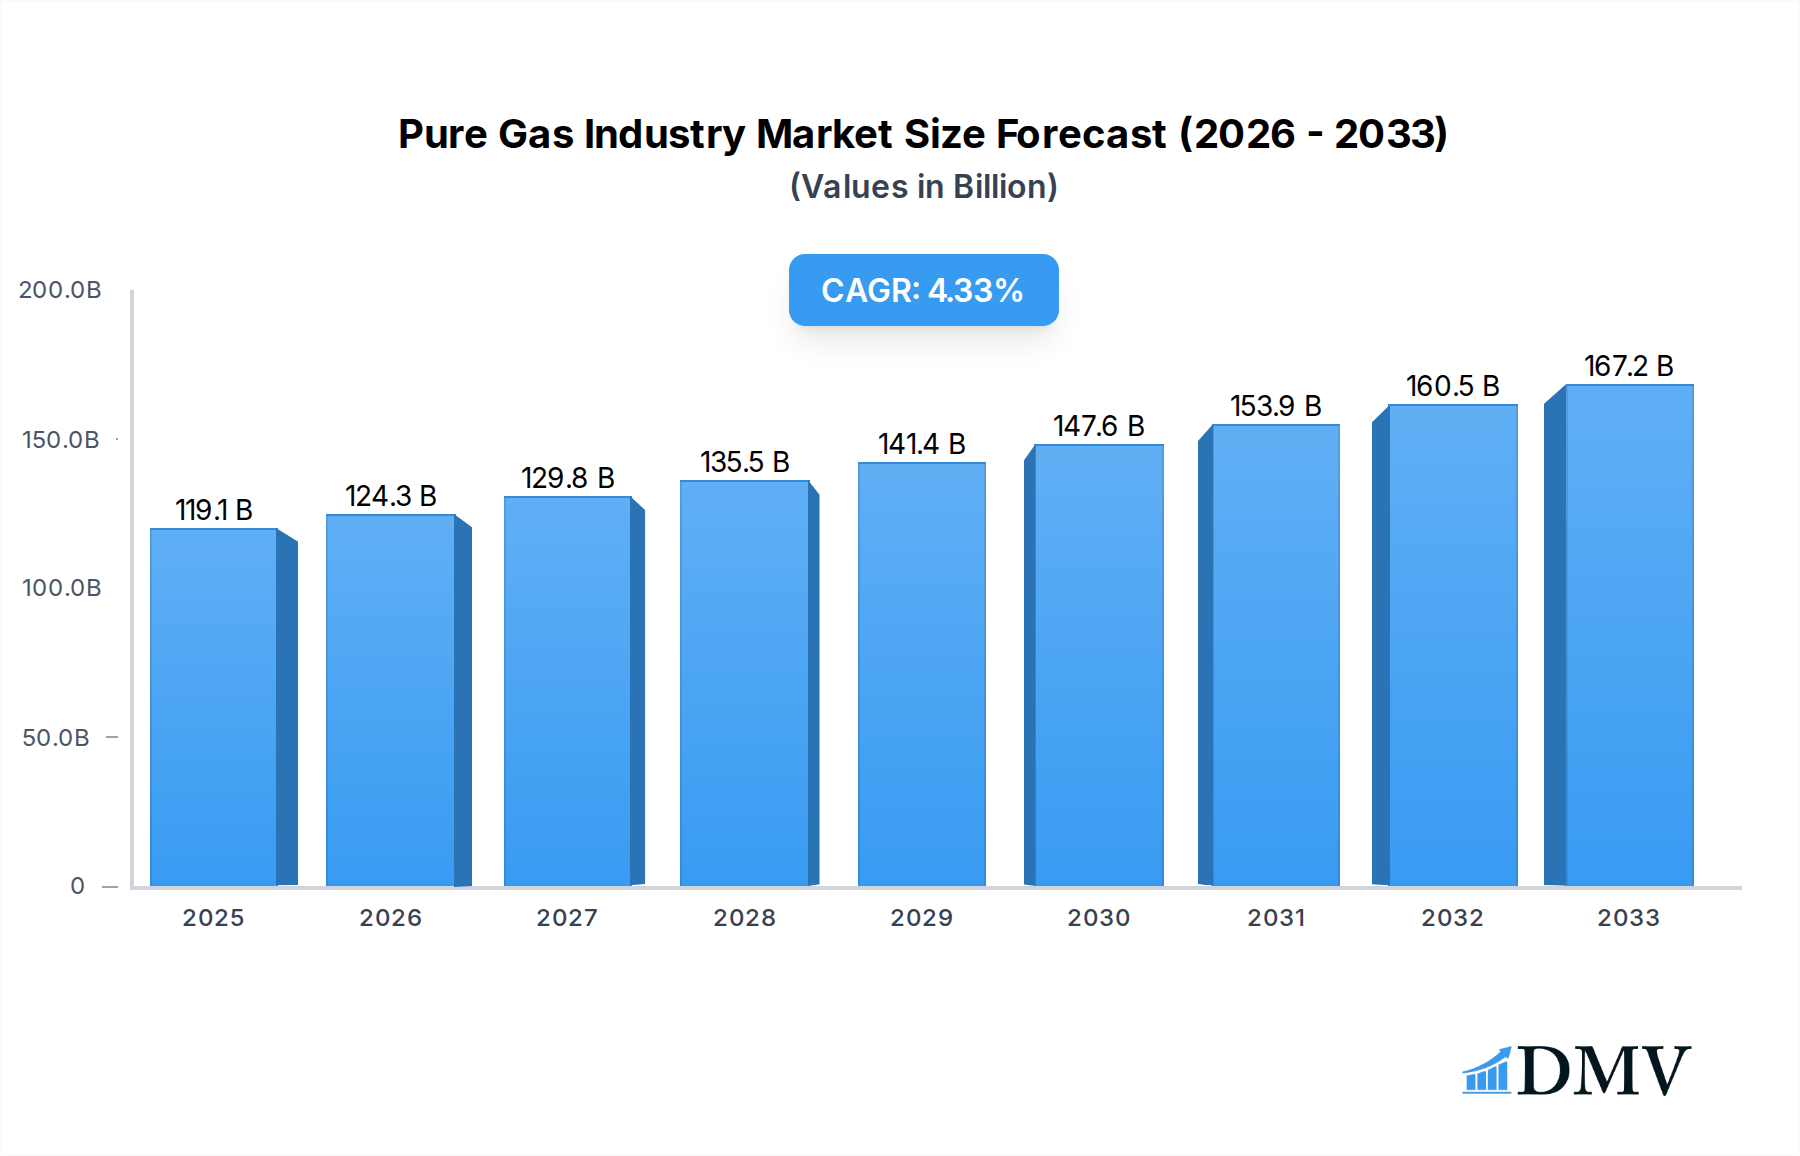
The global Pure Gas Industry is poised for substantial growth, projected to reach an estimated $119.11 billion by 2025, with a Compound Annual Growth Rate (CAGR) of 4.4% expected through 2033. This expansion is driven by the increasing demand across a multitude of critical sectors, most notably the booming electronics industry, which relies heavily on high-purity gases for semiconductor manufacturing and advanced component production. The metal production sector also represents a significant market, utilizing pure gases for welding, cutting, and heat treatment processes. Furthermore, the chemicals industry's continuous innovation and the burgeoning energy and power sector's need for specialized gases in renewable energy technologies contribute significantly to market expansion. The medical and healthcare industry's growing reliance on pure gases for diagnostics, therapy, and life support systems further solidifies this upward trajectory.

Pure Gas Industry Market Size (In Billion)
Key product segments, including High-Purity Atmospheric Gases, Noble Gases, and Carbon Gases, are expected to witness robust demand, fueled by their diverse applications such as advanced insulation techniques, energy-efficient lighting solutions, and cryogenic cooling. While the industry benefits from strong growth drivers, certain restraints such as the high cost of production and transportation of these specialized gases, alongside stringent regulatory frameworks concerning their handling and environmental impact, may present challenges. However, the inherent necessity of pure gases in driving technological advancements and supporting essential industries suggests a resilient and expanding market, with Asia Pacific anticipated to lead regional growth due to its strong manufacturing base and increasing industrialization.
Pure Gas Industry Company Market Share
Pure Gas Industry Market Composition & Trends
The global Pure Gas Industry is a dynamic and evolving sector, characterized by a moderate to high level of market concentration. Key players like Linde plc, Air Liquide, and Air Products and Chemicals Inc. command significant market share, estimated to be in the billions. Innovation remains a critical catalyst, driven by the increasing demand for high-purity gases in advanced manufacturing, electronics, and healthcare. Regulatory landscapes, though varied by region, generally favor stringent quality control and environmental standards, influencing production processes and product development. Substitute products, while present in some niche applications, rarely offer the same level of purity or specialized performance required by core industries. End-user profiles are increasingly sophisticated, with the Electronics sector leading demand, followed by Chemicals and Medical & Healthcare. Mergers and acquisitions (M&A) are ongoing strategic moves to consolidate market presence and expand technological capabilities, with deal values often reaching into the billions. For instance, historical M&A activities in the period 2019-2024 have seen significant financial commitments, reflecting the industry's growth potential. The market is witnessing a continuous effort to optimize supply chains and enhance distribution networks to meet the ever-growing and specific needs of a diverse clientele.
Pure Gas Industry Industry Evolution
The Pure Gas Industry has experienced a significant evolutionary trajectory, marked by consistent growth and technological advancements throughout the historical period of 2019-2024 and projected into the forecast period of 2025-2033. The market has navigated various economic cycles and industry shifts, consistently demonstrating resilience and adaptability. During the base year of 2025, the market is estimated to be valued in the hundreds of billions, with a projected Compound Annual Growth Rate (CAGR) that is expected to remain robust. Technological innovation has been a primary driver, with significant investments poured into enhancing purification techniques, developing novel gas mixtures, and improving delivery systems. This has been crucial in meeting the increasingly stringent purity requirements of high-tech industries such as semiconductor manufacturing and advanced research. Shifting consumer demands, particularly from the rapidly expanding Electronics and Medical & Healthcare sectors, have dictated a greater emphasis on specialty gases with ultra-high purity levels and specific isotopic compositions. The adoption of automation and digitalization within production facilities has also played a pivotal role in increasing efficiency, reducing costs, and ensuring consistent product quality. Furthermore, a growing awareness of environmental sustainability has spurred the development of greener production methods and more efficient gas recycling technologies. This continuous evolution is not merely about production capacity but also about the intelligent application and precise delivery of these critical industrial and medical resources. The industry's ability to respond to these multifaceted demands underscores its critical role in enabling technological progress across a wide spectrum of global industries.
Leading Regions, Countries, or Segments in Pure Gas Industry
The Pure Gas Industry exhibits a clear dominance by certain regions and segments, primarily driven by robust industrial ecosystems and significant investment trends.
Dominant Region: North America and Asia Pacific
- North America: This region, particularly the United States, stands out due to its advanced electronics manufacturing capabilities, substantial chemical production, and a burgeoning energy sector. The presence of major players like Air Products and Chemicals Inc. and Matheson Tri-Gas Inc. bolsters its leading position. Investment trends in semiconductor fabrication plants and renewable energy projects are key drivers. Regulatory support for critical industrial gases further solidifies its standing.
- Asia Pacific: Countries like China, Japan, and South Korea are experiencing rapid industrialization, leading to an insatiable demand for high-purity gases. The Electronics segment, especially in East Asia, is a colossal consumer of Noble Gases for semiconductor fabrication and atmospheric gases for various industrial processes. The extensive presence of companies like Iwatani Corporation and OSAKA GAS LIQUID Co Ltd signifies strong regional market players. Investment in advanced manufacturing and a growing healthcare infrastructure contribute significantly to this region's dominance.
Dominant Segments:
- Product Type: High-Purity Atmospheric Gases
- Drivers: Ubiquitous use in welding, metal production, chemicals, and food and beverages. Their broad applicability and established production infrastructure make them a foundational segment.
- Dominance Factors: Essential for numerous industrial processes, their widespread availability and relatively lower cost compared to specialty gases ensure consistent high volume demand.
- Application: Insulation
- Drivers: Critical for cryogenic applications in the Energy and Power sector, particularly in liquefied natural gas (LNG) transport and storage. Also vital for specialized cooling in electronics.
- Dominance Factors: The increasing global focus on energy efficiency and the growth of the LNG market directly fuel demand for gases used in insulation.
- End-user Industry: Electronics
- Drivers: The semiconductor industry's insatiable need for ultra-high purity gases like nitrogen, oxygen, argon, and specialty gases for etching, cleaning, and doping processes.
- Dominance Factors: Technological advancements in electronics, including the development of smaller and more powerful chips, require increasingly precise and pure gaseous inputs. This segment represents the highest value and most critical application for pure gases.
- End-user Industry: Medical and Healthcare
- Drivers: Demand for medical-grade oxygen, nitrous oxide, and noble gases for diagnostic imaging (MRI) and therapeutic applications.
- Dominance Factors: An aging global population and advancements in medical technology are driving consistent and growing demand for high-purity medical gases.
Pure Gas Industry Product Innovations
Product innovation in the Pure Gas Industry centers on achieving unprecedented purity levels and developing novel gas mixtures tailored for advanced applications. Companies are investing heavily in R&D to create gases with fewer than parts-per-trillion impurities for semiconductor lithography and advanced chip manufacturing. The development of specialty noble gas blends for enhanced lighting efficiency and unique cryogenic solutions for quantum computing are key areas. Performance metrics are increasingly defined by ultra-low contamination levels, precise isotopic ratios, and enhanced stability for sensitive processes. Unique selling propositions lie in the ability to provide custom-formulated gases that directly address the intricate demands of cutting-edge technological frontiers, ensuring optimal outcomes for customers in sectors like Electronics and advanced research.
Propelling Factors for Pure Gas Industry Growth
Several key factors are propelling the growth of the Pure Gas Industry. Technologically, the relentless advancement in the Electronics sector, particularly semiconductor manufacturing, demands increasingly higher purity atmospheric and noble gases, driving innovation and market expansion. Economically, the burgeoning demand for advanced materials in the Chemicals industry and the expansion of the global medical and healthcare sector, requiring precise medical-grade gases, are significant contributors. Furthermore, government initiatives and regulatory support for clean energy technologies, such as liquefied natural gas (LNG) for transportation and storage, are boosting the need for cryogenic gases used in insulation. The increasing adoption of pure gases in food and beverage preservation and in metal production further broadens the market's growth trajectory.
Obstacles in the Pure Gas Industry Market
Despite robust growth, the Pure Gas Industry faces several obstacles. Stringent regulatory compliance, particularly concerning the handling and transportation of high-purity and hazardous gases, adds significant operational costs and complexity. Supply chain disruptions, exacerbated by geopolitical events and logistics challenges, can lead to shortages and price volatility for critical raw materials and gases. Intense competition among major players, including Linde plc and Air Liquide, can put pressure on profit margins. Furthermore, the high capital investment required for state-of-the-art production facilities and purification technologies presents a barrier to entry for new, smaller players, limiting market dynamism. Fluctuations in energy prices also impact production costs, creating an additional layer of economic uncertainty.
Future Opportunities in Pure Gas Industry
The Pure Gas Industry is poised to capitalize on several emerging opportunities. The expansion of the quantum computing sector will create significant demand for highly specialized noble gases and cryogenic solutions. The growing adoption of green hydrogen production and its integration into energy grids will necessitate advanced gas separation and purification technologies. Furthermore, the continuous evolution of medical diagnostics and treatments, such as advanced imaging techniques and gene therapy, will fuel demand for ultra-pure medical gases and rare isotopes. The increasing focus on sustainability and circular economy principles presents opportunities for developing innovative gas recycling and recovery systems, further enhancing market appeal.
Major Players in the Pure Gas Industry Ecosystem
- Air Products and Chemicals Inc.
- Advanced Specialty Gases
- Linde plc
- OSAKA GAS LIQUID Co Ltd
- Matheson Tri-Gas Inc
- Iwatani Corporation
- American Welding & Gas
- Messer Group
- Air Liquide
- Airgas Inc
Key Developments in Pure Gas Industry Industry
- 2024: Linde plc announces significant investment in a new air separation unit to support growing demand for industrial gases in the semiconductor sector.
- 2023: Air Liquide expands its medical gas supply chain to meet increasing healthcare needs in emerging markets.
- 2023: Air Products and Chemicals Inc. showcases advancements in cryogenic technologies for sustainable energy solutions.
- 2022: Matheson Tri-Gas Inc. acquires a regional specialty gas distributor to enhance its market reach in North America.
- 2021: Iwatani Corporation strengthens its position in the hydrogen energy market with strategic partnerships.
- 2020: OSAKA GAS LIQUID Co Ltd focuses on developing ultra-high purity gases for next-generation electronics manufacturing.
- 2019: Messer Group expands its industrial gas operations in Europe through targeted acquisitions.
Strategic Pure Gas Industry Market Forecast
The strategic forecast for the Pure Gas Industry indicates sustained growth, driven by the insatiable demand from the high-growth Electronics and Medical & Healthcare sectors. Innovations in ultra-high purity gases and specialized mixtures will continue to unlock new applications. The increasing emphasis on sustainable energy, particularly hydrogen, will create substantial opportunities for gas producers. While regulatory hurdles and supply chain complexities persist, the industry's capacity for innovation and its critical role in enabling technological advancements across multiple industries position it for a prosperous future, with market value projected to reach unprecedented billions.
Pure Gas Industry Segmentation
-
1. Product Type
- 1.1. High-Purity Atmospheric Gases
- 1.2. Noble Gases
- 1.3. Carbon Gases
- 1.4. Other Product Types
-
2. Application
- 2.1. Insulation
- 2.2. Lighting
- 2.3. Coolant
- 2.4. Other Applications
-
3. End-user Industry
- 3.1. Electronics
- 3.2. Metal Production
- 3.3. Chemicals
- 3.4. Energy and Power
- 3.5. Medical and Healthcare
- 3.6. Food and Beverages
- 3.7. Other End-user Industries
Pure Gas Industry Segmentation By Geography
-
1. Asia Pacific
- 1.1. China
- 1.2. India
- 1.3. Japan
- 1.4. South Korea
- 1.5. ASEAN Countries
- 1.6. Rest of Asia Pacific
-
2. North America
- 2.1. United States
- 2.2. Canada
- 2.3. Mexico
-
3. Europe
- 3.1. Germany
- 3.2. United Kingdom
- 3.3. Italy
- 3.4. France
- 3.5. Rest of Europe
-
4. South America
- 4.1. Brazil
- 4.2. Argentina
- 4.3. Rest of South America
-
5. Middle East and Africa
- 5.1. Saudi Arabia
- 5.2. South Africa
- 5.3. Rest of Middle East and Africa
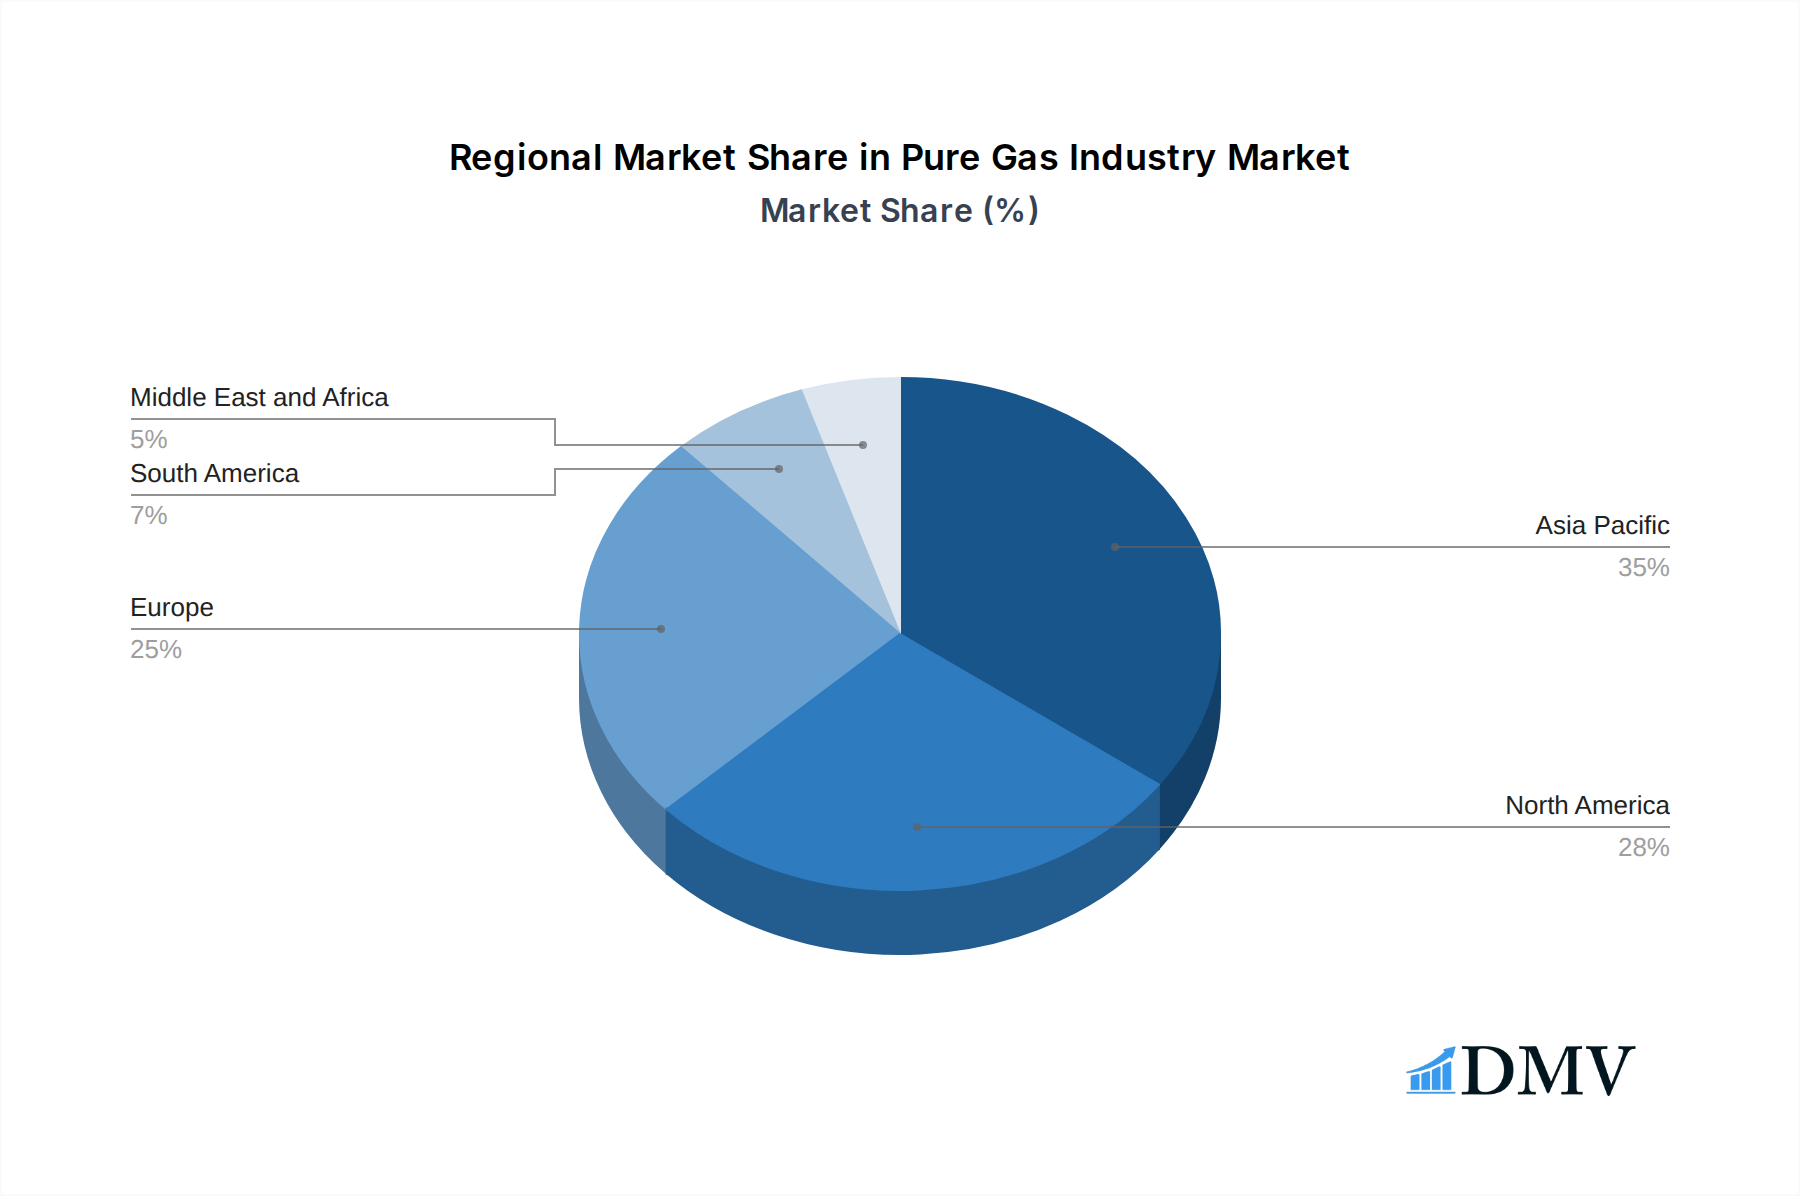
Pure Gas Industry Regional Market Share
Geographic Coverage of Pure Gas Industry
Pure Gas Industry REPORT HIGHLIGHTS
| Aspects | Details |
|---|---|
| Study Period | 2020-2034 |
| Base Year | 2025 |
| Estimated Year | 2026 |
| Forecast Period | 2026-2034 |
| Historical Period | 2020-2025 |
| Growth Rate | CAGR of 4.4% from 2020-2034 |
| Segmentation |
|
Table of Contents
- 1. Introduction
- 1.1. Research Scope
- 1.2. Market Segmentation
- 1.3. Research Objective
- 1.4. Definitions and Assumptions
- 2. Executive Summary
- 2.1. Market Snapshot
- 3. Market Dynamics
- 3.1. Market Drivers
- 3.2. Market Restrains
- 3.3. Market Trends
- 3.4. Market Opportunities
- 4. Market Factor Analysis
- 4.1. Porters Five Forces
- 4.1.1. Bargaining Power of Suppliers
- 4.1.2. Bargaining Power of Buyers
- 4.1.3. Threat of New Entrants
- 4.1.4. Threat of Substitutes
- 4.1.5. Competitive Rivalry
- 4.2. PESTEL analysis
- 4.3. BCG Analysis
- 4.3.1. Stars (High Growth, High Market Share)
- 4.3.2. Cash Cows (Low Growth, High Market Share)
- 4.3.3. Question Mark (High Growth, Low Market Share)
- 4.3.4. Dogs (Low Growth, Low Market Share)
- 4.4. Ansoff Matrix Analysis
- 4.5. Supply Chain Analysis
- 4.6. Regulatory Landscape
- 4.7. Current Market Potential and Opportunity Assessment (TAM–SAM–SOM Framework)
- 4.8. DMV Analyst Note
- 4.1. Porters Five Forces
- 5. Market Analysis, Insights and Forecast 2021-2033
- 5.1. Market Analysis, Insights and Forecast - by Product Type
- 5.1.1. High-Purity Atmospheric Gases
- 5.1.2. Noble Gases
- 5.1.3. Carbon Gases
- 5.1.4. Other Product Types
- 5.2. Market Analysis, Insights and Forecast - by Application
- 5.2.1. Insulation
- 5.2.2. Lighting
- 5.2.3. Coolant
- 5.2.4. Other Applications
- 5.3. Market Analysis, Insights and Forecast - by End-user Industry
- 5.3.1. Electronics
- 5.3.2. Metal Production
- 5.3.3. Chemicals
- 5.3.4. Energy and Power
- 5.3.5. Medical and Healthcare
- 5.3.6. Food and Beverages
- 5.3.7. Other End-user Industries
- 5.4. Market Analysis, Insights and Forecast - by Region
- 5.4.1. Asia Pacific
- 5.4.2. North America
- 5.4.3. Europe
- 5.4.4. South America
- 5.4.5. Middle East and Africa
- 5.1. Market Analysis, Insights and Forecast - by Product Type
- 6. Global Pure Gas Industry Analysis, Insights and Forecast, 2021-2033
- 6.1. Market Analysis, Insights and Forecast - by Product Type
- 6.1.1. High-Purity Atmospheric Gases
- 6.1.2. Noble Gases
- 6.1.3. Carbon Gases
- 6.1.4. Other Product Types
- 6.2. Market Analysis, Insights and Forecast - by Application
- 6.2.1. Insulation
- 6.2.2. Lighting
- 6.2.3. Coolant
- 6.2.4. Other Applications
- 6.3. Market Analysis, Insights and Forecast - by End-user Industry
- 6.3.1. Electronics
- 6.3.2. Metal Production
- 6.3.3. Chemicals
- 6.3.4. Energy and Power
- 6.3.5. Medical and Healthcare
- 6.3.6. Food and Beverages
- 6.3.7. Other End-user Industries
- 6.1. Market Analysis, Insights and Forecast - by Product Type
- 7. Asia Pacific Pure Gas Industry Analysis, Insights and Forecast, 2020-2032
- 7.1. Market Analysis, Insights and Forecast - by Product Type
- 7.1.1. High-Purity Atmospheric Gases
- 7.1.2. Noble Gases
- 7.1.3. Carbon Gases
- 7.1.4. Other Product Types
- 7.2. Market Analysis, Insights and Forecast - by Application
- 7.2.1. Insulation
- 7.2.2. Lighting
- 7.2.3. Coolant
- 7.2.4. Other Applications
- 7.3. Market Analysis, Insights and Forecast - by End-user Industry
- 7.3.1. Electronics
- 7.3.2. Metal Production
- 7.3.3. Chemicals
- 7.3.4. Energy and Power
- 7.3.5. Medical and Healthcare
- 7.3.6. Food and Beverages
- 7.3.7. Other End-user Industries
- 7.1. Market Analysis, Insights and Forecast - by Product Type
- 8. North America Pure Gas Industry Analysis, Insights and Forecast, 2020-2032
- 8.1. Market Analysis, Insights and Forecast - by Product Type
- 8.1.1. High-Purity Atmospheric Gases
- 8.1.2. Noble Gases
- 8.1.3. Carbon Gases
- 8.1.4. Other Product Types
- 8.2. Market Analysis, Insights and Forecast - by Application
- 8.2.1. Insulation
- 8.2.2. Lighting
- 8.2.3. Coolant
- 8.2.4. Other Applications
- 8.3. Market Analysis, Insights and Forecast - by End-user Industry
- 8.3.1. Electronics
- 8.3.2. Metal Production
- 8.3.3. Chemicals
- 8.3.4. Energy and Power
- 8.3.5. Medical and Healthcare
- 8.3.6. Food and Beverages
- 8.3.7. Other End-user Industries
- 8.1. Market Analysis, Insights and Forecast - by Product Type
- 9. Europe Pure Gas Industry Analysis, Insights and Forecast, 2020-2032
- 9.1. Market Analysis, Insights and Forecast - by Product Type
- 9.1.1. High-Purity Atmospheric Gases
- 9.1.2. Noble Gases
- 9.1.3. Carbon Gases
- 9.1.4. Other Product Types
- 9.2. Market Analysis, Insights and Forecast - by Application
- 9.2.1. Insulation
- 9.2.2. Lighting
- 9.2.3. Coolant
- 9.2.4. Other Applications
- 9.3. Market Analysis, Insights and Forecast - by End-user Industry
- 9.3.1. Electronics
- 9.3.2. Metal Production
- 9.3.3. Chemicals
- 9.3.4. Energy and Power
- 9.3.5. Medical and Healthcare
- 9.3.6. Food and Beverages
- 9.3.7. Other End-user Industries
- 9.1. Market Analysis, Insights and Forecast - by Product Type
- 10. South America Pure Gas Industry Analysis, Insights and Forecast, 2020-2032
- 10.1. Market Analysis, Insights and Forecast - by Product Type
- 10.1.1. High-Purity Atmospheric Gases
- 10.1.2. Noble Gases
- 10.1.3. Carbon Gases
- 10.1.4. Other Product Types
- 10.2. Market Analysis, Insights and Forecast - by Application
- 10.2.1. Insulation
- 10.2.2. Lighting
- 10.2.3. Coolant
- 10.2.4. Other Applications
- 10.3. Market Analysis, Insights and Forecast - by End-user Industry
- 10.3.1. Electronics
- 10.3.2. Metal Production
- 10.3.3. Chemicals
- 10.3.4. Energy and Power
- 10.3.5. Medical and Healthcare
- 10.3.6. Food and Beverages
- 10.3.7. Other End-user Industries
- 10.1. Market Analysis, Insights and Forecast - by Product Type
- 11. Middle East and Africa Pure Gas Industry Analysis, Insights and Forecast, 2020-2032
- 11.1. Market Analysis, Insights and Forecast - by Product Type
- 11.1.1. High-Purity Atmospheric Gases
- 11.1.2. Noble Gases
- 11.1.3. Carbon Gases
- 11.1.4. Other Product Types
- 11.2. Market Analysis, Insights and Forecast - by Application
- 11.2.1. Insulation
- 11.2.2. Lighting
- 11.2.3. Coolant
- 11.2.4. Other Applications
- 11.3. Market Analysis, Insights and Forecast - by End-user Industry
- 11.3.1. Electronics
- 11.3.2. Metal Production
- 11.3.3. Chemicals
- 11.3.4. Energy and Power
- 11.3.5. Medical and Healthcare
- 11.3.6. Food and Beverages
- 11.3.7. Other End-user Industries
- 11.1. Market Analysis, Insights and Forecast - by Product Type
- 12. Competitive Analysis
- 12.1. Company Profiles
- 12.1.1 Air Products and Chemicals Inc
- 12.1.1.1. Company Overview
- 12.1.1.2. Products
- 12.1.1.3. Company Financials
- 12.1.1.4. SWOT Analysis
- 12.1.2 Advanced Specialty Gases
- 12.1.2.1. Company Overview
- 12.1.2.2. Products
- 12.1.2.3. Company Financials
- 12.1.2.4. SWOT Analysis
- 12.1.3 Linde plc*List Not Exhaustive
- 12.1.3.1. Company Overview
- 12.1.3.2. Products
- 12.1.3.3. Company Financials
- 12.1.3.4. SWOT Analysis
- 12.1.4 OSAKA GAS LIQUID Co Ltd
- 12.1.4.1. Company Overview
- 12.1.4.2. Products
- 12.1.4.3. Company Financials
- 12.1.4.4. SWOT Analysis
- 12.1.5 Matheson Tri-Gas Inc
- 12.1.5.1. Company Overview
- 12.1.5.2. Products
- 12.1.5.3. Company Financials
- 12.1.5.4. SWOT Analysis
- 12.1.6 Iwatani Corporation
- 12.1.6.1. Company Overview
- 12.1.6.2. Products
- 12.1.6.3. Company Financials
- 12.1.6.4. SWOT Analysis
- 12.1.7 American Welding & Gas
- 12.1.7.1. Company Overview
- 12.1.7.2. Products
- 12.1.7.3. Company Financials
- 12.1.7.4. SWOT Analysis
- 12.1.8 Messer Group
- 12.1.8.1. Company Overview
- 12.1.8.2. Products
- 12.1.8.3. Company Financials
- 12.1.8.4. SWOT Analysis
- 12.1.9 Air Liquide
- 12.1.9.1. Company Overview
- 12.1.9.2. Products
- 12.1.9.3. Company Financials
- 12.1.9.4. SWOT Analysis
- 12.1.10 Airgas Inc
- 12.1.10.1. Company Overview
- 12.1.10.2. Products
- 12.1.10.3. Company Financials
- 12.1.10.4. SWOT Analysis
- 12.1.1 Air Products and Chemicals Inc
- 12.2. Market Entropy
- 12.2.1 Company's Key Areas Served
- 12.2.2 Recent Developments
- 12.3. Company Market Share Analysis 2025
- 12.3.1 Top 5 Companies Market Share Analysis
- 12.3.2 Top 3 Companies Market Share Analysis
- 12.4. List of Potential Customers
- 13. Research Methodology
List of Figures
- Figure 1: Global Pure Gas Industry Revenue Breakdown (billion, %) by Region 2025 & 2033
- Figure 2: Asia Pacific Pure Gas Industry Revenue (billion), by Product Type 2025 & 2033
- Figure 3: Asia Pacific Pure Gas Industry Revenue Share (%), by Product Type 2025 & 2033
- Figure 4: Asia Pacific Pure Gas Industry Revenue (billion), by Application 2025 & 2033
- Figure 5: Asia Pacific Pure Gas Industry Revenue Share (%), by Application 2025 & 2033
- Figure 6: Asia Pacific Pure Gas Industry Revenue (billion), by End-user Industry 2025 & 2033
- Figure 7: Asia Pacific Pure Gas Industry Revenue Share (%), by End-user Industry 2025 & 2033
- Figure 8: Asia Pacific Pure Gas Industry Revenue (billion), by Country 2025 & 2033
- Figure 9: Asia Pacific Pure Gas Industry Revenue Share (%), by Country 2025 & 2033
- Figure 10: North America Pure Gas Industry Revenue (billion), by Product Type 2025 & 2033
- Figure 11: North America Pure Gas Industry Revenue Share (%), by Product Type 2025 & 2033
- Figure 12: North America Pure Gas Industry Revenue (billion), by Application 2025 & 2033
- Figure 13: North America Pure Gas Industry Revenue Share (%), by Application 2025 & 2033
- Figure 14: North America Pure Gas Industry Revenue (billion), by End-user Industry 2025 & 2033
- Figure 15: North America Pure Gas Industry Revenue Share (%), by End-user Industry 2025 & 2033
- Figure 16: North America Pure Gas Industry Revenue (billion), by Country 2025 & 2033
- Figure 17: North America Pure Gas Industry Revenue Share (%), by Country 2025 & 2033
- Figure 18: Europe Pure Gas Industry Revenue (billion), by Product Type 2025 & 2033
- Figure 19: Europe Pure Gas Industry Revenue Share (%), by Product Type 2025 & 2033
- Figure 20: Europe Pure Gas Industry Revenue (billion), by Application 2025 & 2033
- Figure 21: Europe Pure Gas Industry Revenue Share (%), by Application 2025 & 2033
- Figure 22: Europe Pure Gas Industry Revenue (billion), by End-user Industry 2025 & 2033
- Figure 23: Europe Pure Gas Industry Revenue Share (%), by End-user Industry 2025 & 2033
- Figure 24: Europe Pure Gas Industry Revenue (billion), by Country 2025 & 2033
- Figure 25: Europe Pure Gas Industry Revenue Share (%), by Country 2025 & 2033
- Figure 26: South America Pure Gas Industry Revenue (billion), by Product Type 2025 & 2033
- Figure 27: South America Pure Gas Industry Revenue Share (%), by Product Type 2025 & 2033
- Figure 28: South America Pure Gas Industry Revenue (billion), by Application 2025 & 2033
- Figure 29: South America Pure Gas Industry Revenue Share (%), by Application 2025 & 2033
- Figure 30: South America Pure Gas Industry Revenue (billion), by End-user Industry 2025 & 2033
- Figure 31: South America Pure Gas Industry Revenue Share (%), by End-user Industry 2025 & 2033
- Figure 32: South America Pure Gas Industry Revenue (billion), by Country 2025 & 2033
- Figure 33: South America Pure Gas Industry Revenue Share (%), by Country 2025 & 2033
- Figure 34: Middle East and Africa Pure Gas Industry Revenue (billion), by Product Type 2025 & 2033
- Figure 35: Middle East and Africa Pure Gas Industry Revenue Share (%), by Product Type 2025 & 2033
- Figure 36: Middle East and Africa Pure Gas Industry Revenue (billion), by Application 2025 & 2033
- Figure 37: Middle East and Africa Pure Gas Industry Revenue Share (%), by Application 2025 & 2033
- Figure 38: Middle East and Africa Pure Gas Industry Revenue (billion), by End-user Industry 2025 & 2033
- Figure 39: Middle East and Africa Pure Gas Industry Revenue Share (%), by End-user Industry 2025 & 2033
- Figure 40: Middle East and Africa Pure Gas Industry Revenue (billion), by Country 2025 & 2033
- Figure 41: Middle East and Africa Pure Gas Industry Revenue Share (%), by Country 2025 & 2033
List of Tables
- Table 1: Global Pure Gas Industry Revenue billion Forecast, by Product Type 2020 & 2033
- Table 2: Global Pure Gas Industry Revenue billion Forecast, by Application 2020 & 2033
- Table 3: Global Pure Gas Industry Revenue billion Forecast, by End-user Industry 2020 & 2033
- Table 4: Global Pure Gas Industry Revenue billion Forecast, by Region 2020 & 2033
- Table 5: Global Pure Gas Industry Revenue billion Forecast, by Product Type 2020 & 2033
- Table 6: Global Pure Gas Industry Revenue billion Forecast, by Application 2020 & 2033
- Table 7: Global Pure Gas Industry Revenue billion Forecast, by End-user Industry 2020 & 2033
- Table 8: Global Pure Gas Industry Revenue billion Forecast, by Country 2020 & 2033
- Table 9: China Pure Gas Industry Revenue (billion) Forecast, by Application 2020 & 2033
- Table 10: India Pure Gas Industry Revenue (billion) Forecast, by Application 2020 & 2033
- Table 11: Japan Pure Gas Industry Revenue (billion) Forecast, by Application 2020 & 2033
- Table 12: South Korea Pure Gas Industry Revenue (billion) Forecast, by Application 2020 & 2033
- Table 13: ASEAN Countries Pure Gas Industry Revenue (billion) Forecast, by Application 2020 & 2033
- Table 14: Rest of Asia Pacific Pure Gas Industry Revenue (billion) Forecast, by Application 2020 & 2033
- Table 15: Global Pure Gas Industry Revenue billion Forecast, by Product Type 2020 & 2033
- Table 16: Global Pure Gas Industry Revenue billion Forecast, by Application 2020 & 2033
- Table 17: Global Pure Gas Industry Revenue billion Forecast, by End-user Industry 2020 & 2033
- Table 18: Global Pure Gas Industry Revenue billion Forecast, by Country 2020 & 2033
- Table 19: United States Pure Gas Industry Revenue (billion) Forecast, by Application 2020 & 2033
- Table 20: Canada Pure Gas Industry Revenue (billion) Forecast, by Application 2020 & 2033
- Table 21: Mexico Pure Gas Industry Revenue (billion) Forecast, by Application 2020 & 2033
- Table 22: Global Pure Gas Industry Revenue billion Forecast, by Product Type 2020 & 2033
- Table 23: Global Pure Gas Industry Revenue billion Forecast, by Application 2020 & 2033
- Table 24: Global Pure Gas Industry Revenue billion Forecast, by End-user Industry 2020 & 2033
- Table 25: Global Pure Gas Industry Revenue billion Forecast, by Country 2020 & 2033
- Table 26: Germany Pure Gas Industry Revenue (billion) Forecast, by Application 2020 & 2033
- Table 27: United Kingdom Pure Gas Industry Revenue (billion) Forecast, by Application 2020 & 2033
- Table 28: Italy Pure Gas Industry Revenue (billion) Forecast, by Application 2020 & 2033
- Table 29: France Pure Gas Industry Revenue (billion) Forecast, by Application 2020 & 2033
- Table 30: Rest of Europe Pure Gas Industry Revenue (billion) Forecast, by Application 2020 & 2033
- Table 31: Global Pure Gas Industry Revenue billion Forecast, by Product Type 2020 & 2033
- Table 32: Global Pure Gas Industry Revenue billion Forecast, by Application 2020 & 2033
- Table 33: Global Pure Gas Industry Revenue billion Forecast, by End-user Industry 2020 & 2033
- Table 34: Global Pure Gas Industry Revenue billion Forecast, by Country 2020 & 2033
- Table 35: Brazil Pure Gas Industry Revenue (billion) Forecast, by Application 2020 & 2033
- Table 36: Argentina Pure Gas Industry Revenue (billion) Forecast, by Application 2020 & 2033
- Table 37: Rest of South America Pure Gas Industry Revenue (billion) Forecast, by Application 2020 & 2033
- Table 38: Global Pure Gas Industry Revenue billion Forecast, by Product Type 2020 & 2033
- Table 39: Global Pure Gas Industry Revenue billion Forecast, by Application 2020 & 2033
- Table 40: Global Pure Gas Industry Revenue billion Forecast, by End-user Industry 2020 & 2033
- Table 41: Global Pure Gas Industry Revenue billion Forecast, by Country 2020 & 2033
- Table 42: Saudi Arabia Pure Gas Industry Revenue (billion) Forecast, by Application 2020 & 2033
- Table 43: South Africa Pure Gas Industry Revenue (billion) Forecast, by Application 2020 & 2033
- Table 44: Rest of Middle East and Africa Pure Gas Industry Revenue (billion) Forecast, by Application 2020 & 2033
Frequently Asked Questions
1. What is the projected Compound Annual Growth Rate (CAGR) of the Pure Gas Industry?
The projected CAGR is approximately 4.4%.
2. Which companies are prominent players in the Pure Gas Industry?
Key companies in the market include Air Products and Chemicals Inc, Advanced Specialty Gases, Linde plc*List Not Exhaustive, OSAKA GAS LIQUID Co Ltd, Matheson Tri-Gas Inc, Iwatani Corporation, American Welding & Gas, Messer Group, Air Liquide, Airgas Inc.
3. What are the main segments of the Pure Gas Industry?
The market segments include Product Type, Application, End-user Industry.
4. Can you provide details about the market size?
The market size is estimated to be USD 119.11 billion as of 2022.
5. What are some drivers contributing to market growth?
; Increasing Demand from Electronics Industry; Rising Demand for Solar PV Production.
6. What are the notable trends driving market growth?
Noble Gas Product Type to Dominate the Market.
7. Are there any restraints impacting market growth?
; High Cost of Indium Tin Oxide; Other Restraints.
8. Can you provide examples of recent developments in the market?
N/A
9. What pricing options are available for accessing the report?
Pricing options include single-user, multi-user, and enterprise licenses priced at USD 4750, USD 5250, and USD 8750 respectively.
10. Is the market size provided in terms of value or volume?
The market size is provided in terms of value, measured in billion.
11. Are there any specific market keywords associated with the report?
Yes, the market keyword associated with the report is "Pure Gas Industry," which aids in identifying and referencing the specific market segment covered.
12. How do I determine which pricing option suits my needs best?
The pricing options vary based on user requirements and access needs. Individual users may opt for single-user licenses, while businesses requiring broader access may choose multi-user or enterprise licenses for cost-effective access to the report.
13. Are there any additional resources or data provided in the Pure Gas Industry report?
While the report offers comprehensive insights, it's advisable to review the specific contents or supplementary materials provided to ascertain if additional resources or data are available.
14. How can I stay updated on further developments or reports in the Pure Gas Industry?
To stay informed about further developments, trends, and reports in the Pure Gas Industry, consider subscribing to industry newsletters, following relevant companies and organizations, or regularly checking reputable industry news sources and publications.
Methodology
Step 1 - Identification of Relevant Samples Size from Population Database


Step 2 - Approaches for Defining Global Market Size (Value, Volume* & Price*)

Note*: In applicable scenarios
Step 3 - Data Sources
Primary Research
- Web Analytics
- Survey Reports
- Research Institute
- Latest Research Reports
- Opinion Leaders
Secondary Research
- Annual Reports
- White Paper
- Latest Press Release
- Industry Association
- Paid Database
- Investor Presentations

Step 4 - Data Triangulation
Involves using different sources of information in order to increase the validity of a study
These sources are likely to be stakeholders in a program - participants, other researchers, program staff, other community members, and so on.
Then we put all data in single framework & apply various statistical tools to find out the dynamic on the market.
During the analysis stage, feedback from the stakeholder groups would be compared to determine areas of agreement as well as areas of divergence