

Key Insights
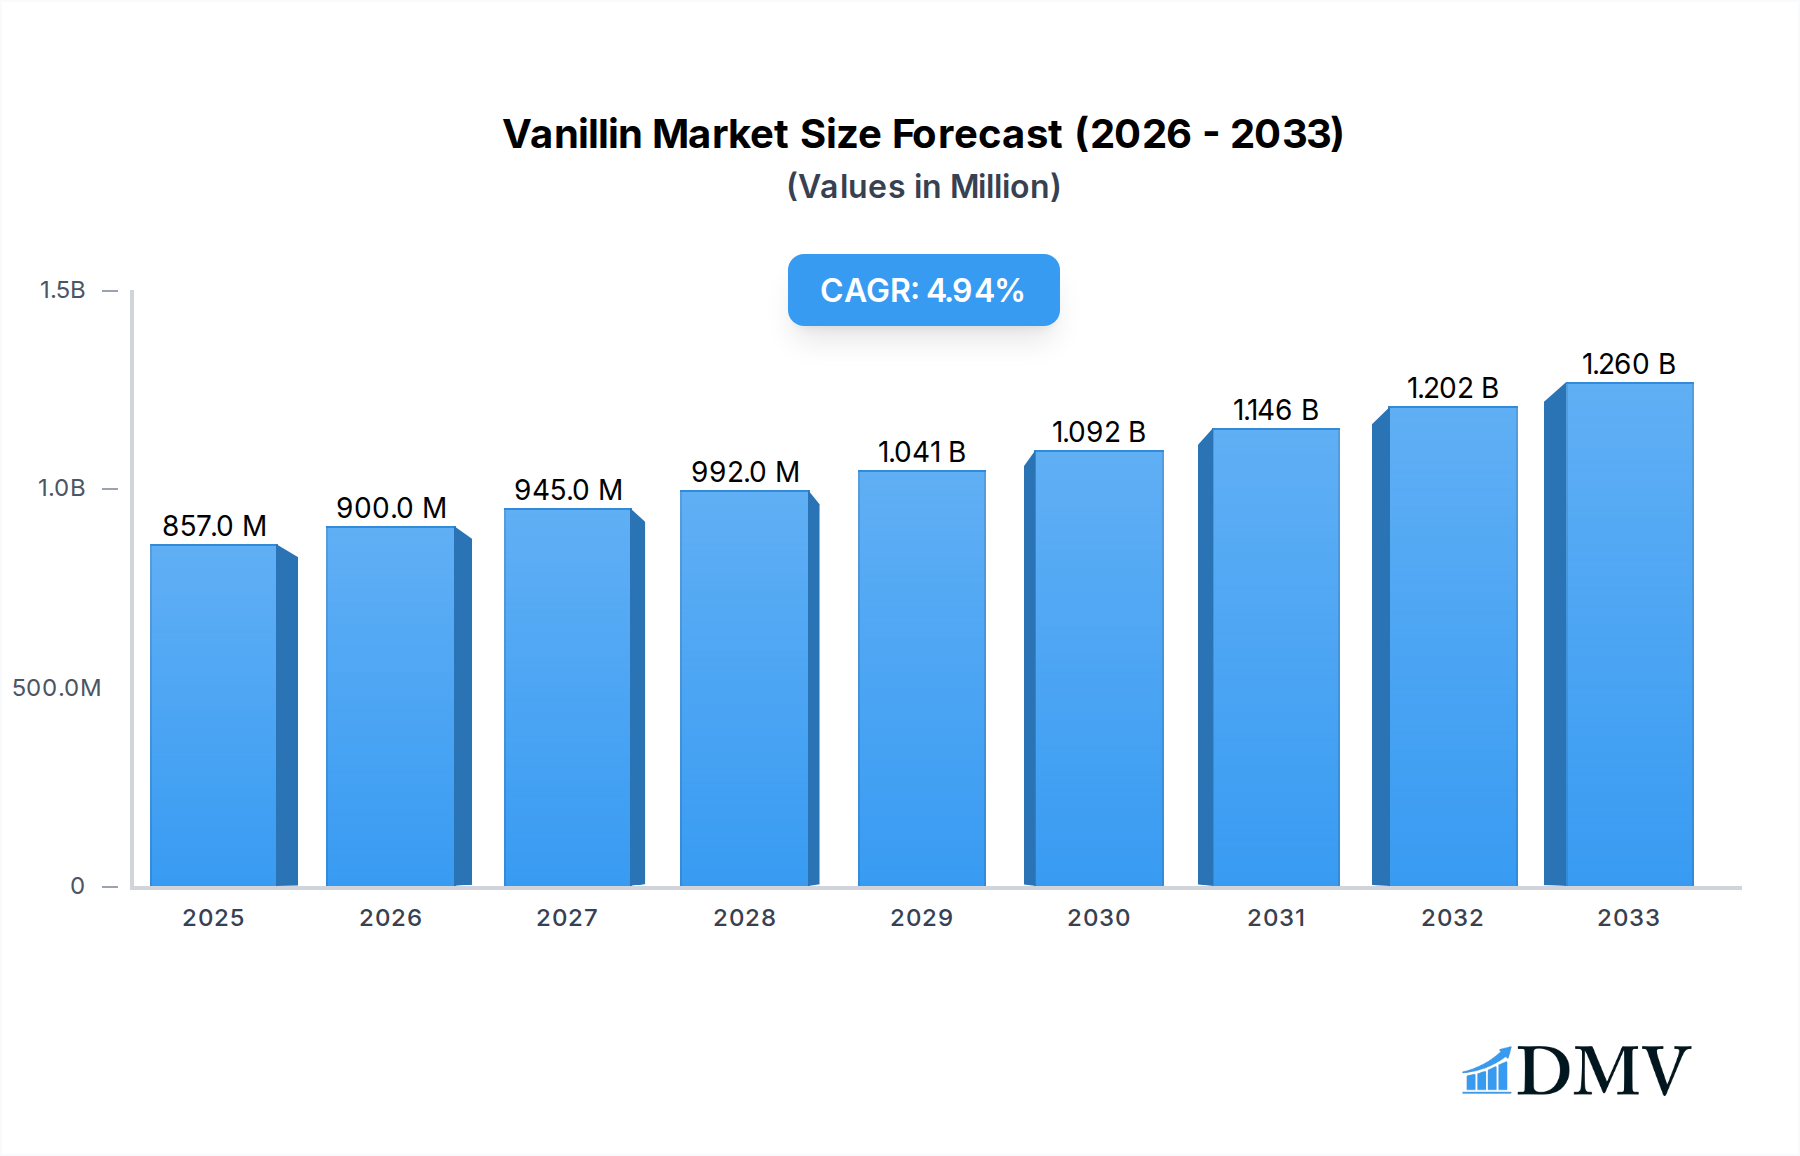
The global Vanillin market is poised for substantial growth, with an estimated market size of $857 million in 2025, driven by a robust Compound Annual Growth Rate (CAGR) of 4.9%. This upward trajectory is fueled by increasing demand across diverse applications, particularly within the food and beverage industry, where vanillin serves as a ubiquitous flavoring agent. The escalating consumption of processed foods, confectionery, and dairy products globally is a primary catalyst. Furthermore, the daily chemical industry, encompassing personal care products and cosmetics, is also a significant contributor to market expansion due to vanillin's fragrant properties. The pharmaceutical sector also presents growing opportunities, with vanillin finding applications in masking unpleasant tastes and as a precursor in certain medicinal compounds. Emerging economies, with their burgeoning middle class and changing dietary habits, are expected to be key growth engines.

Vanillin Market Size (In Million)
The market dynamics are further shaped by key trends such as the growing preference for natural and clean-label ingredients, which is spurring innovation in vanillin production methods, including bio-based routes. While synthetic vanillin remains dominant due to cost-effectiveness, the demand for vanillin derived from sustainable sources is gaining traction. However, challenges such as price volatility of raw materials and stringent regulatory frameworks in certain regions could present some restraints. Nevertheless, advancements in production technologies, coupled with strategic expansions by leading companies like Solvay, Borregaard, and Symrise, are expected to mitigate these challenges and ensure sustained market expansion throughout the forecast period. The competitive landscape is characterized by a mix of established global players and emerging regional manufacturers, all vying for market share through product innovation and strategic partnerships.
Vanillin Company Market Share
Vanillin Market Insights: A Comprehensive Report 2019-2033
This in-depth report delves into the dynamic vanillin market, offering critical insights into its composition, evolution, and future trajectory. Covering the study period of 2019–2033, with a base year of 2025 and a forecast period of 2025–2033, this analysis provides stakeholders with a strategic roadmap. We meticulously examine key segments, leading players, product innovations, growth drivers, and prevailing challenges, all optimized for maximum search visibility with high-ranking keywords like "vanillin market," "ethyl vanillin," "food industry," and "daily chemical industry."
Vanillin Market Composition & Trends
The vanillin market exhibits a moderate concentration, with key players such as Solvay, Borregaard, Wanglong Tech, Jiaxing Zhonghua Chemical, Liaoning Shixing, Shanghai Xinhua Perfume, Thrive Chemicals, Brother, EVOLVA, Kunshan Asia Aroma Corp, Lesaffre, Fujian Zhiyuan Biochemical, and Symrise holding significant shares. Innovation catalysts are primarily driven by advancements in synthesis methods and the growing demand for natural vanillin alternatives, a trend that is reshaping market dynamics. The regulatory landscape remains a crucial factor, with varying standards across regions influencing product development and market access. Substitute products, such as artificial sweeteners and other flavor enhancers, present a competitive challenge, yet the unique sensory profile of vanillin continues to secure its dominance. End-user profiles reveal a strong reliance on the Food Industry and the Daily Chemical Industry, with emerging applications in the Medicine sector also contributing to market expansion. Merger and acquisition (M&A) activities, valued at approximately 150 million, are strategically employed by leading companies to consolidate market presence, acquire novel technologies, and expand their product portfolios. The market share distribution for synthetic vanillin is estimated at over 900 million, while natural vanillin, though a smaller segment, is experiencing robust growth driven by consumer preference for natural ingredients.
Vanillin Industry Evolution
The vanillin industry has witnessed remarkable evolution throughout the historical period of 2019–2024 and is projected to continue its ascent through the forecast period of 2025–2033. Market growth trajectories have been significantly influenced by macroeconomic factors and evolving consumer preferences for natural and sustainable ingredients. The global vanillin market size, estimated to reach 3,500 million by 2025, is poised for substantial expansion, driven by a compound annual growth rate (CAGR) of approximately 5.5% during the forecast period. Technological advancements have played a pivotal role, with innovations in bioconversion and fermentation processes leading to more sustainable and cost-effective production of vanillin. These advancements have not only improved efficiency but also opened avenues for the production of high-purity vanillin for specialized applications. Shifting consumer demands, particularly the growing preference for ethically sourced and naturally derived flavors, have propelled the demand for natural vanillin, albeit at a premium price point. The food industry remains the largest consumer of vanillin, with applications ranging from baked goods and confectionery to beverages and dairy products. The increasing global population and rising disposable incomes in emerging economies further bolster this demand. The daily chemical industry, encompassing personal care products, fragrances, and household cleaners, also represents a significant and growing segment for vanillin consumption due to its pleasant aroma. Furthermore, the pharmaceutical sector is increasingly exploring vanillin's potential as an antioxidant and for its role in drug delivery systems, indicating a diversification of its application base. The market has also seen a steady increase in production capacity, with investments in new manufacturing facilities and the expansion of existing ones, particularly in Asia. For instance, production capacity has increased by an estimated 15% between 2020 and 2024, responding to the escalating global demand. The average price of synthetic vanillin has remained relatively stable, hovering around $15 per kilogram, while natural vanillin commands a significantly higher price, reflecting its production complexities and consumer appeal. The adoption of green chemistry principles in vanillin synthesis is also gaining traction, aligning with the industry's broader sustainability goals.
Leading Regions, Countries, or Segments in Vanillin
The vanillin market is led by the Food Industry segment, which accounts for a dominant share of approximately 75% of the global market. This supremacy is driven by the ubiquitous use of vanillin as a primary flavoring agent in a vast array of food and beverage products, including confectionery, baked goods, dairy products, and beverages. Key drivers for its dominance in this segment include consistent consumer demand, its ability to enhance taste profiles, and its cost-effectiveness compared to natural vanilla extract. The Daily Chemical Industry emerges as the second-largest segment, capturing an estimated 20% of the market share. Within this sector, vanillin's pleasant aroma makes it a sought-after ingredient in perfumes, colognes, soaps, lotions, and household cleaning products. The growing global demand for personal care products, particularly in emerging economies, is a significant growth catalyst for vanillin in this segment. Investment trends in the food and beverage sector, coupled with increasing consumer spending on premium personal care items, are directly translating into higher vanillin consumption. Regulatory support for food-grade ingredients and stringent quality control measures in the Daily Chemical Industry further solidify vanillin's position. The Medicine segment, though smaller at approximately 3%, is demonstrating promising growth potential. Vanillin's antioxidant and anti-inflammatory properties are being explored for various pharmaceutical applications, including its use as an excipient or active ingredient in certain formulations. Emerging opportunities in nutraceuticals and health supplements are also contributing to the expansion of this segment. The "Others" segment, encompassing industrial applications and research purposes, makes up the remaining 2%.
In terms of regional dominance, Asia-Pacific is the leading region, driven by robust manufacturing capabilities and a rapidly growing consumer base in countries like China and India. This region accounts for an estimated 35% of the global vanillin market. North America and Europe follow, with significant contributions from the established food and beverage sectors and a strong emphasis on premium and natural ingredients. The Type: Vanillin is the primary product category, holding over 95% of the market share, due to its widespread applications. Ethyl Vanillin, a synthetic compound with a stronger vanilla aroma, commands the remaining 5% of the market, primarily utilized in specific applications where a more intense vanilla flavor is desired. Investment trends in food processing and chemical manufacturing within Asia-Pacific are substantial, estimated to be in the billions of dollars annually, fostering continued market expansion.
Vanillin Product Innovations
Product innovation in the vanillin market is increasingly focused on enhancing sustainability and catering to the growing demand for natural ingredients. Companies are investing in advanced biotechnological processes, such as precision fermentation and enzymatic synthesis, to produce high-purity vanillin with a reduced environmental footprint. For instance, Evolva's development of a bio-based vanillin offers a compelling sustainable alternative with a significantly lower carbon footprint compared to traditional petrochemical-based synthesis. These innovations not only address environmental concerns but also provide unique selling propositions for manufacturers seeking to appeal to eco-conscious consumers. Performance metrics are being refined to ensure consistent flavor profiles and enhanced stability in various end-use applications, from baked goods to complex cosmetic formulations.
Propelling Factors for Vanillin Growth
Several key factors are propelling the growth of the vanillin market. Technological advancements in bio-fermentation and enzyme-catalyzed synthesis are leading to more sustainable and cost-effective production methods. The burgeoning global food and beverage industry, driven by population growth and rising disposable incomes, creates a perpetual demand for flavoring agents like vanillin. Growing consumer preference for natural and clean-label products is stimulating the demand for natural vanillin and its derivatives, despite a higher price point. Furthermore, the expanding applications of vanillin in the pharmaceutical and cosmetic industries, owing to its aroma and potential therapeutic properties, are contributing significantly to market expansion.
Obstacles in the Vanillin Market
Despite its robust growth, the vanillin market faces several obstacles. Fluctuations in the prices of raw materials, particularly for petrochemical-based synthetic vanillin, can impact production costs and profit margins. Stringent regulatory requirements and differing standards across various regions can pose challenges for market entry and product compliance. The presence of substitute flavoring agents and the ongoing development of novel aroma compounds present competitive pressures. Supply chain disruptions, as witnessed during recent global events, can also affect the availability and pricing of vanillin. The market for natural vanillin, while growing, is constrained by limited supply and high production costs, which can be a barrier for mass-market adoption.
Future Opportunities in Vanillin
The vanillin market is ripe with future opportunities. The increasing demand for natural and sustainable ingredients presents a significant avenue for growth in the bio-based vanillin segment. Emerging markets in Asia and Africa, with their rapidly expanding food and beverage sectors, offer substantial untapped potential. Innovations in flavor encapsulation technologies can lead to enhanced product stability and controlled release, opening new application possibilities. Furthermore, ongoing research into the pharmacological benefits of vanillin could unlock new therapeutic applications in the pharmaceutical and nutraceutical industries. The development of novel vanillin derivatives with unique sensory profiles also holds promise for niche markets.
Major Players in the Vanillin Ecosystem
- Solvay
- Borregaard
- Wanglong Tech
- Jiaxing Zhonghua Chemical
- Liaoning Shixing
- Shanghai Xinhua Perfume
- Thrive Chemicals
- Brother
- EVOLVA
- Kunshan Asia Aroma Corp
- Lesaffre
- Fujian Zhiyuan Biochemical
- Symrise
Key Developments in Vanillin Industry
- 2023/08: Solvay launches a new range of bio-based vanillin ingredients, emphasizing sustainability.
- 2023/05: Borregaard invests in expanding its lignin-based vanillin production capacity.
- 2022/11: EVOLVA announces successful scale-up of its fermentation-based vanillin production.
- 2022/07: Wanglong Tech announces strategic partnership to enhance its global distribution network.
- 2021/12: Symrise acquires a significant stake in a specialized flavor ingredient company, enhancing its portfolio.
Strategic Vanillin Market Forecast
The strategic vanillin market forecast indicates continued robust growth, primarily fueled by sustained demand from the food and beverage sector and the increasing adoption of natural and sustainable ingredients. Technological advancements in bio-production are expected to drive down costs and improve accessibility, further expanding market reach. Emerging applications in the pharmaceutical and cosmetic industries, coupled with the growing preference for vanilla-flavored products globally, will act as significant growth catalysts. Investments in research and development to create novel vanillin derivatives and enhance production efficiency will shape the competitive landscape and unlock new market opportunities, ensuring a promising future for the vanillin industry.
Vanillin Segmentation
-
1. Application
- 1.1. Food Industry
- 1.2. Daily Chemical Industry
- 1.3. Medicine
- 1.4. Others
-
2. Type
- 2.1. Vanillin
- 2.2. Ethyl Vanillin
Vanillin Segmentation By Geography
-
1. North America
- 1.1. United States
- 1.2. Canada
- 1.3. Mexico
-
2. South America
- 2.1. Brazil
- 2.2. Argentina
- 2.3. Rest of South America
-
3. Europe
- 3.1. United Kingdom
- 3.2. Germany
- 3.3. France
- 3.4. Italy
- 3.5. Spain
- 3.6. Russia
- 3.7. Benelux
- 3.8. Nordics
- 3.9. Rest of Europe
-
4. Middle East & Africa
- 4.1. Turkey
- 4.2. Israel
- 4.3. GCC
- 4.4. North Africa
- 4.5. South Africa
- 4.6. Rest of Middle East & Africa
-
5. Asia Pacific
- 5.1. China
- 5.2. India
- 5.3. Japan
- 5.4. South Korea
- 5.5. ASEAN
- 5.6. Oceania
- 5.7. Rest of Asia Pacific
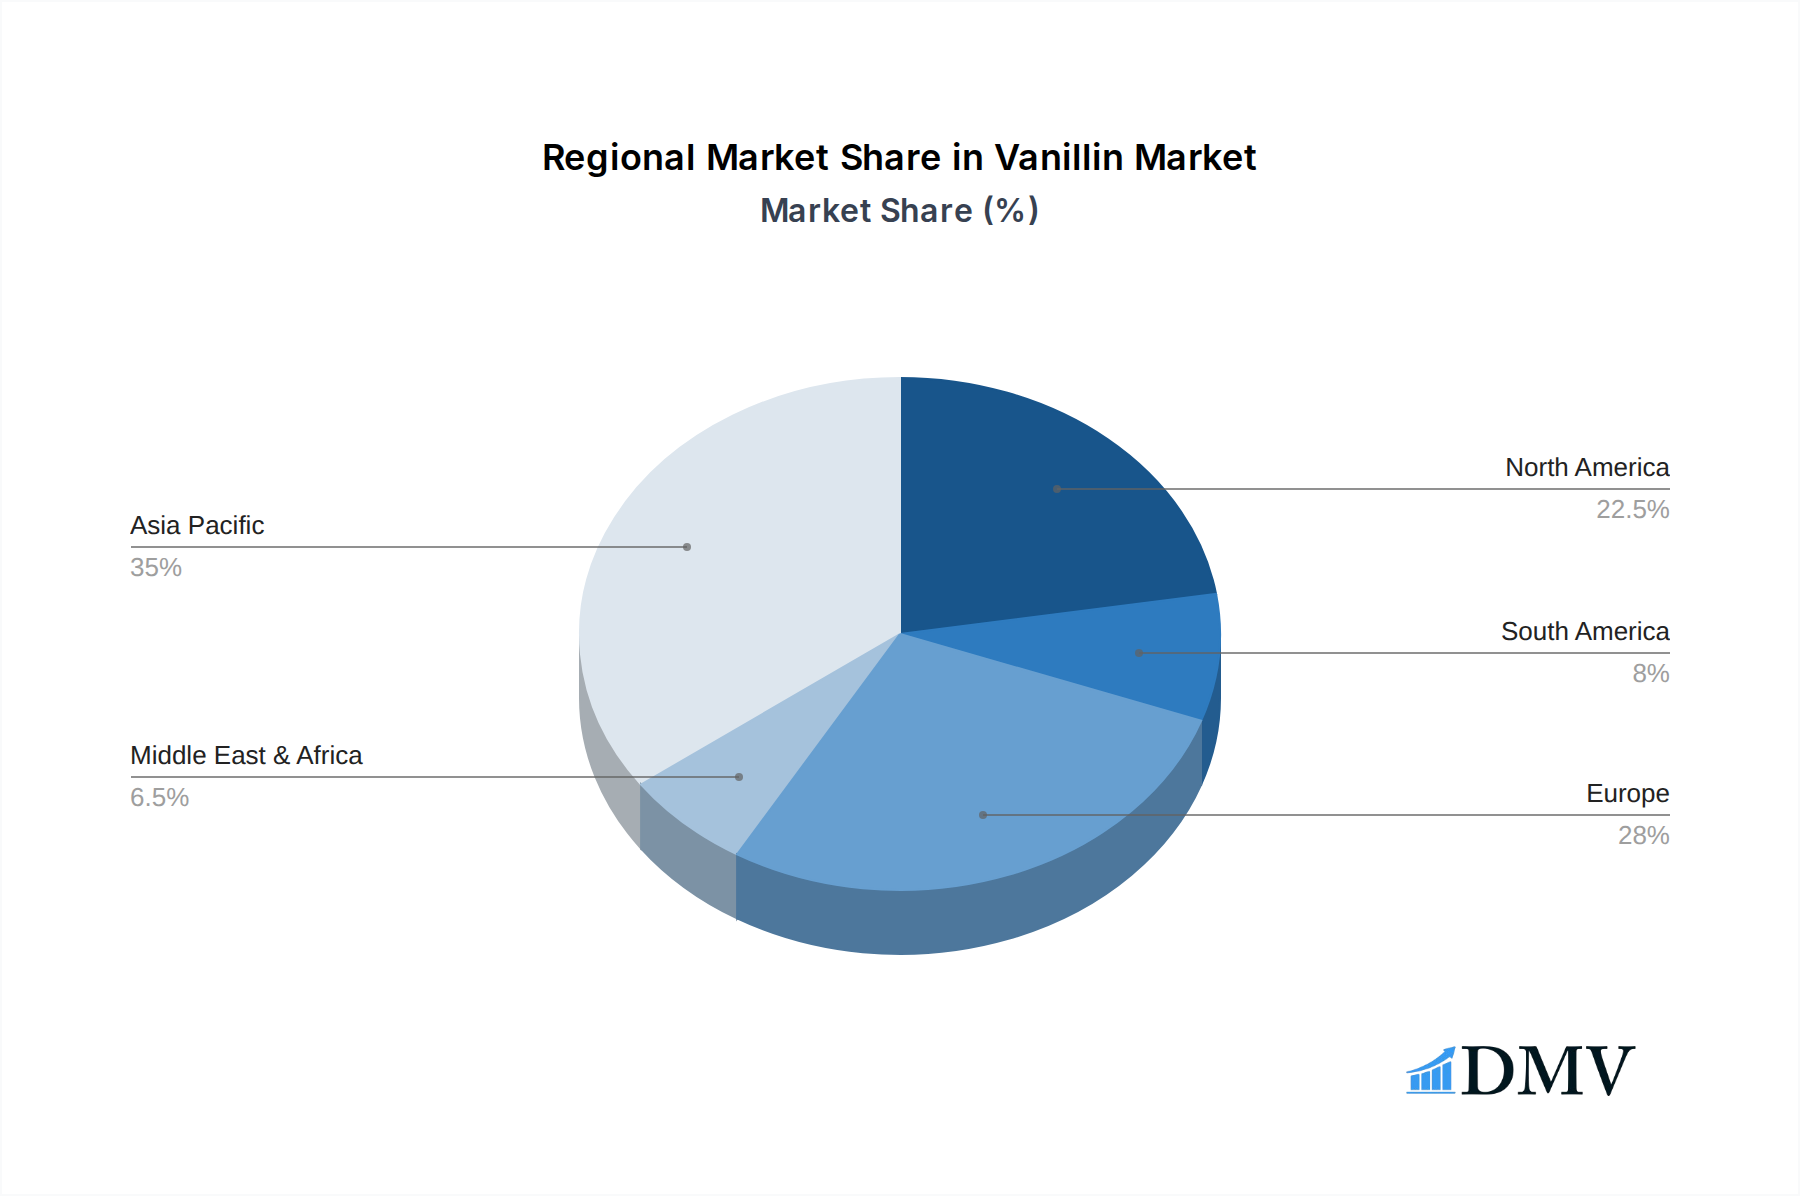
Vanillin Regional Market Share
Geographic Coverage of Vanillin
Vanillin REPORT HIGHLIGHTS
| Aspects | Details |
|---|---|
| Study Period | 2020-2034 |
| Base Year | 2025 |
| Estimated Year | 2026 |
| Forecast Period | 2026-2034 |
| Historical Period | 2020-2025 |
| Growth Rate | CAGR of 4.9% from 2020-2034 |
| Segmentation |
|
Table of Contents
- 1. Introduction
- 1.1. Research Scope
- 1.2. Market Segmentation
- 1.3. Research Objective
- 1.4. Definitions and Assumptions
- 2. Executive Summary
- 2.1. Market Snapshot
- 3. Market Dynamics
- 3.1. Market Drivers
- 3.2. Market Restrains
- 3.3. Market Trends
- 3.4. Market Opportunities
- 4. Market Factor Analysis
- 4.1. Porters Five Forces
- 4.1.1. Bargaining Power of Suppliers
- 4.1.2. Bargaining Power of Buyers
- 4.1.3. Threat of New Entrants
- 4.1.4. Threat of Substitutes
- 4.1.5. Competitive Rivalry
- 4.2. PESTEL analysis
- 4.3. BCG Analysis
- 4.3.1. Stars (High Growth, High Market Share)
- 4.3.2. Cash Cows (Low Growth, High Market Share)
- 4.3.3. Question Mark (High Growth, Low Market Share)
- 4.3.4. Dogs (Low Growth, Low Market Share)
- 4.4. Ansoff Matrix Analysis
- 4.5. Supply Chain Analysis
- 4.6. Regulatory Landscape
- 4.7. Current Market Potential and Opportunity Assessment (TAM–SAM–SOM Framework)
- 4.8. DMV Analyst Note
- 4.1. Porters Five Forces
- 5. Market Analysis, Insights and Forecast 2021-2033
- 5.1. Market Analysis, Insights and Forecast - by Application
- 5.1.1. Food Industry
- 5.1.2. Daily Chemical Industry
- 5.1.3. Medicine
- 5.1.4. Others
- 5.2. Market Analysis, Insights and Forecast - by Type
- 5.2.1. Vanillin
- 5.2.2. Ethyl Vanillin
- 5.3. Market Analysis, Insights and Forecast - by Region
- 5.3.1. North America
- 5.3.2. South America
- 5.3.3. Europe
- 5.3.4. Middle East & Africa
- 5.3.5. Asia Pacific
- 5.1. Market Analysis, Insights and Forecast - by Application
- 6. Global Vanillin Analysis, Insights and Forecast, 2021-2033
- 6.1. Market Analysis, Insights and Forecast - by Application
- 6.1.1. Food Industry
- 6.1.2. Daily Chemical Industry
- 6.1.3. Medicine
- 6.1.4. Others
- 6.2. Market Analysis, Insights and Forecast - by Type
- 6.2.1. Vanillin
- 6.2.2. Ethyl Vanillin
- 6.1. Market Analysis, Insights and Forecast - by Application
- 7. North America Vanillin Analysis, Insights and Forecast, 2020-2032
- 7.1. Market Analysis, Insights and Forecast - by Application
- 7.1.1. Food Industry
- 7.1.2. Daily Chemical Industry
- 7.1.3. Medicine
- 7.1.4. Others
- 7.2. Market Analysis, Insights and Forecast - by Type
- 7.2.1. Vanillin
- 7.2.2. Ethyl Vanillin
- 7.1. Market Analysis, Insights and Forecast - by Application
- 8. South America Vanillin Analysis, Insights and Forecast, 2020-2032
- 8.1. Market Analysis, Insights and Forecast - by Application
- 8.1.1. Food Industry
- 8.1.2. Daily Chemical Industry
- 8.1.3. Medicine
- 8.1.4. Others
- 8.2. Market Analysis, Insights and Forecast - by Type
- 8.2.1. Vanillin
- 8.2.2. Ethyl Vanillin
- 8.1. Market Analysis, Insights and Forecast - by Application
- 9. Europe Vanillin Analysis, Insights and Forecast, 2020-2032
- 9.1. Market Analysis, Insights and Forecast - by Application
- 9.1.1. Food Industry
- 9.1.2. Daily Chemical Industry
- 9.1.3. Medicine
- 9.1.4. Others
- 9.2. Market Analysis, Insights and Forecast - by Type
- 9.2.1. Vanillin
- 9.2.2. Ethyl Vanillin
- 9.1. Market Analysis, Insights and Forecast - by Application
- 10. Middle East & Africa Vanillin Analysis, Insights and Forecast, 2020-2032
- 10.1. Market Analysis, Insights and Forecast - by Application
- 10.1.1. Food Industry
- 10.1.2. Daily Chemical Industry
- 10.1.3. Medicine
- 10.1.4. Others
- 10.2. Market Analysis, Insights and Forecast - by Type
- 10.2.1. Vanillin
- 10.2.2. Ethyl Vanillin
- 10.1. Market Analysis, Insights and Forecast - by Application
- 11. Asia Pacific Vanillin Analysis, Insights and Forecast, 2020-2032
- 11.1. Market Analysis, Insights and Forecast - by Application
- 11.1.1. Food Industry
- 11.1.2. Daily Chemical Industry
- 11.1.3. Medicine
- 11.1.4. Others
- 11.2. Market Analysis, Insights and Forecast - by Type
- 11.2.1. Vanillin
- 11.2.2. Ethyl Vanillin
- 11.1. Market Analysis, Insights and Forecast - by Application
- 12. Competitive Analysis
- 12.1. Company Profiles
- 12.1.1 Solvay
- 12.1.1.1. Company Overview
- 12.1.1.2. Products
- 12.1.1.3. Company Financials
- 12.1.1.4. SWOT Analysis
- 12.1.2 Borregaard
- 12.1.2.1. Company Overview
- 12.1.2.2. Products
- 12.1.2.3. Company Financials
- 12.1.2.4. SWOT Analysis
- 12.1.3 Wanglong Tech
- 12.1.3.1. Company Overview
- 12.1.3.2. Products
- 12.1.3.3. Company Financials
- 12.1.3.4. SWOT Analysis
- 12.1.4 Jiaxing Zhonghua Chemical
- 12.1.4.1. Company Overview
- 12.1.4.2. Products
- 12.1.4.3. Company Financials
- 12.1.4.4. SWOT Analysis
- 12.1.5 Liaoning Shixing
- 12.1.5.1. Company Overview
- 12.1.5.2. Products
- 12.1.5.3. Company Financials
- 12.1.5.4. SWOT Analysis
- 12.1.6 Shanghai Xinhua Perfume
- 12.1.6.1. Company Overview
- 12.1.6.2. Products
- 12.1.6.3. Company Financials
- 12.1.6.4. SWOT Analysis
- 12.1.7 Thrive Chemicals
- 12.1.7.1. Company Overview
- 12.1.7.2. Products
- 12.1.7.3. Company Financials
- 12.1.7.4. SWOT Analysis
- 12.1.8 Brother
- 12.1.8.1. Company Overview
- 12.1.8.2. Products
- 12.1.8.3. Company Financials
- 12.1.8.4. SWOT Analysis
- 12.1.9 EVOLVA
- 12.1.9.1. Company Overview
- 12.1.9.2. Products
- 12.1.9.3. Company Financials
- 12.1.9.4. SWOT Analysis
- 12.1.10 Kunshan Asia Aroma Corp
- 12.1.10.1. Company Overview
- 12.1.10.2. Products
- 12.1.10.3. Company Financials
- 12.1.10.4. SWOT Analysis
- 12.1.11 Lesaffre
- 12.1.11.1. Company Overview
- 12.1.11.2. Products
- 12.1.11.3. Company Financials
- 12.1.11.4. SWOT Analysis
- 12.1.12 Fujian Zhiyuan Biochemical
- 12.1.12.1. Company Overview
- 12.1.12.2. Products
- 12.1.12.3. Company Financials
- 12.1.12.4. SWOT Analysis
- 12.1.13 Symrise
- 12.1.13.1. Company Overview
- 12.1.13.2. Products
- 12.1.13.3. Company Financials
- 12.1.13.4. SWOT Analysis
- 12.1.1 Solvay
- 12.2. Market Entropy
- 12.2.1 Company's Key Areas Served
- 12.2.2 Recent Developments
- 12.3. Company Market Share Analysis 2025
- 12.3.1 Top 5 Companies Market Share Analysis
- 12.3.2 Top 3 Companies Market Share Analysis
- 12.4. List of Potential Customers
- 13. Research Methodology
List of Figures
- Figure 1: Global Vanillin Revenue Breakdown (million, %) by Region 2025 & 2033
- Figure 2: North America Vanillin Revenue (million), by Application 2025 & 2033
- Figure 3: North America Vanillin Revenue Share (%), by Application 2025 & 2033
- Figure 4: North America Vanillin Revenue (million), by Type 2025 & 2033
- Figure 5: North America Vanillin Revenue Share (%), by Type 2025 & 2033
- Figure 6: North America Vanillin Revenue (million), by Country 2025 & 2033
- Figure 7: North America Vanillin Revenue Share (%), by Country 2025 & 2033
- Figure 8: South America Vanillin Revenue (million), by Application 2025 & 2033
- Figure 9: South America Vanillin Revenue Share (%), by Application 2025 & 2033
- Figure 10: South America Vanillin Revenue (million), by Type 2025 & 2033
- Figure 11: South America Vanillin Revenue Share (%), by Type 2025 & 2033
- Figure 12: South America Vanillin Revenue (million), by Country 2025 & 2033
- Figure 13: South America Vanillin Revenue Share (%), by Country 2025 & 2033
- Figure 14: Europe Vanillin Revenue (million), by Application 2025 & 2033
- Figure 15: Europe Vanillin Revenue Share (%), by Application 2025 & 2033
- Figure 16: Europe Vanillin Revenue (million), by Type 2025 & 2033
- Figure 17: Europe Vanillin Revenue Share (%), by Type 2025 & 2033
- Figure 18: Europe Vanillin Revenue (million), by Country 2025 & 2033
- Figure 19: Europe Vanillin Revenue Share (%), by Country 2025 & 2033
- Figure 20: Middle East & Africa Vanillin Revenue (million), by Application 2025 & 2033
- Figure 21: Middle East & Africa Vanillin Revenue Share (%), by Application 2025 & 2033
- Figure 22: Middle East & Africa Vanillin Revenue (million), by Type 2025 & 2033
- Figure 23: Middle East & Africa Vanillin Revenue Share (%), by Type 2025 & 2033
- Figure 24: Middle East & Africa Vanillin Revenue (million), by Country 2025 & 2033
- Figure 25: Middle East & Africa Vanillin Revenue Share (%), by Country 2025 & 2033
- Figure 26: Asia Pacific Vanillin Revenue (million), by Application 2025 & 2033
- Figure 27: Asia Pacific Vanillin Revenue Share (%), by Application 2025 & 2033
- Figure 28: Asia Pacific Vanillin Revenue (million), by Type 2025 & 2033
- Figure 29: Asia Pacific Vanillin Revenue Share (%), by Type 2025 & 2033
- Figure 30: Asia Pacific Vanillin Revenue (million), by Country 2025 & 2033
- Figure 31: Asia Pacific Vanillin Revenue Share (%), by Country 2025 & 2033
List of Tables
- Table 1: Global Vanillin Revenue million Forecast, by Application 2020 & 2033
- Table 2: Global Vanillin Revenue million Forecast, by Type 2020 & 2033
- Table 3: Global Vanillin Revenue million Forecast, by Region 2020 & 2033
- Table 4: Global Vanillin Revenue million Forecast, by Application 2020 & 2033
- Table 5: Global Vanillin Revenue million Forecast, by Type 2020 & 2033
- Table 6: Global Vanillin Revenue million Forecast, by Country 2020 & 2033
- Table 7: United States Vanillin Revenue (million) Forecast, by Application 2020 & 2033
- Table 8: Canada Vanillin Revenue (million) Forecast, by Application 2020 & 2033
- Table 9: Mexico Vanillin Revenue (million) Forecast, by Application 2020 & 2033
- Table 10: Global Vanillin Revenue million Forecast, by Application 2020 & 2033
- Table 11: Global Vanillin Revenue million Forecast, by Type 2020 & 2033
- Table 12: Global Vanillin Revenue million Forecast, by Country 2020 & 2033
- Table 13: Brazil Vanillin Revenue (million) Forecast, by Application 2020 & 2033
- Table 14: Argentina Vanillin Revenue (million) Forecast, by Application 2020 & 2033
- Table 15: Rest of South America Vanillin Revenue (million) Forecast, by Application 2020 & 2033
- Table 16: Global Vanillin Revenue million Forecast, by Application 2020 & 2033
- Table 17: Global Vanillin Revenue million Forecast, by Type 2020 & 2033
- Table 18: Global Vanillin Revenue million Forecast, by Country 2020 & 2033
- Table 19: United Kingdom Vanillin Revenue (million) Forecast, by Application 2020 & 2033
- Table 20: Germany Vanillin Revenue (million) Forecast, by Application 2020 & 2033
- Table 21: France Vanillin Revenue (million) Forecast, by Application 2020 & 2033
- Table 22: Italy Vanillin Revenue (million) Forecast, by Application 2020 & 2033
- Table 23: Spain Vanillin Revenue (million) Forecast, by Application 2020 & 2033
- Table 24: Russia Vanillin Revenue (million) Forecast, by Application 2020 & 2033
- Table 25: Benelux Vanillin Revenue (million) Forecast, by Application 2020 & 2033
- Table 26: Nordics Vanillin Revenue (million) Forecast, by Application 2020 & 2033
- Table 27: Rest of Europe Vanillin Revenue (million) Forecast, by Application 2020 & 2033
- Table 28: Global Vanillin Revenue million Forecast, by Application 2020 & 2033
- Table 29: Global Vanillin Revenue million Forecast, by Type 2020 & 2033
- Table 30: Global Vanillin Revenue million Forecast, by Country 2020 & 2033
- Table 31: Turkey Vanillin Revenue (million) Forecast, by Application 2020 & 2033
- Table 32: Israel Vanillin Revenue (million) Forecast, by Application 2020 & 2033
- Table 33: GCC Vanillin Revenue (million) Forecast, by Application 2020 & 2033
- Table 34: North Africa Vanillin Revenue (million) Forecast, by Application 2020 & 2033
- Table 35: South Africa Vanillin Revenue (million) Forecast, by Application 2020 & 2033
- Table 36: Rest of Middle East & Africa Vanillin Revenue (million) Forecast, by Application 2020 & 2033
- Table 37: Global Vanillin Revenue million Forecast, by Application 2020 & 2033
- Table 38: Global Vanillin Revenue million Forecast, by Type 2020 & 2033
- Table 39: Global Vanillin Revenue million Forecast, by Country 2020 & 2033
- Table 40: China Vanillin Revenue (million) Forecast, by Application 2020 & 2033
- Table 41: India Vanillin Revenue (million) Forecast, by Application 2020 & 2033
- Table 42: Japan Vanillin Revenue (million) Forecast, by Application 2020 & 2033
- Table 43: South Korea Vanillin Revenue (million) Forecast, by Application 2020 & 2033
- Table 44: ASEAN Vanillin Revenue (million) Forecast, by Application 2020 & 2033
- Table 45: Oceania Vanillin Revenue (million) Forecast, by Application 2020 & 2033
- Table 46: Rest of Asia Pacific Vanillin Revenue (million) Forecast, by Application 2020 & 2033
Frequently Asked Questions
1. What is the projected Compound Annual Growth Rate (CAGR) of the Vanillin?
The projected CAGR is approximately 4.9%.
2. Which companies are prominent players in the Vanillin?
Key companies in the market include Solvay, Borregaard, Wanglong Tech, Jiaxing Zhonghua Chemical, Liaoning Shixing, Shanghai Xinhua Perfume, Thrive Chemicals, Brother, EVOLVA, Kunshan Asia Aroma Corp, Lesaffre, Fujian Zhiyuan Biochemical, Symrise.
3. What are the main segments of the Vanillin?
The market segments include Application, Type.
4. Can you provide details about the market size?
The market size is estimated to be USD 857 million as of 2022.
5. What are some drivers contributing to market growth?
N/A
6. What are the notable trends driving market growth?
N/A
7. Are there any restraints impacting market growth?
N/A
8. Can you provide examples of recent developments in the market?
N/A
9. What pricing options are available for accessing the report?
Pricing options include single-user, multi-user, and enterprise licenses priced at USD 5900.00, USD 8850.00, and USD 11800.00 respectively.
10. Is the market size provided in terms of value or volume?
The market size is provided in terms of value, measured in million.
11. Are there any specific market keywords associated with the report?
Yes, the market keyword associated with the report is "Vanillin," which aids in identifying and referencing the specific market segment covered.
12. How do I determine which pricing option suits my needs best?
The pricing options vary based on user requirements and access needs. Individual users may opt for single-user licenses, while businesses requiring broader access may choose multi-user or enterprise licenses for cost-effective access to the report.
13. Are there any additional resources or data provided in the Vanillin report?
While the report offers comprehensive insights, it's advisable to review the specific contents or supplementary materials provided to ascertain if additional resources or data are available.
14. How can I stay updated on further developments or reports in the Vanillin?
To stay informed about further developments, trends, and reports in the Vanillin, consider subscribing to industry newsletters, following relevant companies and organizations, or regularly checking reputable industry news sources and publications.
Methodology
Step 1 - Identification of Relevant Samples Size from Population Database


Step 2 - Approaches for Defining Global Market Size (Value, Volume* & Price*)

Note*: In applicable scenarios
Step 3 - Data Sources
Primary Research
- Web Analytics
- Survey Reports
- Research Institute
- Latest Research Reports
- Opinion Leaders
Secondary Research
- Annual Reports
- White Paper
- Latest Press Release
- Industry Association
- Paid Database
- Investor Presentations

Step 4 - Data Triangulation
Involves using different sources of information in order to increase the validity of a study
These sources are likely to be stakeholders in a program - participants, other researchers, program staff, other community members, and so on.
Then we put all data in single framework & apply various statistical tools to find out the dynamic on the market.
During the analysis stage, feedback from the stakeholder groups would be compared to determine areas of agreement as well as areas of divergence