

Key Insights
The USA onshore drilling fluid market is poised for significant expansion, driven by robust oil and gas exploration and production activities. The market is projected to achieve a Compound Annual Growth Rate (CAGR) of 7.5% between 2024 and 2033. This growth is supported by technological advancements enhancing drilling efficiency and sustainability, rising energy demand, and supportive government policies for domestic production. The shale revolution continues to be a key demand driver, necessitating substantial volumes of specialized fluids for horizontal drilling and hydraulic fracturing. However, market growth may be influenced by volatile energy prices, environmental regulations, and the adoption of alternative drilling technologies.
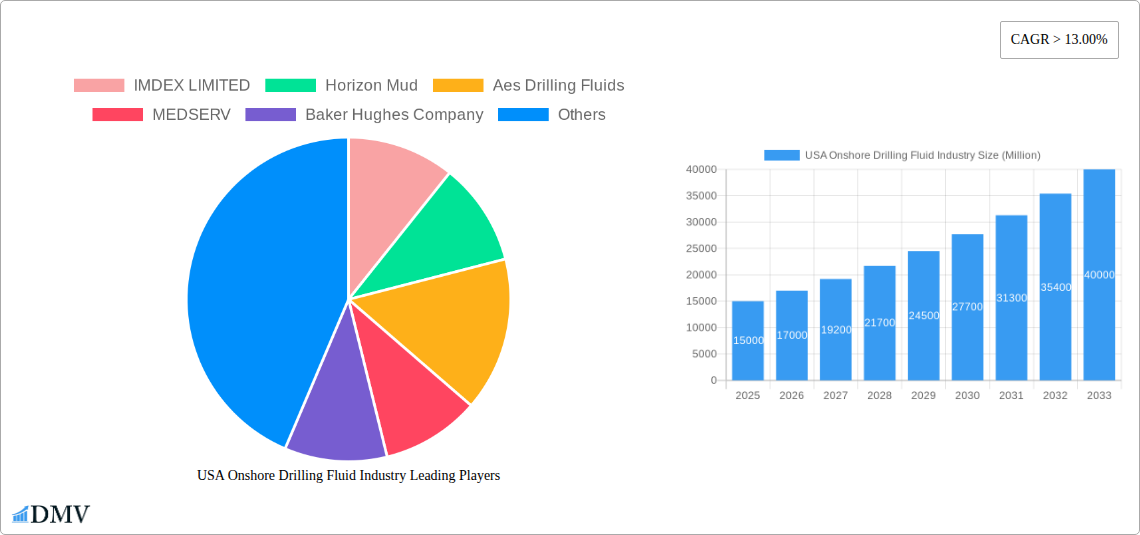
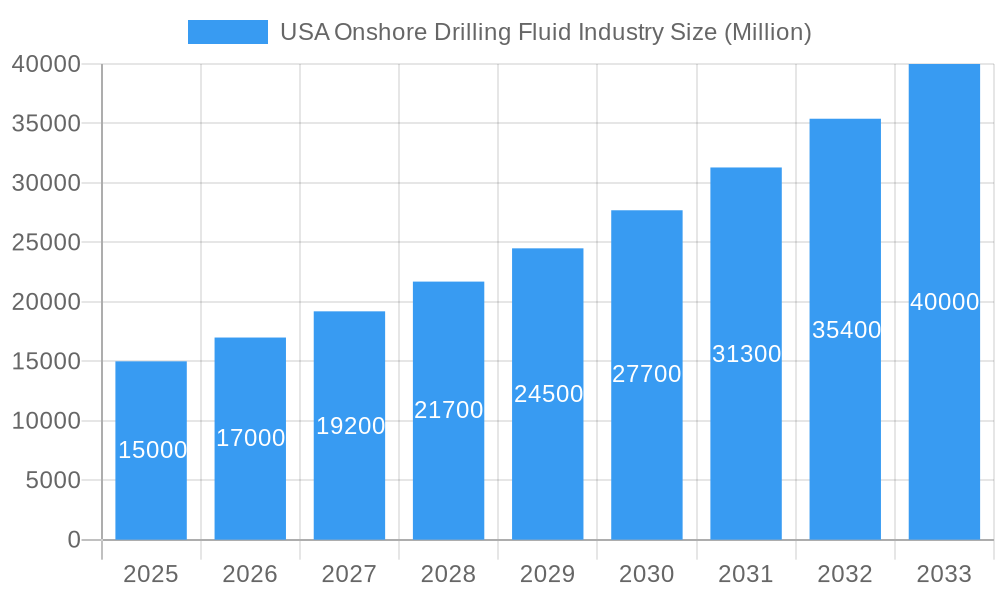
USA Onshore Drilling Fluid Industry Market Size (In Billion)
The market is segmented by fluid type (water-based, oil-based, synthetic-based), application (conventional drilling, unconventional drilling), and key regions such as Texas, Pennsylvania, and North Dakota. Leading companies including Baker Hughes, Schlumberger, and Halliburton are prominent, leveraging their technical expertise and extensive service networks. The competitive environment includes major corporations and specialized firms focusing on niche applications and eco-friendly solutions.
USA Onshore Drilling Fluid Industry Company Market Share
The forecast period (2024-2033) indicates continued market growth, contingent upon global energy demand and evolving regulations. The market size is expected to reach $2.7 billion by 2033, propelled by ongoing investments in onshore drilling projects. The competitive landscape features a blend of multinational corporations and agile specialized companies. Larger entities benefit from economies of scale and innovation, while smaller firms often lead in niche markets and sustainable fluid development. Future market dynamics will be shaped by the interplay of global energy needs, environmental regulations, and technological advancements promoting efficiency and sustainability. A critical trend is the increasing adoption of environmentally conscious drilling fluids in response to heightened environmental awareness and stricter waste disposal regulations, which will significantly influence future market development.
USA Onshore Drilling Fluid Industry: A Comprehensive Market Report (2019-2033)
This insightful report provides a detailed analysis of the USA onshore drilling fluid industry, offering a comprehensive overview of market trends, key players, and future growth prospects. Covering the period from 2019 to 2033, with 2025 as the base and estimated year, this report is essential for stakeholders seeking to understand and capitalize on opportunities within this dynamic sector. The market size is projected to reach xx Million by 2033.
USA Onshore Drilling Fluid Industry Market Composition & Trends
This section meticulously analyzes the competitive landscape of the USA onshore drilling fluid market. We delve into market concentration, assessing the market share distribution amongst key players like Baker Hughes Company, Schlumberger Limited, and Newpark Resources Inc., among others. The report quantifies market share percentages, revealing the dominance of major players and the presence of niche players. We also examine innovation catalysts, such as advancements in drilling technology and environmentally friendly fluid formulations. The regulatory landscape, encompassing environmental regulations and safety standards, is thoroughly explored, analyzing its influence on industry practices. Furthermore, the report examines substitute products and their potential impact on market growth. End-user profiles are detailed, outlining the varying needs and preferences of different segments of the oil and gas industry. Finally, the report investigates mergers and acquisitions (M&A) activities, analyzing deal values and their implications for market consolidation. Key M&A deals during the study period are listed and analyzed for their impact on market dynamics. The total value of M&A deals during 2019-2024 is estimated to be xx Million.
- Market Concentration: High, with top 5 players holding xx% market share in 2025.
- Innovation Catalysts: Development of environmentally friendly fluids, automation in fluid management.
- Regulatory Landscape: Stringent environmental regulations driving innovation and cost.
- Substitute Products: Limited viable substitutes, but pressure from bio-based fluids.
- End-User Profiles: Varying needs across different oil and gas exploration and production segments.
- M&A Activities: Consolidation expected to continue, with potential for larger deals in the forecast period.
USA Onshore Drilling Fluid Industry Industry Evolution
This section provides a detailed historical and projected analysis of the USA onshore drilling fluid industry's evolution. We trace the market's growth trajectory from 2019 to 2024, highlighting key periods of expansion and contraction linked to factors such as oil prices, technological advancements, and regulatory changes. The report presents data points on growth rates (CAGR) for the historical and forecast periods. Technological advancements, including the introduction of high-performance drilling fluids and automated fluid management systems, are meticulously analyzed, showcasing their impact on efficiency and cost reduction. Further, the report investigates shifting consumer demands, focusing on the growing preference for environmentally friendly and sustainable solutions within the industry.
- Market Growth Trajectory: Experienced fluctuations due to oil price volatility and regulatory changes; projected to grow at a CAGR of xx% from 2025 to 2033.
- Technological Advancements: Adoption of high-performance fluids increased by xx% from 2019 to 2024.
- Shifting Consumer Demands: Growing focus on environmentally friendly and sustainable solutions.
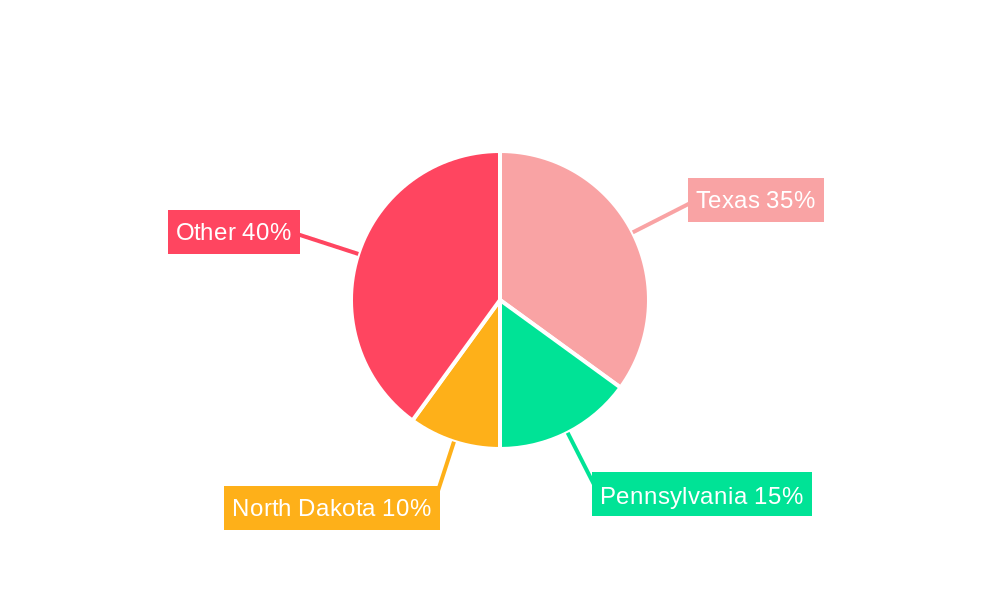
Leading Regions, Countries, or Segments in USA Onshore Drilling Fluid Industry
The report identifies the dominant regions and segments within the USA onshore drilling fluid market. The key drivers behind the dominance of these specific areas are carefully examined through detailed analysis.
- Dominant Region: Texas, followed by Permian Basin and Bakken Shale.
- Key Drivers:
- Texas: High concentration of oil and gas activities, established infrastructure.
- Permian Basin: Significant shale oil and gas production.
- Bakken Shale: Rapid growth in shale oil production.
- Dominant Segment: Water-based fluids, due to cost-effectiveness and environmental considerations.
USA Onshore Drilling Fluid Industry Product Innovations
This section explores recent product innovations in the USA onshore drilling fluid market. Significant advancements include the development of environmentally friendly fluids, high-performance drilling fluids, and advanced fluid management systems. These innovations enhance drilling efficiency, reduce environmental impact, and improve overall operational performance. The unique selling propositions (USPs) of these new products are highlighted, along with their performance metrics and real-world applications.
Propelling Factors for USA Onshore Drilling Fluid Industry Growth
Several factors are driving the growth of the USA onshore drilling fluid market. These include advancements in drilling technologies, increasing demand from shale gas and oil production, favorable government policies promoting domestic energy production, and the continuous development of environmentally friendly drilling fluid solutions that meet stricter environmental regulations. Economic factors such as rising oil and gas prices also contribute to market expansion.
Obstacles in the USA Onshore Drilling Fluid Industry Market
Several challenges hinder the growth of the USA onshore drilling fluid market. Stricter environmental regulations increase the cost of compliance. Supply chain disruptions can lead to shortages of raw materials and increased prices. Intense competition among established and emerging players puts pressure on pricing and profitability. These factors can negatively impact market growth and expansion. The combined effect of these obstacles is estimated to reduce the market growth by xx% in 2026.
Future Opportunities in USA Onshore Drilling Fluid Industry
Future opportunities for the USA onshore drilling fluid market include the exploration of unconventional oil and gas reserves, further development of environmentally friendly and sustainable drilling fluids, increased adoption of advanced fluid management technologies, and the potential for expansion into new geographical areas. These factors present significant opportunities for growth and innovation in the years to come.
Major Players in the USA Onshore Drilling Fluid Industry Ecosystem
- IMDEX LIMITED
- Horizon Mud
- Aes Drilling Fluids
- MEDSERV
- Baker Hughes Company
- Schlumberger Limited
- Newpark Resources Inc
- Weatherford
- National Oilwell Varco
- Francis Drilling Fluids Ltd
- Oleon Americas Inc (Avril Group)
- Q'max Solutions Inc
- Unique Drilling Fluids Inc
- Sunwest Fluids LLC
- McAda Drilling Fluids
- Geo Drilling Fluids Inc
- CES Energy Solutions Corp *List Not Exhaustive
Key Developments in USA Onshore Drilling Fluid Industry Industry
- 2022-Q4: Newpark Resources Inc. launched a new line of environmentally friendly drilling fluids.
- 2023-Q1: Baker Hughes Company acquired a smaller drilling fluid company, expanding its market share.
- 2023-Q3: New regulations regarding the disposal of drilling fluids were implemented in Texas. (Further developments to be added as they occur)
Strategic USA Onshore Drilling Fluid Industry Market Forecast
The USA onshore drilling fluid market is poised for continued growth, driven by increasing demand for oil and gas, advancements in drilling technology, and the growing emphasis on sustainable practices. The market is expected to witness significant innovation in drilling fluid formulations and management systems, offering opportunities for existing and new market entrants. Future growth will also depend on regulatory changes, economic conditions, and oil price fluctuations. However, overall, the outlook remains positive, indicating significant growth potential in the coming years.
USA Onshore Drilling Fluid Industry Segmentation
-
1. Additive Type
- 1.1. Protective Chemicals
- 1.2. Fluid Viscosifiers
- 1.3. Weighting Agents
- 1.4. Wetting Agents
- 1.5. Lost Circulation Materials
- 1.6. Thinners
- 1.7. Rheology Modifiers
- 1.8. Surfactants
- 1.9. Alkalinity and pH Control Materials
- 1.10. Shale Stabilizers
- 1.11. Other Additive Types
-
2. Product Type
- 2.1. Oil-based Drilling Fluid
- 2.2. Synthetic-based Drilling Fluid
- 2.3. Water-based Drilling Fluid
-
3. Basin
- 3.1. Permian
- 3.2. Eagle Ford
- 3.3. Niobrara
- 3.4. Bakken
- 3.5. Appalachia
- 3.6. Other Basins
USA Onshore Drilling Fluid Industry Segmentation By Geography
-
1. North America
- 1.1. United States
- 1.2. Canada
- 1.3. Mexico
-
2. South America
- 2.1. Brazil
- 2.2. Argentina
- 2.3. Rest of South America
-
3. Europe
- 3.1. United Kingdom
- 3.2. Germany
- 3.3. France
- 3.4. Italy
- 3.5. Spain
- 3.6. Russia
- 3.7. Benelux
- 3.8. Nordics
- 3.9. Rest of Europe
-
4. Middle East & Africa
- 4.1. Turkey
- 4.2. Israel
- 4.3. GCC
- 4.4. North Africa
- 4.5. South Africa
- 4.6. Rest of Middle East & Africa
-
5. Asia Pacific
- 5.1. China
- 5.2. India
- 5.3. Japan
- 5.4. South Korea
- 5.5. ASEAN
- 5.6. Oceania
- 5.7. Rest of Asia Pacific
USA Onshore Drilling Fluid Industry Regional Market Share
Geographic Coverage of USA Onshore Drilling Fluid Industry
USA Onshore Drilling Fluid Industry REPORT HIGHLIGHTS
| Aspects | Details |
|---|---|
| Study Period | 2020-2034 |
| Base Year | 2025 |
| Estimated Year | 2026 |
| Forecast Period | 2026-2034 |
| Historical Period | 2020-2025 |
| Growth Rate | CAGR of 7.5% from 2020-2034 |
| Segmentation |
|
Table of Contents
- 1. Introduction
- 1.1. Research Scope
- 1.2. Market Segmentation
- 1.3. Research Objective
- 1.4. Definitions and Assumptions
- 2. Executive Summary
- 2.1. Market Snapshot
- 3. Market Dynamics
- 3.1. Market Drivers
- 3.2. Market Restrains
- 3.3. Market Trends
- 3.4. Market Opportunities
- 4. Market Factor Analysis
- 4.1. Porters Five Forces
- 4.1.1. Bargaining Power of Suppliers
- 4.1.2. Bargaining Power of Buyers
- 4.1.3. Threat of New Entrants
- 4.1.4. Threat of Substitutes
- 4.1.5. Competitive Rivalry
- 4.2. PESTEL analysis
- 4.3. BCG Analysis
- 4.3.1. Stars (High Growth, High Market Share)
- 4.3.2. Cash Cows (Low Growth, High Market Share)
- 4.3.3. Question Mark (High Growth, Low Market Share)
- 4.3.4. Dogs (Low Growth, Low Market Share)
- 4.4. Ansoff Matrix Analysis
- 4.5. Supply Chain Analysis
- 4.6. Regulatory Landscape
- 4.7. Current Market Potential and Opportunity Assessment (TAM–SAM–SOM Framework)
- 4.8. DMV Analyst Note
- 4.1. Porters Five Forces
- 5. Market Analysis, Insights and Forecast 2021-2033
- 5.1. Market Analysis, Insights and Forecast - by Additive Type
- 5.1.1. Protective Chemicals
- 5.1.2. Fluid Viscosifiers
- 5.1.3. Weighting Agents
- 5.1.4. Wetting Agents
- 5.1.5. Lost Circulation Materials
- 5.1.6. Thinners
- 5.1.7. Rheology Modifiers
- 5.1.8. Surfactants
- 5.1.9. Alkalinity and pH Control Materials
- 5.1.10. Shale Stabilizers
- 5.1.11. Other Additive Types
- 5.2. Market Analysis, Insights and Forecast - by Product Type
- 5.2.1. Oil-based Drilling Fluid
- 5.2.2. Synthetic-based Drilling Fluid
- 5.2.3. Water-based Drilling Fluid
- 5.3. Market Analysis, Insights and Forecast - by Basin
- 5.3.1. Permian
- 5.3.2. Eagle Ford
- 5.3.3. Niobrara
- 5.3.4. Bakken
- 5.3.5. Appalachia
- 5.3.6. Other Basins
- 5.4. Market Analysis, Insights and Forecast - by Region
- 5.4.1. North America
- 5.4.2. South America
- 5.4.3. Europe
- 5.4.4. Middle East & Africa
- 5.4.5. Asia Pacific
- 5.1. Market Analysis, Insights and Forecast - by Additive Type
- 6. Global USA Onshore Drilling Fluid Industry Analysis, Insights and Forecast, 2021-2033
- 6.1. Market Analysis, Insights and Forecast - by Additive Type
- 6.1.1. Protective Chemicals
- 6.1.2. Fluid Viscosifiers
- 6.1.3. Weighting Agents
- 6.1.4. Wetting Agents
- 6.1.5. Lost Circulation Materials
- 6.1.6. Thinners
- 6.1.7. Rheology Modifiers
- 6.1.8. Surfactants
- 6.1.9. Alkalinity and pH Control Materials
- 6.1.10. Shale Stabilizers
- 6.1.11. Other Additive Types
- 6.2. Market Analysis, Insights and Forecast - by Product Type
- 6.2.1. Oil-based Drilling Fluid
- 6.2.2. Synthetic-based Drilling Fluid
- 6.2.3. Water-based Drilling Fluid
- 6.3. Market Analysis, Insights and Forecast - by Basin
- 6.3.1. Permian
- 6.3.2. Eagle Ford
- 6.3.3. Niobrara
- 6.3.4. Bakken
- 6.3.5. Appalachia
- 6.3.6. Other Basins
- 6.1. Market Analysis, Insights and Forecast - by Additive Type
- 7. North America USA Onshore Drilling Fluid Industry Analysis, Insights and Forecast, 2020-2032
- 7.1. Market Analysis, Insights and Forecast - by Additive Type
- 7.1.1. Protective Chemicals
- 7.1.2. Fluid Viscosifiers
- 7.1.3. Weighting Agents
- 7.1.4. Wetting Agents
- 7.1.5. Lost Circulation Materials
- 7.1.6. Thinners
- 7.1.7. Rheology Modifiers
- 7.1.8. Surfactants
- 7.1.9. Alkalinity and pH Control Materials
- 7.1.10. Shale Stabilizers
- 7.1.11. Other Additive Types
- 7.2. Market Analysis, Insights and Forecast - by Product Type
- 7.2.1. Oil-based Drilling Fluid
- 7.2.2. Synthetic-based Drilling Fluid
- 7.2.3. Water-based Drilling Fluid
- 7.3. Market Analysis, Insights and Forecast - by Basin
- 7.3.1. Permian
- 7.3.2. Eagle Ford
- 7.3.3. Niobrara
- 7.3.4. Bakken
- 7.3.5. Appalachia
- 7.3.6. Other Basins
- 7.1. Market Analysis, Insights and Forecast - by Additive Type
- 8. South America USA Onshore Drilling Fluid Industry Analysis, Insights and Forecast, 2020-2032
- 8.1. Market Analysis, Insights and Forecast - by Additive Type
- 8.1.1. Protective Chemicals
- 8.1.2. Fluid Viscosifiers
- 8.1.3. Weighting Agents
- 8.1.4. Wetting Agents
- 8.1.5. Lost Circulation Materials
- 8.1.6. Thinners
- 8.1.7. Rheology Modifiers
- 8.1.8. Surfactants
- 8.1.9. Alkalinity and pH Control Materials
- 8.1.10. Shale Stabilizers
- 8.1.11. Other Additive Types
- 8.2. Market Analysis, Insights and Forecast - by Product Type
- 8.2.1. Oil-based Drilling Fluid
- 8.2.2. Synthetic-based Drilling Fluid
- 8.2.3. Water-based Drilling Fluid
- 8.3. Market Analysis, Insights and Forecast - by Basin
- 8.3.1. Permian
- 8.3.2. Eagle Ford
- 8.3.3. Niobrara
- 8.3.4. Bakken
- 8.3.5. Appalachia
- 8.3.6. Other Basins
- 8.1. Market Analysis, Insights and Forecast - by Additive Type
- 9. Europe USA Onshore Drilling Fluid Industry Analysis, Insights and Forecast, 2020-2032
- 9.1. Market Analysis, Insights and Forecast - by Additive Type
- 9.1.1. Protective Chemicals
- 9.1.2. Fluid Viscosifiers
- 9.1.3. Weighting Agents
- 9.1.4. Wetting Agents
- 9.1.5. Lost Circulation Materials
- 9.1.6. Thinners
- 9.1.7. Rheology Modifiers
- 9.1.8. Surfactants
- 9.1.9. Alkalinity and pH Control Materials
- 9.1.10. Shale Stabilizers
- 9.1.11. Other Additive Types
- 9.2. Market Analysis, Insights and Forecast - by Product Type
- 9.2.1. Oil-based Drilling Fluid
- 9.2.2. Synthetic-based Drilling Fluid
- 9.2.3. Water-based Drilling Fluid
- 9.3. Market Analysis, Insights and Forecast - by Basin
- 9.3.1. Permian
- 9.3.2. Eagle Ford
- 9.3.3. Niobrara
- 9.3.4. Bakken
- 9.3.5. Appalachia
- 9.3.6. Other Basins
- 9.1. Market Analysis, Insights and Forecast - by Additive Type
- 10. Middle East & Africa USA Onshore Drilling Fluid Industry Analysis, Insights and Forecast, 2020-2032
- 10.1. Market Analysis, Insights and Forecast - by Additive Type
- 10.1.1. Protective Chemicals
- 10.1.2. Fluid Viscosifiers
- 10.1.3. Weighting Agents
- 10.1.4. Wetting Agents
- 10.1.5. Lost Circulation Materials
- 10.1.6. Thinners
- 10.1.7. Rheology Modifiers
- 10.1.8. Surfactants
- 10.1.9. Alkalinity and pH Control Materials
- 10.1.10. Shale Stabilizers
- 10.1.11. Other Additive Types
- 10.2. Market Analysis, Insights and Forecast - by Product Type
- 10.2.1. Oil-based Drilling Fluid
- 10.2.2. Synthetic-based Drilling Fluid
- 10.2.3. Water-based Drilling Fluid
- 10.3. Market Analysis, Insights and Forecast - by Basin
- 10.3.1. Permian
- 10.3.2. Eagle Ford
- 10.3.3. Niobrara
- 10.3.4. Bakken
- 10.3.5. Appalachia
- 10.3.6. Other Basins
- 10.1. Market Analysis, Insights and Forecast - by Additive Type
- 11. Asia Pacific USA Onshore Drilling Fluid Industry Analysis, Insights and Forecast, 2020-2032
- 11.1. Market Analysis, Insights and Forecast - by Additive Type
- 11.1.1. Protective Chemicals
- 11.1.2. Fluid Viscosifiers
- 11.1.3. Weighting Agents
- 11.1.4. Wetting Agents
- 11.1.5. Lost Circulation Materials
- 11.1.6. Thinners
- 11.1.7. Rheology Modifiers
- 11.1.8. Surfactants
- 11.1.9. Alkalinity and pH Control Materials
- 11.1.10. Shale Stabilizers
- 11.1.11. Other Additive Types
- 11.2. Market Analysis, Insights and Forecast - by Product Type
- 11.2.1. Oil-based Drilling Fluid
- 11.2.2. Synthetic-based Drilling Fluid
- 11.2.3. Water-based Drilling Fluid
- 11.3. Market Analysis, Insights and Forecast - by Basin
- 11.3.1. Permian
- 11.3.2. Eagle Ford
- 11.3.3. Niobrara
- 11.3.4. Bakken
- 11.3.5. Appalachia
- 11.3.6. Other Basins
- 11.1. Market Analysis, Insights and Forecast - by Additive Type
- 12. Competitive Analysis
- 12.1. Company Profiles
- 12.1.1 IMDEX LIMITED
- 12.1.1.1. Company Overview
- 12.1.1.2. Products
- 12.1.1.3. Company Financials
- 12.1.1.4. SWOT Analysis
- 12.1.2 Horizon Mud
- 12.1.2.1. Company Overview
- 12.1.2.2. Products
- 12.1.2.3. Company Financials
- 12.1.2.4. SWOT Analysis
- 12.1.3 Aes Drilling Fluids
- 12.1.3.1. Company Overview
- 12.1.3.2. Products
- 12.1.3.3. Company Financials
- 12.1.3.4. SWOT Analysis
- 12.1.4 MEDSERV
- 12.1.4.1. Company Overview
- 12.1.4.2. Products
- 12.1.4.3. Company Financials
- 12.1.4.4. SWOT Analysis
- 12.1.5 Baker Hughes Company
- 12.1.5.1. Company Overview
- 12.1.5.2. Products
- 12.1.5.3. Company Financials
- 12.1.5.4. SWOT Analysis
- 12.1.6 Schlumberger Limited
- 12.1.6.1. Company Overview
- 12.1.6.2. Products
- 12.1.6.3. Company Financials
- 12.1.6.4. SWOT Analysis
- 12.1.7 Newpark Resources Inc
- 12.1.7.1. Company Overview
- 12.1.7.2. Products
- 12.1.7.3. Company Financials
- 12.1.7.4. SWOT Analysis
- 12.1.8 Weatherford
- 12.1.8.1. Company Overview
- 12.1.8.2. Products
- 12.1.8.3. Company Financials
- 12.1.8.4. SWOT Analysis
- 12.1.9 National Oilwell Varco
- 12.1.9.1. Company Overview
- 12.1.9.2. Products
- 12.1.9.3. Company Financials
- 12.1.9.4. SWOT Analysis
- 12.1.10 Francis Drilling Fluids Ltd
- 12.1.10.1. Company Overview
- 12.1.10.2. Products
- 12.1.10.3. Company Financials
- 12.1.10.4. SWOT Analysis
- 12.1.11 Oleon Americas Inc (Avril Group)
- 12.1.11.1. Company Overview
- 12.1.11.2. Products
- 12.1.11.3. Company Financials
- 12.1.11.4. SWOT Analysis
- 12.1.12 Q'max Solutions Inc
- 12.1.12.1. Company Overview
- 12.1.12.2. Products
- 12.1.12.3. Company Financials
- 12.1.12.4. SWOT Analysis
- 12.1.13 Unique Drilling Fluids Inc
- 12.1.13.1. Company Overview
- 12.1.13.2. Products
- 12.1.13.3. Company Financials
- 12.1.13.4. SWOT Analysis
- 12.1.14 Sunwest Fluids LLC
- 12.1.14.1. Company Overview
- 12.1.14.2. Products
- 12.1.14.3. Company Financials
- 12.1.14.4. SWOT Analysis
- 12.1.15 McAda Drilling Fluids
- 12.1.15.1. Company Overview
- 12.1.15.2. Products
- 12.1.15.3. Company Financials
- 12.1.15.4. SWOT Analysis
- 12.1.16 Geo Drilling Fluids Inc
- 12.1.16.1. Company Overview
- 12.1.16.2. Products
- 12.1.16.3. Company Financials
- 12.1.16.4. SWOT Analysis
- 12.1.17 CES Energy Solutions Corp *List Not Exhaustive
- 12.1.17.1. Company Overview
- 12.1.17.2. Products
- 12.1.17.3. Company Financials
- 12.1.17.4. SWOT Analysis
- 12.1.1 IMDEX LIMITED
- 12.2. Market Entropy
- 12.2.1 Company's Key Areas Served
- 12.2.2 Recent Developments
- 12.3. Company Market Share Analysis 2025
- 12.3.1 Top 5 Companies Market Share Analysis
- 12.3.2 Top 3 Companies Market Share Analysis
- 12.4. List of Potential Customers
- 13. Research Methodology
List of Figures
- Figure 1: Global USA Onshore Drilling Fluid Industry Revenue Breakdown (billion, %) by Region 2025 & 2033
- Figure 2: North America USA Onshore Drilling Fluid Industry Revenue (billion), by Additive Type 2025 & 2033
- Figure 3: North America USA Onshore Drilling Fluid Industry Revenue Share (%), by Additive Type 2025 & 2033
- Figure 4: North America USA Onshore Drilling Fluid Industry Revenue (billion), by Product Type 2025 & 2033
- Figure 5: North America USA Onshore Drilling Fluid Industry Revenue Share (%), by Product Type 2025 & 2033
- Figure 6: North America USA Onshore Drilling Fluid Industry Revenue (billion), by Basin 2025 & 2033
- Figure 7: North America USA Onshore Drilling Fluid Industry Revenue Share (%), by Basin 2025 & 2033
- Figure 8: North America USA Onshore Drilling Fluid Industry Revenue (billion), by Country 2025 & 2033
- Figure 9: North America USA Onshore Drilling Fluid Industry Revenue Share (%), by Country 2025 & 2033
- Figure 10: South America USA Onshore Drilling Fluid Industry Revenue (billion), by Additive Type 2025 & 2033
- Figure 11: South America USA Onshore Drilling Fluid Industry Revenue Share (%), by Additive Type 2025 & 2033
- Figure 12: South America USA Onshore Drilling Fluid Industry Revenue (billion), by Product Type 2025 & 2033
- Figure 13: South America USA Onshore Drilling Fluid Industry Revenue Share (%), by Product Type 2025 & 2033
- Figure 14: South America USA Onshore Drilling Fluid Industry Revenue (billion), by Basin 2025 & 2033
- Figure 15: South America USA Onshore Drilling Fluid Industry Revenue Share (%), by Basin 2025 & 2033
- Figure 16: South America USA Onshore Drilling Fluid Industry Revenue (billion), by Country 2025 & 2033
- Figure 17: South America USA Onshore Drilling Fluid Industry Revenue Share (%), by Country 2025 & 2033
- Figure 18: Europe USA Onshore Drilling Fluid Industry Revenue (billion), by Additive Type 2025 & 2033
- Figure 19: Europe USA Onshore Drilling Fluid Industry Revenue Share (%), by Additive Type 2025 & 2033
- Figure 20: Europe USA Onshore Drilling Fluid Industry Revenue (billion), by Product Type 2025 & 2033
- Figure 21: Europe USA Onshore Drilling Fluid Industry Revenue Share (%), by Product Type 2025 & 2033
- Figure 22: Europe USA Onshore Drilling Fluid Industry Revenue (billion), by Basin 2025 & 2033
- Figure 23: Europe USA Onshore Drilling Fluid Industry Revenue Share (%), by Basin 2025 & 2033
- Figure 24: Europe USA Onshore Drilling Fluid Industry Revenue (billion), by Country 2025 & 2033
- Figure 25: Europe USA Onshore Drilling Fluid Industry Revenue Share (%), by Country 2025 & 2033
- Figure 26: Middle East & Africa USA Onshore Drilling Fluid Industry Revenue (billion), by Additive Type 2025 & 2033
- Figure 27: Middle East & Africa USA Onshore Drilling Fluid Industry Revenue Share (%), by Additive Type 2025 & 2033
- Figure 28: Middle East & Africa USA Onshore Drilling Fluid Industry Revenue (billion), by Product Type 2025 & 2033
- Figure 29: Middle East & Africa USA Onshore Drilling Fluid Industry Revenue Share (%), by Product Type 2025 & 2033
- Figure 30: Middle East & Africa USA Onshore Drilling Fluid Industry Revenue (billion), by Basin 2025 & 2033
- Figure 31: Middle East & Africa USA Onshore Drilling Fluid Industry Revenue Share (%), by Basin 2025 & 2033
- Figure 32: Middle East & Africa USA Onshore Drilling Fluid Industry Revenue (billion), by Country 2025 & 2033
- Figure 33: Middle East & Africa USA Onshore Drilling Fluid Industry Revenue Share (%), by Country 2025 & 2033
- Figure 34: Asia Pacific USA Onshore Drilling Fluid Industry Revenue (billion), by Additive Type 2025 & 2033
- Figure 35: Asia Pacific USA Onshore Drilling Fluid Industry Revenue Share (%), by Additive Type 2025 & 2033
- Figure 36: Asia Pacific USA Onshore Drilling Fluid Industry Revenue (billion), by Product Type 2025 & 2033
- Figure 37: Asia Pacific USA Onshore Drilling Fluid Industry Revenue Share (%), by Product Type 2025 & 2033
- Figure 38: Asia Pacific USA Onshore Drilling Fluid Industry Revenue (billion), by Basin 2025 & 2033
- Figure 39: Asia Pacific USA Onshore Drilling Fluid Industry Revenue Share (%), by Basin 2025 & 2033
- Figure 40: Asia Pacific USA Onshore Drilling Fluid Industry Revenue (billion), by Country 2025 & 2033
- Figure 41: Asia Pacific USA Onshore Drilling Fluid Industry Revenue Share (%), by Country 2025 & 2033
List of Tables
- Table 1: Global USA Onshore Drilling Fluid Industry Revenue billion Forecast, by Additive Type 2020 & 2033
- Table 2: Global USA Onshore Drilling Fluid Industry Revenue billion Forecast, by Product Type 2020 & 2033
- Table 3: Global USA Onshore Drilling Fluid Industry Revenue billion Forecast, by Basin 2020 & 2033
- Table 4: Global USA Onshore Drilling Fluid Industry Revenue billion Forecast, by Region 2020 & 2033
- Table 5: Global USA Onshore Drilling Fluid Industry Revenue billion Forecast, by Additive Type 2020 & 2033
- Table 6: Global USA Onshore Drilling Fluid Industry Revenue billion Forecast, by Product Type 2020 & 2033
- Table 7: Global USA Onshore Drilling Fluid Industry Revenue billion Forecast, by Basin 2020 & 2033
- Table 8: Global USA Onshore Drilling Fluid Industry Revenue billion Forecast, by Country 2020 & 2033
- Table 9: United States USA Onshore Drilling Fluid Industry Revenue (billion) Forecast, by Application 2020 & 2033
- Table 10: Canada USA Onshore Drilling Fluid Industry Revenue (billion) Forecast, by Application 2020 & 2033
- Table 11: Mexico USA Onshore Drilling Fluid Industry Revenue (billion) Forecast, by Application 2020 & 2033
- Table 12: Global USA Onshore Drilling Fluid Industry Revenue billion Forecast, by Additive Type 2020 & 2033
- Table 13: Global USA Onshore Drilling Fluid Industry Revenue billion Forecast, by Product Type 2020 & 2033
- Table 14: Global USA Onshore Drilling Fluid Industry Revenue billion Forecast, by Basin 2020 & 2033
- Table 15: Global USA Onshore Drilling Fluid Industry Revenue billion Forecast, by Country 2020 & 2033
- Table 16: Brazil USA Onshore Drilling Fluid Industry Revenue (billion) Forecast, by Application 2020 & 2033
- Table 17: Argentina USA Onshore Drilling Fluid Industry Revenue (billion) Forecast, by Application 2020 & 2033
- Table 18: Rest of South America USA Onshore Drilling Fluid Industry Revenue (billion) Forecast, by Application 2020 & 2033
- Table 19: Global USA Onshore Drilling Fluid Industry Revenue billion Forecast, by Additive Type 2020 & 2033
- Table 20: Global USA Onshore Drilling Fluid Industry Revenue billion Forecast, by Product Type 2020 & 2033
- Table 21: Global USA Onshore Drilling Fluid Industry Revenue billion Forecast, by Basin 2020 & 2033
- Table 22: Global USA Onshore Drilling Fluid Industry Revenue billion Forecast, by Country 2020 & 2033
- Table 23: United Kingdom USA Onshore Drilling Fluid Industry Revenue (billion) Forecast, by Application 2020 & 2033
- Table 24: Germany USA Onshore Drilling Fluid Industry Revenue (billion) Forecast, by Application 2020 & 2033
- Table 25: France USA Onshore Drilling Fluid Industry Revenue (billion) Forecast, by Application 2020 & 2033
- Table 26: Italy USA Onshore Drilling Fluid Industry Revenue (billion) Forecast, by Application 2020 & 2033
- Table 27: Spain USA Onshore Drilling Fluid Industry Revenue (billion) Forecast, by Application 2020 & 2033
- Table 28: Russia USA Onshore Drilling Fluid Industry Revenue (billion) Forecast, by Application 2020 & 2033
- Table 29: Benelux USA Onshore Drilling Fluid Industry Revenue (billion) Forecast, by Application 2020 & 2033
- Table 30: Nordics USA Onshore Drilling Fluid Industry Revenue (billion) Forecast, by Application 2020 & 2033
- Table 31: Rest of Europe USA Onshore Drilling Fluid Industry Revenue (billion) Forecast, by Application 2020 & 2033
- Table 32: Global USA Onshore Drilling Fluid Industry Revenue billion Forecast, by Additive Type 2020 & 2033
- Table 33: Global USA Onshore Drilling Fluid Industry Revenue billion Forecast, by Product Type 2020 & 2033
- Table 34: Global USA Onshore Drilling Fluid Industry Revenue billion Forecast, by Basin 2020 & 2033
- Table 35: Global USA Onshore Drilling Fluid Industry Revenue billion Forecast, by Country 2020 & 2033
- Table 36: Turkey USA Onshore Drilling Fluid Industry Revenue (billion) Forecast, by Application 2020 & 2033
- Table 37: Israel USA Onshore Drilling Fluid Industry Revenue (billion) Forecast, by Application 2020 & 2033
- Table 38: GCC USA Onshore Drilling Fluid Industry Revenue (billion) Forecast, by Application 2020 & 2033
- Table 39: North Africa USA Onshore Drilling Fluid Industry Revenue (billion) Forecast, by Application 2020 & 2033
- Table 40: South Africa USA Onshore Drilling Fluid Industry Revenue (billion) Forecast, by Application 2020 & 2033
- Table 41: Rest of Middle East & Africa USA Onshore Drilling Fluid Industry Revenue (billion) Forecast, by Application 2020 & 2033
- Table 42: Global USA Onshore Drilling Fluid Industry Revenue billion Forecast, by Additive Type 2020 & 2033
- Table 43: Global USA Onshore Drilling Fluid Industry Revenue billion Forecast, by Product Type 2020 & 2033
- Table 44: Global USA Onshore Drilling Fluid Industry Revenue billion Forecast, by Basin 2020 & 2033
- Table 45: Global USA Onshore Drilling Fluid Industry Revenue billion Forecast, by Country 2020 & 2033
- Table 46: China USA Onshore Drilling Fluid Industry Revenue (billion) Forecast, by Application 2020 & 2033
- Table 47: India USA Onshore Drilling Fluid Industry Revenue (billion) Forecast, by Application 2020 & 2033
- Table 48: Japan USA Onshore Drilling Fluid Industry Revenue (billion) Forecast, by Application 2020 & 2033
- Table 49: South Korea USA Onshore Drilling Fluid Industry Revenue (billion) Forecast, by Application 2020 & 2033
- Table 50: ASEAN USA Onshore Drilling Fluid Industry Revenue (billion) Forecast, by Application 2020 & 2033
- Table 51: Oceania USA Onshore Drilling Fluid Industry Revenue (billion) Forecast, by Application 2020 & 2033
- Table 52: Rest of Asia Pacific USA Onshore Drilling Fluid Industry Revenue (billion) Forecast, by Application 2020 & 2033
Frequently Asked Questions
1. What is the projected Compound Annual Growth Rate (CAGR) of the USA Onshore Drilling Fluid Industry?
The projected CAGR is approximately 7.5%.
2. Which companies are prominent players in the USA Onshore Drilling Fluid Industry?
Key companies in the market include IMDEX LIMITED, Horizon Mud, Aes Drilling Fluids, MEDSERV, Baker Hughes Company, Schlumberger Limited, Newpark Resources Inc, Weatherford, National Oilwell Varco, Francis Drilling Fluids Ltd, Oleon Americas Inc (Avril Group), Q'max Solutions Inc, Unique Drilling Fluids Inc, Sunwest Fluids LLC, McAda Drilling Fluids, Geo Drilling Fluids Inc, CES Energy Solutions Corp *List Not Exhaustive.
3. What are the main segments of the USA Onshore Drilling Fluid Industry?
The market segments include Additive Type, Product Type, Basin.
4. Can you provide details about the market size?
The market size is estimated to be USD 2.7 billion as of 2022.
5. What are some drivers contributing to market growth?
; Low Breakeven Price and High Crude Oil Price; Increasing Demand for Longer Lateral Length; Continuous Growth in Demand from Permian Basin.
6. What are the notable trends driving market growth?
Continuous Growth in Demand from Permian Basin.
7. Are there any restraints impacting market growth?
; Low Breakeven Price and High Crude Oil Price; Increasing Demand for Longer Lateral Length; Continuous Growth in Demand from Permian Basin.
8. Can you provide examples of recent developments in the market?
N/A
9. What pricing options are available for accessing the report?
Pricing options include single-user, multi-user, and enterprise licenses priced at USD 3800, USD 4500, and USD 5800 respectively.
10. Is the market size provided in terms of value or volume?
The market size is provided in terms of value, measured in billion.
11. Are there any specific market keywords associated with the report?
Yes, the market keyword associated with the report is "USA Onshore Drilling Fluid Industry," which aids in identifying and referencing the specific market segment covered.
12. How do I determine which pricing option suits my needs best?
The pricing options vary based on user requirements and access needs. Individual users may opt for single-user licenses, while businesses requiring broader access may choose multi-user or enterprise licenses for cost-effective access to the report.
13. Are there any additional resources or data provided in the USA Onshore Drilling Fluid Industry report?
While the report offers comprehensive insights, it's advisable to review the specific contents or supplementary materials provided to ascertain if additional resources or data are available.
14. How can I stay updated on further developments or reports in the USA Onshore Drilling Fluid Industry?
To stay informed about further developments, trends, and reports in the USA Onshore Drilling Fluid Industry, consider subscribing to industry newsletters, following relevant companies and organizations, or regularly checking reputable industry news sources and publications.
Methodology
Step 1 - Identification of Relevant Samples Size from Population Database


Step 2 - Approaches for Defining Global Market Size (Value, Volume* & Price*)

Note*: In applicable scenarios
Step 3 - Data Sources
Primary Research
- Web Analytics
- Survey Reports
- Research Institute
- Latest Research Reports
- Opinion Leaders
Secondary Research
- Annual Reports
- White Paper
- Latest Press Release
- Industry Association
- Paid Database
- Investor Presentations

Step 4 - Data Triangulation
Involves using different sources of information in order to increase the validity of a study
These sources are likely to be stakeholders in a program - participants, other researchers, program staff, other community members, and so on.
Then we put all data in single framework & apply various statistical tools to find out the dynamic on the market.
During the analysis stage, feedback from the stakeholder groups would be compared to determine areas of agreement as well as areas of divergence