

Key Insights
The global sand management services market is experiencing robust growth, driven by the increasing demand for oil and gas extraction, particularly from unconventional resources like shale gas and tight oil. These resources require extensive hydraulic fracturing, a process heavily reliant on specialized sand management solutions for proppant handling, transportation, and placement. Technological advancements in proppant types, such as the development of more resilient and efficient proppants, are further fueling market expansion. The rising adoption of automation and digital technologies in sand management operations is enhancing efficiency, reducing operational costs, and optimizing resource utilization. Major players like Schlumberger, Baker Hughes, and others are actively investing in research and development to improve their offerings, creating a competitive landscape characterized by innovation and mergers & acquisitions. This results in continuous improvement in service quality and efficiency, ultimately benefiting the oil and gas sector.
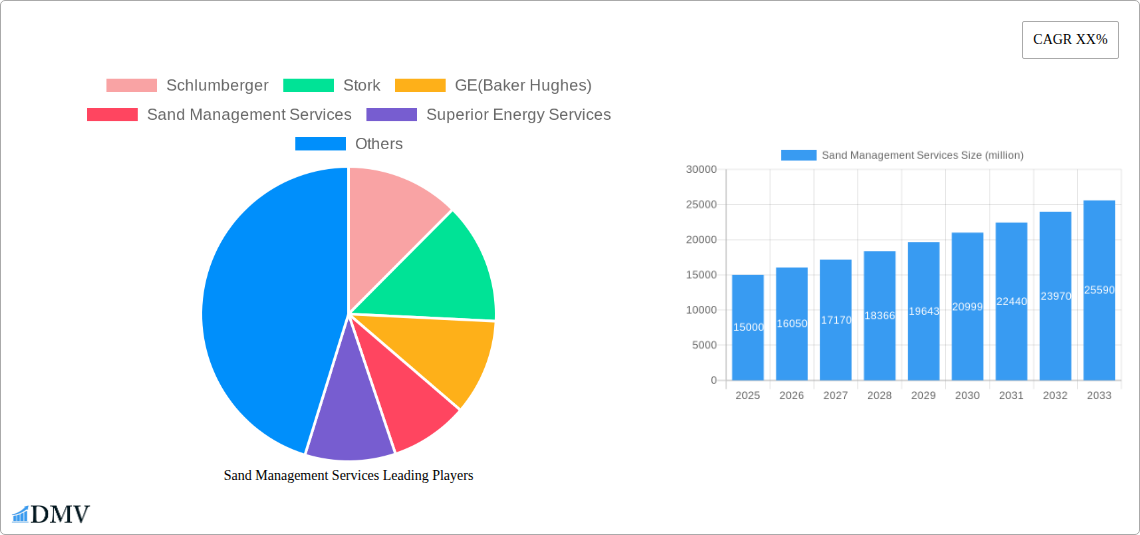
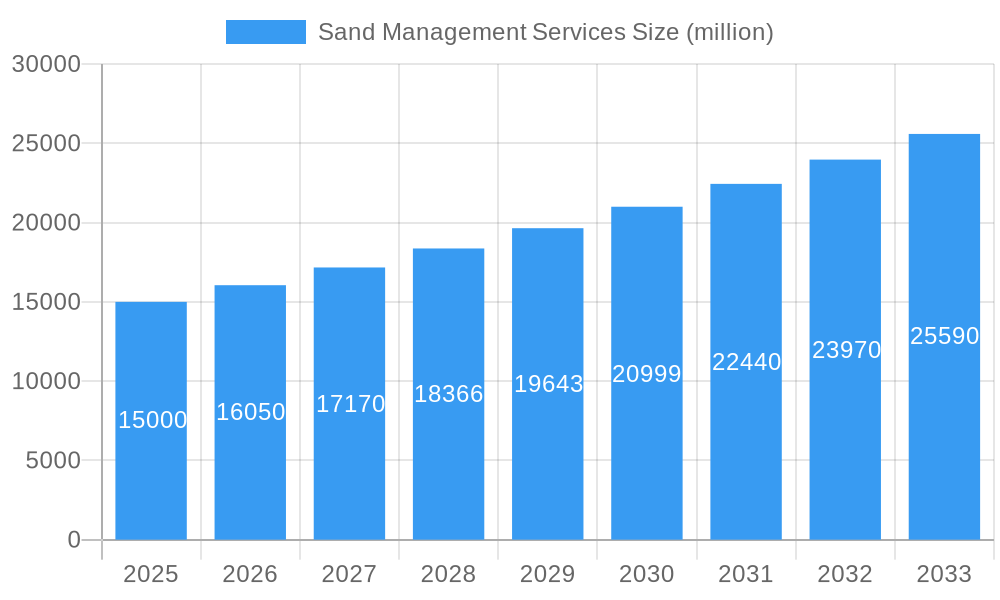
Sand Management Services Market Size (In Billion)
Despite this positive outlook, the market faces certain challenges. Fluctuations in oil and gas prices significantly impact investment decisions in upstream activities, creating uncertainty in market demand. Environmental concerns related to water usage and waste disposal associated with hydraulic fracturing necessitate stringent regulations and sustainable practices, which can increase operational costs. Furthermore, the geographic dispersion of oil and gas reserves requires efficient logistics and infrastructure to support sand management operations, presenting logistical complexities for service providers. However, the long-term outlook remains promising, fueled by the persistent need for energy resources and ongoing technological advancements that address environmental concerns and improve efficiency. We estimate the market size in 2025 to be $15 billion, projecting a CAGR of 7% from 2025 to 2033. This estimation is based on historical growth rates of similar service sectors within the energy industry, combined with anticipated increases in shale gas and tight oil production.
Sand Management Services Company Market Share
Sand Management Services Market Report: A Comprehensive Analysis (2019-2033)
This in-depth report provides a comprehensive analysis of the global Sand Management Services market, projecting a market value exceeding $XX million by 2033. The study covers the historical period (2019-2024), the base year (2025), and the forecast period (2025-2033), offering invaluable insights for stakeholders across the industry. Key players such as Schlumberger, Stork, GE (Baker Hughes), and others are analyzed to uncover market dynamics and future growth potential.
Sand Management Services Market Composition & Trends
The global Sand Management Services market is moderately concentrated, with a few major players holding significant market share. Schlumberger and GE (Baker Hughes) are estimated to collectively account for approximately 40% of the market in 2025, while other players such as Stork and Superior Energy Services contribute significantly to the remaining market share. Smaller players, including SMS Oilfield, Variperm, and RGL Reservoir Management, are actively competing for market share through niche service offerings and regional expansion.
Market concentration is influenced by factors including technological advancements, economies of scale, and the high capital investment required to enter the market. Innovation is driven by the need for improved efficiency, reduced environmental impact, and enhanced reservoir management techniques. Regulatory changes, particularly those related to environmental protection and operational safety, significantly impact market dynamics. Substitute products, such as alternative proppants, pose a competitive threat, although their adoption remains limited due to factors such as cost and performance characteristics. End-users primarily comprise oil and gas exploration and production companies, with a significant focus on unconventional resources development. M&A activities within the sand management sector have been moderate in recent years, with total deal values estimated at $XX million between 2019 and 2024. These activities primarily reflect strategic acquisitions by major players to expand their service portfolios and geographic reach.
- Market Share Distribution (2025): Schlumberger (25%), GE (Baker Hughes) (15%), Stork (10%), Superior Energy Services (8%), Others (42%)
- M&A Deal Value (2019-2024): $XX million
Sand Management Services Industry Evolution
The Sand Management Services market has witnessed significant evolution driven by several key factors. The industry's growth trajectory has been closely tied to the global energy demand and exploration and production activities. During the historical period (2019-2024), the market experienced fluctuating growth rates due to global economic conditions and oil price volatility, with an average annual growth rate (AAGR) estimated at xx%. However, the forecast period (2025-2033) is projected to see a steady increase in the market size due to the increasing focus on unconventional resource development and improvements in sand management technologies. Technological advancements, such as improved sand control techniques, automation, and data analytics, are enhancing operational efficiency and reducing costs. This includes advancements in proppant selection, delivery methods, and well completion techniques. Furthermore, the increasing demand for sustainable sand management practices is creating opportunities for companies offering eco-friendly solutions. Consumer demand is shifting towards integrated sand management services that offer a comprehensive solution, integrating multiple stages of the process. This trend has pushed companies to improve their service portfolio and increase their efficiency.
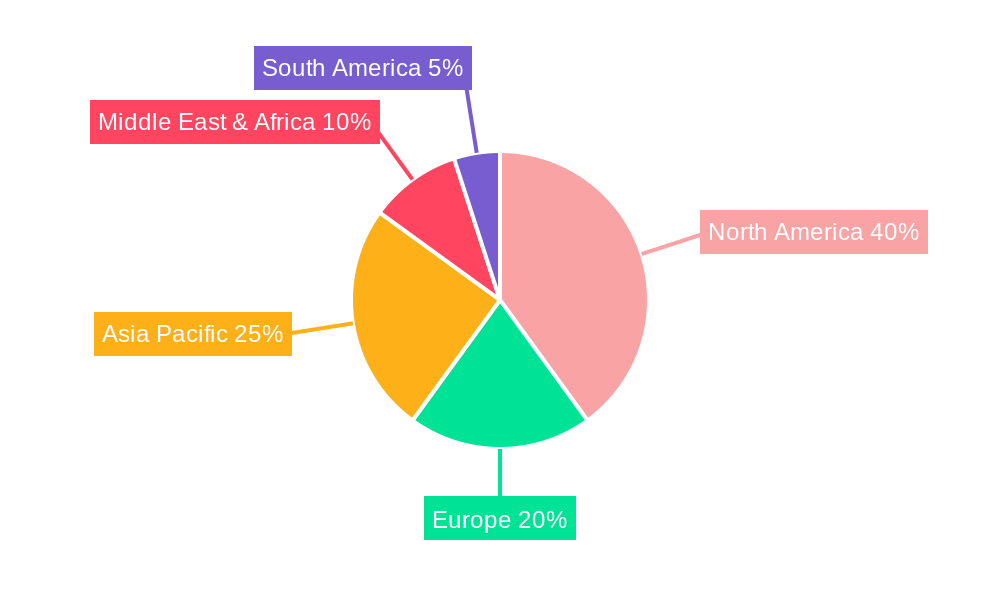
Leading Regions, Countries, or Segments in Sand Management Services
North America, particularly the United States, dominates the global Sand Management Services market due to the substantial shale gas and oil production activities in regions like the Permian Basin and Marcellus Shale. This dominance is driven by several factors:
- High Investment in Unconventional Resources: Significant capital investments in unconventional resource extraction drive demand for efficient and reliable sand management services.
- Favorable Regulatory Environment: Supportive regulatory frameworks facilitate exploration and production activities, fostering demand for these services.
- Technological Advancements: The strong presence of leading technology providers and research institutions within North America fuels innovation within the industry.
- Extensive Infrastructure: Well-developed infrastructure and skilled workforce contribute to the operational efficiency of sand management services.
Other regions, such as the Middle East and Asia-Pacific, are showing promising growth potential owing to increasing investment in oil and gas exploration and production, although they lag behind North America in terms of market share.
Sand Management Services Product Innovations
Recent innovations in sand management technologies include advanced proppant delivery systems, improved sand control techniques, and automation systems designed to optimize well completion processes. These innovations focus on minimizing proppant losses, enhancing reservoir stimulation efficiency, and improving operational safety. Unique selling propositions often center on the efficiency, cost-effectiveness, and sustainability of solutions. These improvements significantly contribute to the overall efficiency and performance of hydraulic fracturing operations, leading to increased productivity in oil and gas extraction.
Propelling Factors for Sand Management Services Growth
Several factors are fueling the growth of the Sand Management Services market. Technological advancements, particularly in automation, remote monitoring, and data analytics, are driving operational efficiencies and reducing costs. The increasing demand for unconventional resources, such as shale gas and tight oil, is a major driver, requiring sophisticated sand management solutions. Furthermore, favorable government policies and regulatory frameworks, particularly those that support technological innovation and sustainable practices, contribute to market growth. Economic growth in several key regions also contributes to the expansion of the market, increasing spending in the energy sector.
Obstacles in the Sand Management Services Market
The Sand Management Services market faces several obstacles. Strict environmental regulations, especially concerning the disposal of spent proppants and the management of wastewater, are increasing operational costs and creating regulatory challenges. Supply chain disruptions, caused by factors such as raw material shortages or transportation issues, can lead to delays in projects and negatively impact profitability. Furthermore, intense competition from established players and emerging companies, each vying for market share, adds to the challenges faced by businesses in this industry. The impact of these obstacles on market growth can be estimated at an estimated xx% reduction in projected growth rates in the coming years.
Future Opportunities in Sand Management Services
The Sand Management Services market presents several promising future opportunities. The emergence of new technologies, such as advanced materials and digital solutions, offers considerable scope for further innovation. The expansion into new markets, particularly in emerging economies with growing energy demands, presents significant growth potential. Shifting consumer demands towards environmentally sustainable solutions create opportunities for businesses offering eco-friendly proppants and waste management technologies. The focus on data analytics and automation will also drive future innovation, pushing the optimization of operational processes and boosting productivity.
Major Players in the Sand Management Services Ecosystem
- Schlumberger
- Stork
- GE (Baker Hughes)
- Sand Management Services
- Superior Energy Services
- Variperm
- SMS Oilfield
- RGL Reservoir Management
- Siao Petroleo
- EnerCorp Sand Solutions
Key Developments in Sand Management Services Industry
- 2022 (Q4): Schlumberger launches a new automated sand management system, enhancing operational efficiency by xx%.
- 2023 (Q1): Stork acquires a smaller sand management company, expanding its service portfolio and geographical reach.
- 2023 (Q3): New environmental regulations are implemented in the US, impacting the cost and operational practices of several companies.
Strategic Sand Management Services Market Forecast
The Sand Management Services market is poised for substantial growth in the coming years, driven by the continued demand for unconventional resources, technological advancements, and favorable regulatory environments in key regions. The market is expected to experience robust growth, reaching an estimated value exceeding $XX million by 2033. Strategic partnerships, technological innovations, and expansion into new markets will be critical factors for success in this dynamic industry. The increasing adoption of sustainable sand management practices will further drive growth and position the industry for long-term expansion.
Sand Management Services Segmentation
-
1. Application
- 1.1. Onshore
- 1.2. Offshore
-
2. Types
- 2.1. Sand Control Devices
- 2.2. Software
Sand Management Services Segmentation By Geography
-
1. North America
- 1.1. United States
- 1.2. Canada
- 1.3. Mexico
-
2. South America
- 2.1. Brazil
- 2.2. Argentina
- 2.3. Rest of South America
-
3. Europe
- 3.1. United Kingdom
- 3.2. Germany
- 3.3. France
- 3.4. Italy
- 3.5. Spain
- 3.6. Russia
- 3.7. Benelux
- 3.8. Nordics
- 3.9. Rest of Europe
-
4. Middle East & Africa
- 4.1. Turkey
- 4.2. Israel
- 4.3. GCC
- 4.4. North Africa
- 4.5. South Africa
- 4.6. Rest of Middle East & Africa
-
5. Asia Pacific
- 5.1. China
- 5.2. India
- 5.3. Japan
- 5.4. South Korea
- 5.5. ASEAN
- 5.6. Oceania
- 5.7. Rest of Asia Pacific
Sand Management Services Regional Market Share
Geographic Coverage of Sand Management Services
Sand Management Services REPORT HIGHLIGHTS
| Aspects | Details |
|---|---|
| Study Period | 2020-2034 |
| Base Year | 2025 |
| Estimated Year | 2026 |
| Forecast Period | 2026-2034 |
| Historical Period | 2020-2025 |
| Growth Rate | CAGR of XX% from 2020-2034 |
| Segmentation |
|
Table of Contents
- 1. Introduction
- 1.1. Research Scope
- 1.2. Market Segmentation
- 1.3. Research Methodology
- 1.4. Definitions and Assumptions
- 2. Executive Summary
- 2.1. Introduction
- 3. Market Dynamics
- 3.1. Introduction
- 3.2. Market Drivers
- 3.3. Market Restrains
- 3.4. Market Trends
- 4. Market Factor Analysis
- 4.1. Porters Five Forces
- 4.2. Supply/Value Chain
- 4.3. PESTEL analysis
- 4.4. Market Entropy
- 4.5. Patent/Trademark Analysis
- 5. Global Sand Management Services Analysis, Insights and Forecast, 2020-2032
- 5.1. Market Analysis, Insights and Forecast - by Application
- 5.1.1. Onshore
- 5.1.2. Offshore
- 5.2. Market Analysis, Insights and Forecast - by Types
- 5.2.1. Sand Control Devices
- 5.2.2. Software
- 5.3. Market Analysis, Insights and Forecast - by Region
- 5.3.1. North America
- 5.3.2. South America
- 5.3.3. Europe
- 5.3.4. Middle East & Africa
- 5.3.5. Asia Pacific
- 5.1. Market Analysis, Insights and Forecast - by Application
- 6. North America Sand Management Services Analysis, Insights and Forecast, 2020-2032
- 6.1. Market Analysis, Insights and Forecast - by Application
- 6.1.1. Onshore
- 6.1.2. Offshore
- 6.2. Market Analysis, Insights and Forecast - by Types
- 6.2.1. Sand Control Devices
- 6.2.2. Software
- 6.1. Market Analysis, Insights and Forecast - by Application
- 7. South America Sand Management Services Analysis, Insights and Forecast, 2020-2032
- 7.1. Market Analysis, Insights and Forecast - by Application
- 7.1.1. Onshore
- 7.1.2. Offshore
- 7.2. Market Analysis, Insights and Forecast - by Types
- 7.2.1. Sand Control Devices
- 7.2.2. Software
- 7.1. Market Analysis, Insights and Forecast - by Application
- 8. Europe Sand Management Services Analysis, Insights and Forecast, 2020-2032
- 8.1. Market Analysis, Insights and Forecast - by Application
- 8.1.1. Onshore
- 8.1.2. Offshore
- 8.2. Market Analysis, Insights and Forecast - by Types
- 8.2.1. Sand Control Devices
- 8.2.2. Software
- 8.1. Market Analysis, Insights and Forecast - by Application
- 9. Middle East & Africa Sand Management Services Analysis, Insights and Forecast, 2020-2032
- 9.1. Market Analysis, Insights and Forecast - by Application
- 9.1.1. Onshore
- 9.1.2. Offshore
- 9.2. Market Analysis, Insights and Forecast - by Types
- 9.2.1. Sand Control Devices
- 9.2.2. Software
- 9.1. Market Analysis, Insights and Forecast - by Application
- 10. Asia Pacific Sand Management Services Analysis, Insights and Forecast, 2020-2032
- 10.1. Market Analysis, Insights and Forecast - by Application
- 10.1.1. Onshore
- 10.1.2. Offshore
- 10.2. Market Analysis, Insights and Forecast - by Types
- 10.2.1. Sand Control Devices
- 10.2.2. Software
- 10.1. Market Analysis, Insights and Forecast - by Application
- 11. Competitive Analysis
- 11.1. Global Market Share Analysis 2025
- 11.2. Company Profiles
- 11.2.1 Schlumberger
- 11.2.1.1. Overview
- 11.2.1.2. Products
- 11.2.1.3. SWOT Analysis
- 11.2.1.4. Recent Developments
- 11.2.1.5. Financials (Based on Availability)
- 11.2.2 Stork
- 11.2.2.1. Overview
- 11.2.2.2. Products
- 11.2.2.3. SWOT Analysis
- 11.2.2.4. Recent Developments
- 11.2.2.5. Financials (Based on Availability)
- 11.2.3 GE(Baker Hughes)
- 11.2.3.1. Overview
- 11.2.3.2. Products
- 11.2.3.3. SWOT Analysis
- 11.2.3.4. Recent Developments
- 11.2.3.5. Financials (Based on Availability)
- 11.2.4 Sand Management Services
- 11.2.4.1. Overview
- 11.2.4.2. Products
- 11.2.4.3. SWOT Analysis
- 11.2.4.4. Recent Developments
- 11.2.4.5. Financials (Based on Availability)
- 11.2.5 Superior Energy Services
- 11.2.5.1. Overview
- 11.2.5.2. Products
- 11.2.5.3. SWOT Analysis
- 11.2.5.4. Recent Developments
- 11.2.5.5. Financials (Based on Availability)
- 11.2.6 Variperm
- 11.2.6.1. Overview
- 11.2.6.2. Products
- 11.2.6.3. SWOT Analysis
- 11.2.6.4. Recent Developments
- 11.2.6.5. Financials (Based on Availability)
- 11.2.7 SMS Oilfield
- 11.2.7.1. Overview
- 11.2.7.2. Products
- 11.2.7.3. SWOT Analysis
- 11.2.7.4. Recent Developments
- 11.2.7.5. Financials (Based on Availability)
- 11.2.8 RGL Reservoir Management
- 11.2.8.1. Overview
- 11.2.8.2. Products
- 11.2.8.3. SWOT Analysis
- 11.2.8.4. Recent Developments
- 11.2.8.5. Financials (Based on Availability)
- 11.2.9 Siao Petroleo
- 11.2.9.1. Overview
- 11.2.9.2. Products
- 11.2.9.3. SWOT Analysis
- 11.2.9.4. Recent Developments
- 11.2.9.5. Financials (Based on Availability)
- 11.2.10 EnerCorp Sand Solutions
- 11.2.10.1. Overview
- 11.2.10.2. Products
- 11.2.10.3. SWOT Analysis
- 11.2.10.4. Recent Developments
- 11.2.10.5. Financials (Based on Availability)
- 11.2.1 Schlumberger
List of Figures
- Figure 1: Global Sand Management Services Revenue Breakdown (million, %) by Region 2025 & 2033
- Figure 2: North America Sand Management Services Revenue (million), by Application 2025 & 2033
- Figure 3: North America Sand Management Services Revenue Share (%), by Application 2025 & 2033
- Figure 4: North America Sand Management Services Revenue (million), by Types 2025 & 2033
- Figure 5: North America Sand Management Services Revenue Share (%), by Types 2025 & 2033
- Figure 6: North America Sand Management Services Revenue (million), by Country 2025 & 2033
- Figure 7: North America Sand Management Services Revenue Share (%), by Country 2025 & 2033
- Figure 8: South America Sand Management Services Revenue (million), by Application 2025 & 2033
- Figure 9: South America Sand Management Services Revenue Share (%), by Application 2025 & 2033
- Figure 10: South America Sand Management Services Revenue (million), by Types 2025 & 2033
- Figure 11: South America Sand Management Services Revenue Share (%), by Types 2025 & 2033
- Figure 12: South America Sand Management Services Revenue (million), by Country 2025 & 2033
- Figure 13: South America Sand Management Services Revenue Share (%), by Country 2025 & 2033
- Figure 14: Europe Sand Management Services Revenue (million), by Application 2025 & 2033
- Figure 15: Europe Sand Management Services Revenue Share (%), by Application 2025 & 2033
- Figure 16: Europe Sand Management Services Revenue (million), by Types 2025 & 2033
- Figure 17: Europe Sand Management Services Revenue Share (%), by Types 2025 & 2033
- Figure 18: Europe Sand Management Services Revenue (million), by Country 2025 & 2033
- Figure 19: Europe Sand Management Services Revenue Share (%), by Country 2025 & 2033
- Figure 20: Middle East & Africa Sand Management Services Revenue (million), by Application 2025 & 2033
- Figure 21: Middle East & Africa Sand Management Services Revenue Share (%), by Application 2025 & 2033
- Figure 22: Middle East & Africa Sand Management Services Revenue (million), by Types 2025 & 2033
- Figure 23: Middle East & Africa Sand Management Services Revenue Share (%), by Types 2025 & 2033
- Figure 24: Middle East & Africa Sand Management Services Revenue (million), by Country 2025 & 2033
- Figure 25: Middle East & Africa Sand Management Services Revenue Share (%), by Country 2025 & 2033
- Figure 26: Asia Pacific Sand Management Services Revenue (million), by Application 2025 & 2033
- Figure 27: Asia Pacific Sand Management Services Revenue Share (%), by Application 2025 & 2033
- Figure 28: Asia Pacific Sand Management Services Revenue (million), by Types 2025 & 2033
- Figure 29: Asia Pacific Sand Management Services Revenue Share (%), by Types 2025 & 2033
- Figure 30: Asia Pacific Sand Management Services Revenue (million), by Country 2025 & 2033
- Figure 31: Asia Pacific Sand Management Services Revenue Share (%), by Country 2025 & 2033
List of Tables
- Table 1: Global Sand Management Services Revenue million Forecast, by Application 2020 & 2033
- Table 2: Global Sand Management Services Revenue million Forecast, by Types 2020 & 2033
- Table 3: Global Sand Management Services Revenue million Forecast, by Region 2020 & 2033
- Table 4: Global Sand Management Services Revenue million Forecast, by Application 2020 & 2033
- Table 5: Global Sand Management Services Revenue million Forecast, by Types 2020 & 2033
- Table 6: Global Sand Management Services Revenue million Forecast, by Country 2020 & 2033
- Table 7: United States Sand Management Services Revenue (million) Forecast, by Application 2020 & 2033
- Table 8: Canada Sand Management Services Revenue (million) Forecast, by Application 2020 & 2033
- Table 9: Mexico Sand Management Services Revenue (million) Forecast, by Application 2020 & 2033
- Table 10: Global Sand Management Services Revenue million Forecast, by Application 2020 & 2033
- Table 11: Global Sand Management Services Revenue million Forecast, by Types 2020 & 2033
- Table 12: Global Sand Management Services Revenue million Forecast, by Country 2020 & 2033
- Table 13: Brazil Sand Management Services Revenue (million) Forecast, by Application 2020 & 2033
- Table 14: Argentina Sand Management Services Revenue (million) Forecast, by Application 2020 & 2033
- Table 15: Rest of South America Sand Management Services Revenue (million) Forecast, by Application 2020 & 2033
- Table 16: Global Sand Management Services Revenue million Forecast, by Application 2020 & 2033
- Table 17: Global Sand Management Services Revenue million Forecast, by Types 2020 & 2033
- Table 18: Global Sand Management Services Revenue million Forecast, by Country 2020 & 2033
- Table 19: United Kingdom Sand Management Services Revenue (million) Forecast, by Application 2020 & 2033
- Table 20: Germany Sand Management Services Revenue (million) Forecast, by Application 2020 & 2033
- Table 21: France Sand Management Services Revenue (million) Forecast, by Application 2020 & 2033
- Table 22: Italy Sand Management Services Revenue (million) Forecast, by Application 2020 & 2033
- Table 23: Spain Sand Management Services Revenue (million) Forecast, by Application 2020 & 2033
- Table 24: Russia Sand Management Services Revenue (million) Forecast, by Application 2020 & 2033
- Table 25: Benelux Sand Management Services Revenue (million) Forecast, by Application 2020 & 2033
- Table 26: Nordics Sand Management Services Revenue (million) Forecast, by Application 2020 & 2033
- Table 27: Rest of Europe Sand Management Services Revenue (million) Forecast, by Application 2020 & 2033
- Table 28: Global Sand Management Services Revenue million Forecast, by Application 2020 & 2033
- Table 29: Global Sand Management Services Revenue million Forecast, by Types 2020 & 2033
- Table 30: Global Sand Management Services Revenue million Forecast, by Country 2020 & 2033
- Table 31: Turkey Sand Management Services Revenue (million) Forecast, by Application 2020 & 2033
- Table 32: Israel Sand Management Services Revenue (million) Forecast, by Application 2020 & 2033
- Table 33: GCC Sand Management Services Revenue (million) Forecast, by Application 2020 & 2033
- Table 34: North Africa Sand Management Services Revenue (million) Forecast, by Application 2020 & 2033
- Table 35: South Africa Sand Management Services Revenue (million) Forecast, by Application 2020 & 2033
- Table 36: Rest of Middle East & Africa Sand Management Services Revenue (million) Forecast, by Application 2020 & 2033
- Table 37: Global Sand Management Services Revenue million Forecast, by Application 2020 & 2033
- Table 38: Global Sand Management Services Revenue million Forecast, by Types 2020 & 2033
- Table 39: Global Sand Management Services Revenue million Forecast, by Country 2020 & 2033
- Table 40: China Sand Management Services Revenue (million) Forecast, by Application 2020 & 2033
- Table 41: India Sand Management Services Revenue (million) Forecast, by Application 2020 & 2033
- Table 42: Japan Sand Management Services Revenue (million) Forecast, by Application 2020 & 2033
- Table 43: South Korea Sand Management Services Revenue (million) Forecast, by Application 2020 & 2033
- Table 44: ASEAN Sand Management Services Revenue (million) Forecast, by Application 2020 & 2033
- Table 45: Oceania Sand Management Services Revenue (million) Forecast, by Application 2020 & 2033
- Table 46: Rest of Asia Pacific Sand Management Services Revenue (million) Forecast, by Application 2020 & 2033
Frequently Asked Questions
1. What is the projected Compound Annual Growth Rate (CAGR) of the Sand Management Services?
The projected CAGR is approximately XX%.
2. Which companies are prominent players in the Sand Management Services?
Key companies in the market include Schlumberger, Stork, GE(Baker Hughes), Sand Management Services, Superior Energy Services, Variperm, SMS Oilfield, RGL Reservoir Management, Siao Petroleo, EnerCorp Sand Solutions.
3. What are the main segments of the Sand Management Services?
The market segments include Application, Types.
4. Can you provide details about the market size?
The market size is estimated to be USD XXX million as of 2022.
5. What are some drivers contributing to market growth?
N/A
6. What are the notable trends driving market growth?
N/A
7. Are there any restraints impacting market growth?
N/A
8. Can you provide examples of recent developments in the market?
N/A
9. What pricing options are available for accessing the report?
Pricing options include single-user, multi-user, and enterprise licenses priced at USD 4900.00, USD 7350.00, and USD 9800.00 respectively.
10. Is the market size provided in terms of value or volume?
The market size is provided in terms of value, measured in million.
11. Are there any specific market keywords associated with the report?
Yes, the market keyword associated with the report is "Sand Management Services," which aids in identifying and referencing the specific market segment covered.
12. How do I determine which pricing option suits my needs best?
The pricing options vary based on user requirements and access needs. Individual users may opt for single-user licenses, while businesses requiring broader access may choose multi-user or enterprise licenses for cost-effective access to the report.
13. Are there any additional resources or data provided in the Sand Management Services report?
While the report offers comprehensive insights, it's advisable to review the specific contents or supplementary materials provided to ascertain if additional resources or data are available.
14. How can I stay updated on further developments or reports in the Sand Management Services?
To stay informed about further developments, trends, and reports in the Sand Management Services, consider subscribing to industry newsletters, following relevant companies and organizations, or regularly checking reputable industry news sources and publications.
Methodology
Step 1 - Identification of Relevant Samples Size from Population Database


Step 2 - Approaches for Defining Global Market Size (Value, Volume* & Price*)

Note*: In applicable scenarios
Step 3 - Data Sources
Primary Research
- Web Analytics
- Survey Reports
- Research Institute
- Latest Research Reports
- Opinion Leaders
Secondary Research
- Annual Reports
- White Paper
- Latest Press Release
- Industry Association
- Paid Database
- Investor Presentations

Step 4 - Data Triangulation
Involves using different sources of information in order to increase the validity of a study
These sources are likely to be stakeholders in a program - participants, other researchers, program staff, other community members, and so on.
Then we put all data in single framework & apply various statistical tools to find out the dynamic on the market.
During the analysis stage, feedback from the stakeholder groups would be compared to determine areas of agreement as well as areas of divergence