

Key Insights
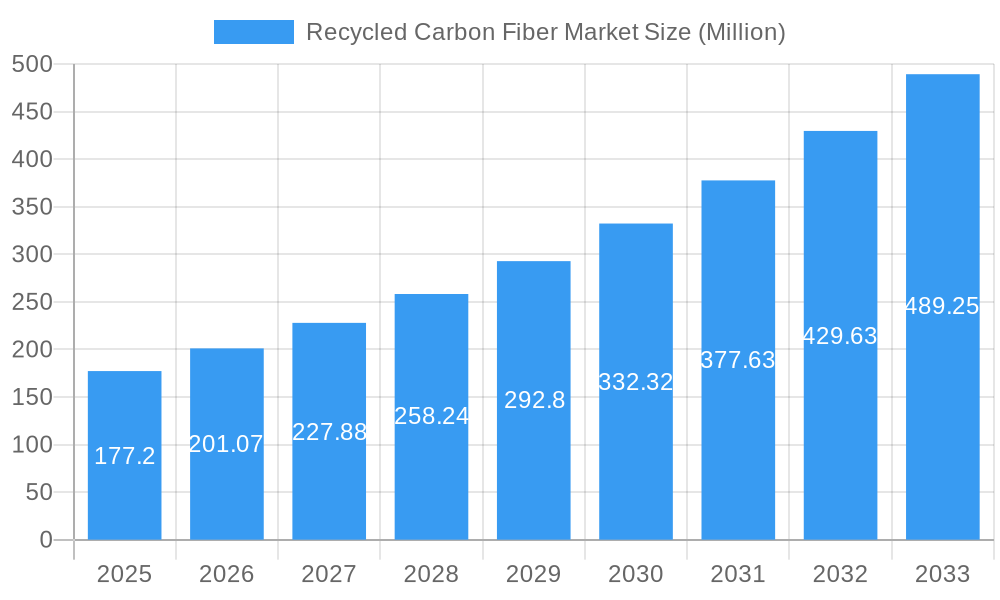
The global recycled carbon fiber market is experiencing robust growth, projected to reach \$177.20 million in 2025 and expand at a compound annual growth rate (CAGR) of 13.65% from 2025 to 2033. This expansion is driven by several key factors. The increasing demand for sustainable materials across various industries, particularly automotive, aerospace, and wind energy, is a major catalyst. These sectors are actively seeking alternatives to virgin carbon fiber to reduce their environmental footprint and production costs. Furthermore, advancements in recycling technologies are improving the quality and efficiency of recycled carbon fiber production, making it a more viable and competitive option. The growing awareness of the environmental impact of carbon fiber production and disposal is also fueling the market's growth. Government regulations and initiatives promoting sustainable practices further contribute to this trend. Different types of recycled carbon fiber, such as chopped and milled, cater to diverse applications, expanding the market's potential. The source of the recycled fiber, whether automotive, aerospace scrap, or other sources, also influences market dynamics, reflecting the diverse waste streams available for recycling.
Recycled Carbon Fiber Market Market Size (In Million)
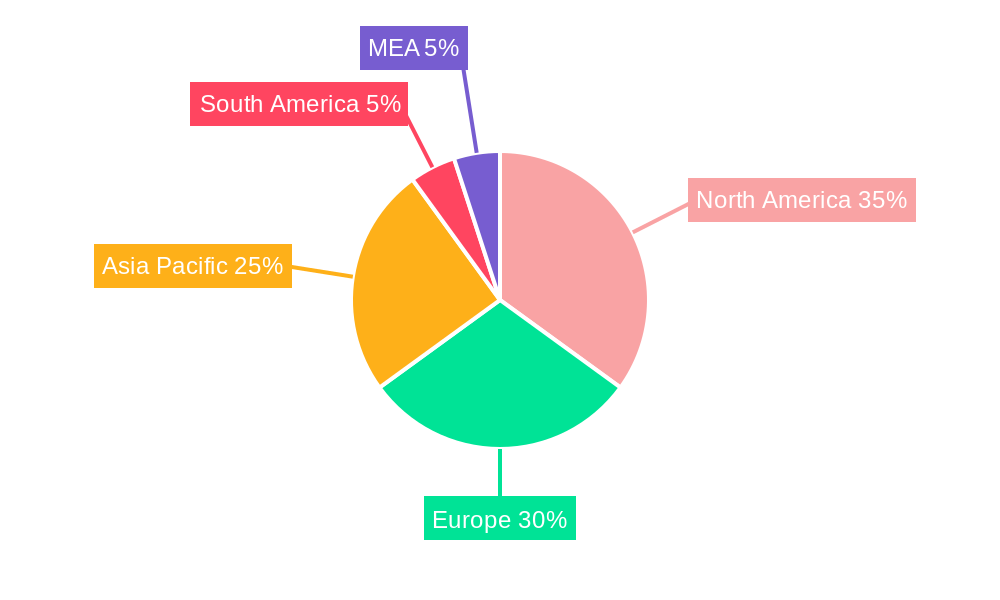
The market segmentation highlights the significant contributions of various end-user industries. The automotive sector, with its increasing focus on lightweighting and fuel efficiency, represents a substantial market segment. Similarly, the aerospace and defense industry, demanding high-performance materials, presents a significant opportunity for recycled carbon fiber. The wind energy sector's growth is further bolstering demand, as is the increasing use of carbon fiber in sporting goods and other specialized applications. Geographically, North America and Europe are currently leading the market, driven by established recycling infrastructure and strong environmental regulations. However, the Asia-Pacific region is poised for significant growth, fueled by increasing manufacturing activities and a rising focus on sustainability within the region. The competitive landscape is comprised of both established players and emerging companies, fostering innovation and driving market expansion. Companies are investing heavily in R&D to enhance recycling technologies and develop high-quality recycled carbon fiber products.
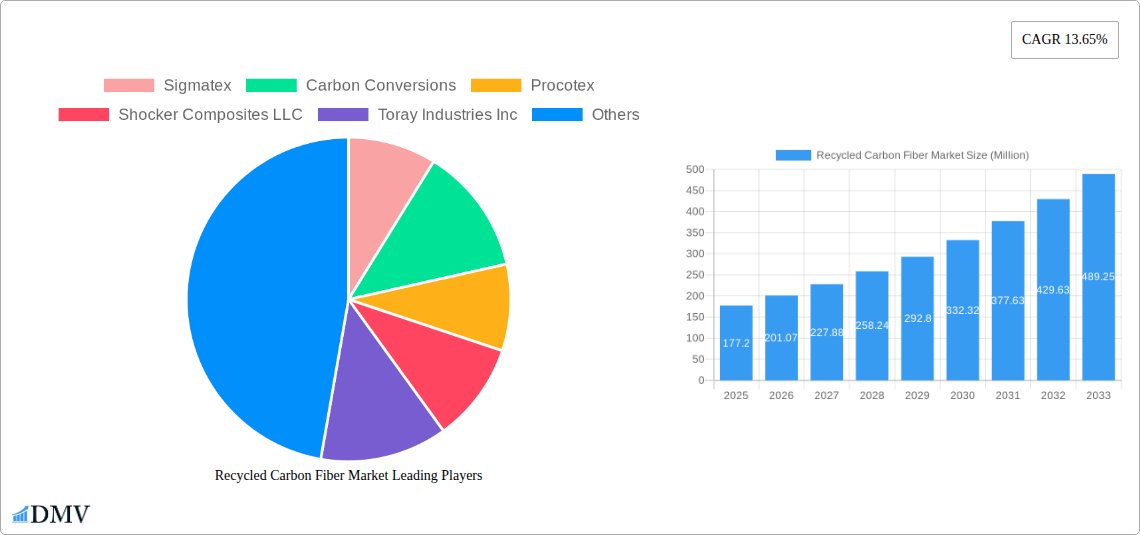
Recycled Carbon Fiber Market Company Market Share
Recycled Carbon Fiber Market: A Comprehensive Report (2019-2033)
This insightful report provides a comprehensive analysis of the Recycled Carbon Fiber market, offering a detailed examination of market trends, leading players, and future growth opportunities. From market size projections to key industry developments, this report is an indispensable resource for stakeholders seeking to navigate this dynamic and rapidly evolving sector. The study period covers 2019-2033, with 2025 serving as the base and estimated year. The forecast period is 2025-2033, and the historical period analyzed is 2019-2024. The market is valued at xx Million in 2025 and is projected to reach xx Million by 2033.
Recycled Carbon Fiber Market Market Composition & Trends
This section delves into the intricate composition of the recycled carbon fiber market, unveiling key trends shaping its trajectory. We analyze market concentration, revealing the market share distribution among key players like Sigmatex, Carbon Conversions, Procotex, Shocker Composites LLC, Toray Industries Inc, Alpha Recyclage Composites, Carbon Fiber Remanufacturing, Carbon Fiber Recycling, Mitsubishi Chemical Holdings Corporation, Gen 2 Carbon Limited, Vartega Inc, Karborek RCF (list not exhaustive). The report also examines innovation catalysts, such as advancements in recycling technologies and the increasing demand for sustainable materials. A detailed analysis of the regulatory landscape, including environmental regulations and government incentives, is provided. Furthermore, we explore the impact of substitute products and end-user profiles on market dynamics. Finally, the report assesses the impact of mergers and acquisitions (M&A) activities, including deal values and their influence on market consolidation.
- Market Share Distribution: [Insert data on market share distribution among major players. Example: Sigmatex holds approximately X% market share, followed by Toray Industries Inc. with Y% etc.]
- M&A Activity: [Insert data on notable M&A activities in the market, including deal values. Example: In 2023, a merger between Company A and Company B valued at Z Million USD significantly impacted the market structure.]
- Innovation Catalysts: Advancements in chemical recycling and mechanical recycling processes are driving innovation.
- Regulatory Landscape: Government policies promoting sustainable materials and reducing carbon emissions are shaping market growth.
Recycled Carbon Fiber Market Industry Evolution
This section provides a detailed analysis of the recycled carbon fiber market's evolutionary journey, charting its growth trajectory, technological advancements, and shifting consumer demands. We examine historical growth rates and project future adoption metrics. The report showcases the transition from primarily mechanical recycling to more efficient and cost-effective chemical recycling methods. The growing adoption of recycled carbon fiber across various industries, fueled by sustainability concerns and cost benefits, is meticulously documented. Analysis of technological advancements, including improvements in fiber quality and processing techniques, are detailed, along with projections of market growth rates for the forecast period.
- Growth Trajectories: [Insert data on historical and projected growth rates. Example: The market experienced an X% CAGR between 2019 and 2024 and is projected to grow at Y% CAGR from 2025 to 2033.]
- Technological Advancements: [Describe key advancements, such as improved recycling techniques leading to higher-quality recycled fiber.]
- Consumer Demand Shifts: Growing awareness of sustainability and the rising demand for eco-friendly materials are significantly impacting the market.
Leading Regions, Countries, or Segments in Recycled Carbon Fiber Market
This section identifies the dominant regions, countries, and segments within the recycled carbon fiber market, providing a detailed breakdown by type (Chopped Recycled Carbon Fiber, Milled Recycled Carbon Fiber), source (Automotive Scrap, Aerospace Scrap, Other Sources), and end-user industry (Automotive, Aerospace and Defense, Wind Energy, Sporting Goods, Other End-user Industries). Key drivers, including investment trends, regulatory support, and technological advancements, are analyzed. The report highlights regions experiencing the fastest growth and explains the factors contributing to their dominance.
- Dominant Regions: [Identify leading regions and countries and explain why (e.g., strong automotive industries, government support). Example: North America leads due to strong automotive sector and government initiatives.]
- Dominant Segments: [Identify leading segments by type and end-user industry and explain why (e.g., high demand from automotive industry for chopped fiber).]
- Key Drivers:
- Investment Trends: [Describe investment trends in specific regions or segments.]
- Regulatory Support: [Discuss the role of government policies and regulations.]
Recycled Carbon Fiber Market Product Innovations
This section showcases recent product innovations and applications in the recycled carbon fiber market. We highlight unique selling propositions (USPs) and technological advancements that improve fiber quality, performance characteristics, and cost-effectiveness. The report analyzes the performance metrics of various recycled carbon fiber products, comparing them to virgin carbon fiber alternatives. Discussion will cover the emergence of new applications and the expanding range of products utilizing recycled carbon fiber.
Propelling Factors for Recycled Carbon Fiber Market Growth
Several factors are driving the growth of the recycled carbon fiber market. These include increasing environmental regulations aimed at reducing waste and promoting sustainable practices. The rising cost of virgin carbon fiber is also making recycled alternatives more attractive. Technological advancements in recycling processes, leading to higher-quality recycled fibers, further accelerate market expansion. The growing demand for lightweight materials in various industries, particularly automotive and aerospace, is another significant driver.
Obstacles in the Recycled Carbon Fiber Market
Despite significant growth potential, the recycled carbon fiber market faces several challenges. Inconsistencies in the quality of recycled fibers compared to virgin fibers remain a concern. The establishment of a robust and efficient supply chain for recycled carbon fiber is crucial but faces obstacles. Competition from virgin carbon fiber and other composite materials also presents a significant challenge. Furthermore, regulatory hurdles and a lack of standardized testing procedures can create barriers to market entry and growth.
Future Opportunities in Recycled Carbon Fiber Market
The recycled carbon fiber market holds substantial promise for future growth. Emerging applications in areas like construction, energy storage, and consumer electronics present significant opportunities. Advancements in recycling technologies will lead to improved fiber quality and reduced costs. Further development of standardized testing procedures and the creation of a reliable supply chain will unlock additional market potential. Growing awareness of sustainability and increased consumer demand for eco-friendly materials are additional factors that will shape future growth.
Major Players in the Recycled Carbon Fiber Market Ecosystem
- Sigmatex
- Carbon Conversions
- Procotex
- Shocker Composites LLC
- Toray Industries Inc
- Alpha Recyclage Composites
- Carbon Fiber Remanufacturing
- Carbon Fiber Recycling
- Mitsubishi Chemical Holdings Corporation
- Gen 2 Carbon Limited
- Vartega Inc
- Karborek RCF
Key Developments in Recycled Carbon Fiber Market Industry
- August 2022: Vartega announced the expansion of its 50,000-square-foot manufacturing facility with a planned capacity of 2,000 metric tons per year, representing a tenfold increase in production capacity. This significantly increases the market supply of recycled carbon fiber.
- May 2022: Gen 2 Carbon Limited established a strategic alliance with Deakin University to promote carbon fiber recycling in Australia, expanding its conversion capabilities and market reach. This strengthens the research and development efforts in the sector and facilitates market expansion in a new region.
Strategic Recycled Carbon Fiber Market Market Forecast
The recycled carbon fiber market is poised for robust growth, driven by increasing demand for sustainable materials, technological advancements in recycling processes, and supportive government policies. The expansion of production capacities by key players like Vartega signals a significant shift in market dynamics. Continued innovation in recycling technologies and the exploration of new applications will further fuel market expansion in the coming years. The market is projected to experience substantial growth, driven by the factors discussed above, creating significant opportunities for market participants.
Recycled Carbon Fiber Market Segmentation
-
1. Type
- 1.1. Chopped Recycled Carbon Fiber
- 1.2. Milled Recycled Carbon Fiber
-
2. Source
- 2.1. Automotive Scrap
- 2.2. Aerospace Scrap
- 2.3. Other Sources
-
3. End-user Industry
- 3.1. Automotive
- 3.2. Aerospace and Defense
- 3.3. Wind Energy
- 3.4. Sporting Goods
- 3.5. Other End-user Industries
Recycled Carbon Fiber Market Segmentation By Geography
-
1. Asia Pacific
- 1.1. China
- 1.2. India
- 1.3. Japan
- 1.4. South Korea
- 1.5. Rest of Asia Pacific
-
2. North America
- 2.1. United States
- 2.2. Canada
- 2.3. Mexico
-
3. Europe
- 3.1. Germany
- 3.2. United Kingdom
- 3.3. Italy
- 3.4. France
- 3.5. Rest of Europe
-
4. Rest of the World
- 4.1. South America
- 4.2. Middle East and Africa
Recycled Carbon Fiber Market Regional Market Share
Geographic Coverage of Recycled Carbon Fiber Market
Recycled Carbon Fiber Market REPORT HIGHLIGHTS
| Aspects | Details |
|---|---|
| Study Period | 2020-2034 |
| Base Year | 2025 |
| Estimated Year | 2026 |
| Forecast Period | 2026-2034 |
| Historical Period | 2020-2025 |
| Growth Rate | CAGR of 13.65% from 2020-2034 |
| Segmentation |
|
Table of Contents
- 1. Introduction
- 1.1. Research Scope
- 1.2. Market Segmentation
- 1.3. Research Objective
- 1.4. Definitions and Assumptions
- 2. Executive Summary
- 2.1. Market Snapshot
- 3. Market Dynamics
- 3.1. Market Drivers
- 3.2. Market Restrains
- 3.3. Market Trends
- 3.4. Market Opportunities
- 4. Market Factor Analysis
- 4.1. Porters Five Forces
- 4.1.1. Bargaining Power of Suppliers
- 4.1.2. Bargaining Power of Buyers
- 4.1.3. Threat of New Entrants
- 4.1.4. Threat of Substitutes
- 4.1.5. Competitive Rivalry
- 4.2. PESTEL analysis
- 4.3. BCG Analysis
- 4.3.1. Stars (High Growth, High Market Share)
- 4.3.2. Cash Cows (Low Growth, High Market Share)
- 4.3.3. Question Mark (High Growth, Low Market Share)
- 4.3.4. Dogs (Low Growth, Low Market Share)
- 4.4. Ansoff Matrix Analysis
- 4.5. Supply Chain Analysis
- 4.6. Regulatory Landscape
- 4.7. Current Market Potential and Opportunity Assessment (TAM–SAM–SOM Framework)
- 4.8. DMV Analyst Note
- 4.1. Porters Five Forces
- 5. Market Analysis, Insights and Forecast 2021-2033
- 5.1. Market Analysis, Insights and Forecast - by Type
- 5.1.1. Chopped Recycled Carbon Fiber
- 5.1.2. Milled Recycled Carbon Fiber
- 5.2. Market Analysis, Insights and Forecast - by Source
- 5.2.1. Automotive Scrap
- 5.2.2. Aerospace Scrap
- 5.2.3. Other Sources
- 5.3. Market Analysis, Insights and Forecast - by End-user Industry
- 5.3.1. Automotive
- 5.3.2. Aerospace and Defense
- 5.3.3. Wind Energy
- 5.3.4. Sporting Goods
- 5.3.5. Other End-user Industries
- 5.4. Market Analysis, Insights and Forecast - by Region
- 5.4.1. Asia Pacific
- 5.4.2. North America
- 5.4.3. Europe
- 5.4.4. Rest of the World
- 5.1. Market Analysis, Insights and Forecast - by Type
- 6. Global Recycled Carbon Fiber Market Analysis, Insights and Forecast, 2021-2033
- 6.1. Market Analysis, Insights and Forecast - by Type
- 6.1.1. Chopped Recycled Carbon Fiber
- 6.1.2. Milled Recycled Carbon Fiber
- 6.2. Market Analysis, Insights and Forecast - by Source
- 6.2.1. Automotive Scrap
- 6.2.2. Aerospace Scrap
- 6.2.3. Other Sources
- 6.3. Market Analysis, Insights and Forecast - by End-user Industry
- 6.3.1. Automotive
- 6.3.2. Aerospace and Defense
- 6.3.3. Wind Energy
- 6.3.4. Sporting Goods
- 6.3.5. Other End-user Industries
- 6.1. Market Analysis, Insights and Forecast - by Type
- 7. Asia Pacific Recycled Carbon Fiber Market Analysis, Insights and Forecast, 2020-2032
- 7.1. Market Analysis, Insights and Forecast - by Type
- 7.1.1. Chopped Recycled Carbon Fiber
- 7.1.2. Milled Recycled Carbon Fiber
- 7.2. Market Analysis, Insights and Forecast - by Source
- 7.2.1. Automotive Scrap
- 7.2.2. Aerospace Scrap
- 7.2.3. Other Sources
- 7.3. Market Analysis, Insights and Forecast - by End-user Industry
- 7.3.1. Automotive
- 7.3.2. Aerospace and Defense
- 7.3.3. Wind Energy
- 7.3.4. Sporting Goods
- 7.3.5. Other End-user Industries
- 7.1. Market Analysis, Insights and Forecast - by Type
- 8. North America Recycled Carbon Fiber Market Analysis, Insights and Forecast, 2020-2032
- 8.1. Market Analysis, Insights and Forecast - by Type
- 8.1.1. Chopped Recycled Carbon Fiber
- 8.1.2. Milled Recycled Carbon Fiber
- 8.2. Market Analysis, Insights and Forecast - by Source
- 8.2.1. Automotive Scrap
- 8.2.2. Aerospace Scrap
- 8.2.3. Other Sources
- 8.3. Market Analysis, Insights and Forecast - by End-user Industry
- 8.3.1. Automotive
- 8.3.2. Aerospace and Defense
- 8.3.3. Wind Energy
- 8.3.4. Sporting Goods
- 8.3.5. Other End-user Industries
- 8.1. Market Analysis, Insights and Forecast - by Type
- 9. Europe Recycled Carbon Fiber Market Analysis, Insights and Forecast, 2020-2032
- 9.1. Market Analysis, Insights and Forecast - by Type
- 9.1.1. Chopped Recycled Carbon Fiber
- 9.1.2. Milled Recycled Carbon Fiber
- 9.2. Market Analysis, Insights and Forecast - by Source
- 9.2.1. Automotive Scrap
- 9.2.2. Aerospace Scrap
- 9.2.3. Other Sources
- 9.3. Market Analysis, Insights and Forecast - by End-user Industry
- 9.3.1. Automotive
- 9.3.2. Aerospace and Defense
- 9.3.3. Wind Energy
- 9.3.4. Sporting Goods
- 9.3.5. Other End-user Industries
- 9.1. Market Analysis, Insights and Forecast - by Type
- 10. Rest of the World Recycled Carbon Fiber Market Analysis, Insights and Forecast, 2020-2032
- 10.1. Market Analysis, Insights and Forecast - by Type
- 10.1.1. Chopped Recycled Carbon Fiber
- 10.1.2. Milled Recycled Carbon Fiber
- 10.2. Market Analysis, Insights and Forecast - by Source
- 10.2.1. Automotive Scrap
- 10.2.2. Aerospace Scrap
- 10.2.3. Other Sources
- 10.3. Market Analysis, Insights and Forecast - by End-user Industry
- 10.3.1. Automotive
- 10.3.2. Aerospace and Defense
- 10.3.3. Wind Energy
- 10.3.4. Sporting Goods
- 10.3.5. Other End-user Industries
- 10.1. Market Analysis, Insights and Forecast - by Type
- 11. Competitive Analysis
- 11.1. Company Profiles
- 11.1.1 Sigmatex
- 11.1.1.1. Company Overview
- 11.1.1.2. Products
- 11.1.1.3. Company Financials
- 11.1.1.4. SWOT Analysis
- 11.1.2 Carbon Conversions
- 11.1.2.1. Company Overview
- 11.1.2.2. Products
- 11.1.2.3. Company Financials
- 11.1.2.4. SWOT Analysis
- 11.1.3 Procotex
- 11.1.3.1. Company Overview
- 11.1.3.2. Products
- 11.1.3.3. Company Financials
- 11.1.3.4. SWOT Analysis
- 11.1.4 Shocker Composites LLC
- 11.1.4.1. Company Overview
- 11.1.4.2. Products
- 11.1.4.3. Company Financials
- 11.1.4.4. SWOT Analysis
- 11.1.5 Toray Industries Inc
- 11.1.5.1. Company Overview
- 11.1.5.2. Products
- 11.1.5.3. Company Financials
- 11.1.5.4. SWOT Analysis
- 11.1.6 Alpha Recyclage Composites
- 11.1.6.1. Company Overview
- 11.1.6.2. Products
- 11.1.6.3. Company Financials
- 11.1.6.4. SWOT Analysis
- 11.1.7 Carbon Fiber Remanufacturing
- 11.1.7.1. Company Overview
- 11.1.7.2. Products
- 11.1.7.3. Company Financials
- 11.1.7.4. SWOT Analysis
- 11.1.8 Carbon Fiber Recycling
- 11.1.8.1. Company Overview
- 11.1.8.2. Products
- 11.1.8.3. Company Financials
- 11.1.8.4. SWOT Analysis
- 11.1.9 Mitsubishi Chemical Holdings Corporation
- 11.1.9.1. Company Overview
- 11.1.9.2. Products
- 11.1.9.3. Company Financials
- 11.1.9.4. SWOT Analysis
- 11.1.10 Gen 2 Carbon Limited
- 11.1.10.1. Company Overview
- 11.1.10.2. Products
- 11.1.10.3. Company Financials
- 11.1.10.4. SWOT Analysis
- 11.1.11 Vartega Inc *List Not Exhaustive
- 11.1.11.1. Company Overview
- 11.1.11.2. Products
- 11.1.11.3. Company Financials
- 11.1.11.4. SWOT Analysis
- 11.1.12 Karborek RCF
- 11.1.12.1. Company Overview
- 11.1.12.2. Products
- 11.1.12.3. Company Financials
- 11.1.12.4. SWOT Analysis
- 11.1.1 Sigmatex
- 11.2. Market Entropy
- 11.2.1 Company's Key Areas Served
- 11.2.2 Recent Developments
- 11.3. Company Market Share Analysis 2025
- 11.3.1 Top 5 Companies Market Share Analysis
- 11.3.2 Top 3 Companies Market Share Analysis
- 11.4. List of Potential Customers
- 12. Research Methodology
List of Figures
- Figure 1: Global Recycled Carbon Fiber Market Revenue Breakdown (Million, %) by Region 2025 & 2033
- Figure 2: Global Recycled Carbon Fiber Market Volume Breakdown (K Tons, %) by Region 2025 & 2033
- Figure 3: Asia Pacific Recycled Carbon Fiber Market Revenue (Million), by Type 2025 & 2033
- Figure 4: Asia Pacific Recycled Carbon Fiber Market Volume (K Tons), by Type 2025 & 2033
- Figure 5: Asia Pacific Recycled Carbon Fiber Market Revenue Share (%), by Type 2025 & 2033
- Figure 6: Asia Pacific Recycled Carbon Fiber Market Volume Share (%), by Type 2025 & 2033
- Figure 7: Asia Pacific Recycled Carbon Fiber Market Revenue (Million), by Source 2025 & 2033
- Figure 8: Asia Pacific Recycled Carbon Fiber Market Volume (K Tons), by Source 2025 & 2033
- Figure 9: Asia Pacific Recycled Carbon Fiber Market Revenue Share (%), by Source 2025 & 2033
- Figure 10: Asia Pacific Recycled Carbon Fiber Market Volume Share (%), by Source 2025 & 2033
- Figure 11: Asia Pacific Recycled Carbon Fiber Market Revenue (Million), by End-user Industry 2025 & 2033
- Figure 12: Asia Pacific Recycled Carbon Fiber Market Volume (K Tons), by End-user Industry 2025 & 2033
- Figure 13: Asia Pacific Recycled Carbon Fiber Market Revenue Share (%), by End-user Industry 2025 & 2033
- Figure 14: Asia Pacific Recycled Carbon Fiber Market Volume Share (%), by End-user Industry 2025 & 2033
- Figure 15: Asia Pacific Recycled Carbon Fiber Market Revenue (Million), by Country 2025 & 2033
- Figure 16: Asia Pacific Recycled Carbon Fiber Market Volume (K Tons), by Country 2025 & 2033
- Figure 17: Asia Pacific Recycled Carbon Fiber Market Revenue Share (%), by Country 2025 & 2033
- Figure 18: Asia Pacific Recycled Carbon Fiber Market Volume Share (%), by Country 2025 & 2033
- Figure 19: North America Recycled Carbon Fiber Market Revenue (Million), by Type 2025 & 2033
- Figure 20: North America Recycled Carbon Fiber Market Volume (K Tons), by Type 2025 & 2033
- Figure 21: North America Recycled Carbon Fiber Market Revenue Share (%), by Type 2025 & 2033
- Figure 22: North America Recycled Carbon Fiber Market Volume Share (%), by Type 2025 & 2033
- Figure 23: North America Recycled Carbon Fiber Market Revenue (Million), by Source 2025 & 2033
- Figure 24: North America Recycled Carbon Fiber Market Volume (K Tons), by Source 2025 & 2033
- Figure 25: North America Recycled Carbon Fiber Market Revenue Share (%), by Source 2025 & 2033
- Figure 26: North America Recycled Carbon Fiber Market Volume Share (%), by Source 2025 & 2033
- Figure 27: North America Recycled Carbon Fiber Market Revenue (Million), by End-user Industry 2025 & 2033
- Figure 28: North America Recycled Carbon Fiber Market Volume (K Tons), by End-user Industry 2025 & 2033
- Figure 29: North America Recycled Carbon Fiber Market Revenue Share (%), by End-user Industry 2025 & 2033
- Figure 30: North America Recycled Carbon Fiber Market Volume Share (%), by End-user Industry 2025 & 2033
- Figure 31: North America Recycled Carbon Fiber Market Revenue (Million), by Country 2025 & 2033
- Figure 32: North America Recycled Carbon Fiber Market Volume (K Tons), by Country 2025 & 2033
- Figure 33: North America Recycled Carbon Fiber Market Revenue Share (%), by Country 2025 & 2033
- Figure 34: North America Recycled Carbon Fiber Market Volume Share (%), by Country 2025 & 2033
- Figure 35: Europe Recycled Carbon Fiber Market Revenue (Million), by Type 2025 & 2033
- Figure 36: Europe Recycled Carbon Fiber Market Volume (K Tons), by Type 2025 & 2033
- Figure 37: Europe Recycled Carbon Fiber Market Revenue Share (%), by Type 2025 & 2033
- Figure 38: Europe Recycled Carbon Fiber Market Volume Share (%), by Type 2025 & 2033
- Figure 39: Europe Recycled Carbon Fiber Market Revenue (Million), by Source 2025 & 2033
- Figure 40: Europe Recycled Carbon Fiber Market Volume (K Tons), by Source 2025 & 2033
- Figure 41: Europe Recycled Carbon Fiber Market Revenue Share (%), by Source 2025 & 2033
- Figure 42: Europe Recycled Carbon Fiber Market Volume Share (%), by Source 2025 & 2033
- Figure 43: Europe Recycled Carbon Fiber Market Revenue (Million), by End-user Industry 2025 & 2033
- Figure 44: Europe Recycled Carbon Fiber Market Volume (K Tons), by End-user Industry 2025 & 2033
- Figure 45: Europe Recycled Carbon Fiber Market Revenue Share (%), by End-user Industry 2025 & 2033
- Figure 46: Europe Recycled Carbon Fiber Market Volume Share (%), by End-user Industry 2025 & 2033
- Figure 47: Europe Recycled Carbon Fiber Market Revenue (Million), by Country 2025 & 2033
- Figure 48: Europe Recycled Carbon Fiber Market Volume (K Tons), by Country 2025 & 2033
- Figure 49: Europe Recycled Carbon Fiber Market Revenue Share (%), by Country 2025 & 2033
- Figure 50: Europe Recycled Carbon Fiber Market Volume Share (%), by Country 2025 & 2033
- Figure 51: Rest of the World Recycled Carbon Fiber Market Revenue (Million), by Type 2025 & 2033
- Figure 52: Rest of the World Recycled Carbon Fiber Market Volume (K Tons), by Type 2025 & 2033
- Figure 53: Rest of the World Recycled Carbon Fiber Market Revenue Share (%), by Type 2025 & 2033
- Figure 54: Rest of the World Recycled Carbon Fiber Market Volume Share (%), by Type 2025 & 2033
- Figure 55: Rest of the World Recycled Carbon Fiber Market Revenue (Million), by Source 2025 & 2033
- Figure 56: Rest of the World Recycled Carbon Fiber Market Volume (K Tons), by Source 2025 & 2033
- Figure 57: Rest of the World Recycled Carbon Fiber Market Revenue Share (%), by Source 2025 & 2033
- Figure 58: Rest of the World Recycled Carbon Fiber Market Volume Share (%), by Source 2025 & 2033
- Figure 59: Rest of the World Recycled Carbon Fiber Market Revenue (Million), by End-user Industry 2025 & 2033
- Figure 60: Rest of the World Recycled Carbon Fiber Market Volume (K Tons), by End-user Industry 2025 & 2033
- Figure 61: Rest of the World Recycled Carbon Fiber Market Revenue Share (%), by End-user Industry 2025 & 2033
- Figure 62: Rest of the World Recycled Carbon Fiber Market Volume Share (%), by End-user Industry 2025 & 2033
- Figure 63: Rest of the World Recycled Carbon Fiber Market Revenue (Million), by Country 2025 & 2033
- Figure 64: Rest of the World Recycled Carbon Fiber Market Volume (K Tons), by Country 2025 & 2033
- Figure 65: Rest of the World Recycled Carbon Fiber Market Revenue Share (%), by Country 2025 & 2033
- Figure 66: Rest of the World Recycled Carbon Fiber Market Volume Share (%), by Country 2025 & 2033
List of Tables
- Table 1: Global Recycled Carbon Fiber Market Revenue Million Forecast, by Type 2020 & 2033
- Table 2: Global Recycled Carbon Fiber Market Volume K Tons Forecast, by Type 2020 & 2033
- Table 3: Global Recycled Carbon Fiber Market Revenue Million Forecast, by Source 2020 & 2033
- Table 4: Global Recycled Carbon Fiber Market Volume K Tons Forecast, by Source 2020 & 2033
- Table 5: Global Recycled Carbon Fiber Market Revenue Million Forecast, by End-user Industry 2020 & 2033
- Table 6: Global Recycled Carbon Fiber Market Volume K Tons Forecast, by End-user Industry 2020 & 2033
- Table 7: Global Recycled Carbon Fiber Market Revenue Million Forecast, by Region 2020 & 2033
- Table 8: Global Recycled Carbon Fiber Market Volume K Tons Forecast, by Region 2020 & 2033
- Table 9: Global Recycled Carbon Fiber Market Revenue Million Forecast, by Type 2020 & 2033
- Table 10: Global Recycled Carbon Fiber Market Volume K Tons Forecast, by Type 2020 & 2033
- Table 11: Global Recycled Carbon Fiber Market Revenue Million Forecast, by Source 2020 & 2033
- Table 12: Global Recycled Carbon Fiber Market Volume K Tons Forecast, by Source 2020 & 2033
- Table 13: Global Recycled Carbon Fiber Market Revenue Million Forecast, by End-user Industry 2020 & 2033
- Table 14: Global Recycled Carbon Fiber Market Volume K Tons Forecast, by End-user Industry 2020 & 2033
- Table 15: Global Recycled Carbon Fiber Market Revenue Million Forecast, by Country 2020 & 2033
- Table 16: Global Recycled Carbon Fiber Market Volume K Tons Forecast, by Country 2020 & 2033
- Table 17: China Recycled Carbon Fiber Market Revenue (Million) Forecast, by Application 2020 & 2033
- Table 18: China Recycled Carbon Fiber Market Volume (K Tons) Forecast, by Application 2020 & 2033
- Table 19: India Recycled Carbon Fiber Market Revenue (Million) Forecast, by Application 2020 & 2033
- Table 20: India Recycled Carbon Fiber Market Volume (K Tons) Forecast, by Application 2020 & 2033
- Table 21: Japan Recycled Carbon Fiber Market Revenue (Million) Forecast, by Application 2020 & 2033
- Table 22: Japan Recycled Carbon Fiber Market Volume (K Tons) Forecast, by Application 2020 & 2033
- Table 23: South Korea Recycled Carbon Fiber Market Revenue (Million) Forecast, by Application 2020 & 2033
- Table 24: South Korea Recycled Carbon Fiber Market Volume (K Tons) Forecast, by Application 2020 & 2033
- Table 25: Rest of Asia Pacific Recycled Carbon Fiber Market Revenue (Million) Forecast, by Application 2020 & 2033
- Table 26: Rest of Asia Pacific Recycled Carbon Fiber Market Volume (K Tons) Forecast, by Application 2020 & 2033
- Table 27: Global Recycled Carbon Fiber Market Revenue Million Forecast, by Type 2020 & 2033
- Table 28: Global Recycled Carbon Fiber Market Volume K Tons Forecast, by Type 2020 & 2033
- Table 29: Global Recycled Carbon Fiber Market Revenue Million Forecast, by Source 2020 & 2033
- Table 30: Global Recycled Carbon Fiber Market Volume K Tons Forecast, by Source 2020 & 2033
- Table 31: Global Recycled Carbon Fiber Market Revenue Million Forecast, by End-user Industry 2020 & 2033
- Table 32: Global Recycled Carbon Fiber Market Volume K Tons Forecast, by End-user Industry 2020 & 2033
- Table 33: Global Recycled Carbon Fiber Market Revenue Million Forecast, by Country 2020 & 2033
- Table 34: Global Recycled Carbon Fiber Market Volume K Tons Forecast, by Country 2020 & 2033
- Table 35: United States Recycled Carbon Fiber Market Revenue (Million) Forecast, by Application 2020 & 2033
- Table 36: United States Recycled Carbon Fiber Market Volume (K Tons) Forecast, by Application 2020 & 2033
- Table 37: Canada Recycled Carbon Fiber Market Revenue (Million) Forecast, by Application 2020 & 2033
- Table 38: Canada Recycled Carbon Fiber Market Volume (K Tons) Forecast, by Application 2020 & 2033
- Table 39: Mexico Recycled Carbon Fiber Market Revenue (Million) Forecast, by Application 2020 & 2033
- Table 40: Mexico Recycled Carbon Fiber Market Volume (K Tons) Forecast, by Application 2020 & 2033
- Table 41: Global Recycled Carbon Fiber Market Revenue Million Forecast, by Type 2020 & 2033
- Table 42: Global Recycled Carbon Fiber Market Volume K Tons Forecast, by Type 2020 & 2033
- Table 43: Global Recycled Carbon Fiber Market Revenue Million Forecast, by Source 2020 & 2033
- Table 44: Global Recycled Carbon Fiber Market Volume K Tons Forecast, by Source 2020 & 2033
- Table 45: Global Recycled Carbon Fiber Market Revenue Million Forecast, by End-user Industry 2020 & 2033
- Table 46: Global Recycled Carbon Fiber Market Volume K Tons Forecast, by End-user Industry 2020 & 2033
- Table 47: Global Recycled Carbon Fiber Market Revenue Million Forecast, by Country 2020 & 2033
- Table 48: Global Recycled Carbon Fiber Market Volume K Tons Forecast, by Country 2020 & 2033
- Table 49: Germany Recycled Carbon Fiber Market Revenue (Million) Forecast, by Application 2020 & 2033
- Table 50: Germany Recycled Carbon Fiber Market Volume (K Tons) Forecast, by Application 2020 & 2033
- Table 51: United Kingdom Recycled Carbon Fiber Market Revenue (Million) Forecast, by Application 2020 & 2033
- Table 52: United Kingdom Recycled Carbon Fiber Market Volume (K Tons) Forecast, by Application 2020 & 2033
- Table 53: Italy Recycled Carbon Fiber Market Revenue (Million) Forecast, by Application 2020 & 2033
- Table 54: Italy Recycled Carbon Fiber Market Volume (K Tons) Forecast, by Application 2020 & 2033
- Table 55: France Recycled Carbon Fiber Market Revenue (Million) Forecast, by Application 2020 & 2033
- Table 56: France Recycled Carbon Fiber Market Volume (K Tons) Forecast, by Application 2020 & 2033
- Table 57: Rest of Europe Recycled Carbon Fiber Market Revenue (Million) Forecast, by Application 2020 & 2033
- Table 58: Rest of Europe Recycled Carbon Fiber Market Volume (K Tons) Forecast, by Application 2020 & 2033
- Table 59: Global Recycled Carbon Fiber Market Revenue Million Forecast, by Type 2020 & 2033
- Table 60: Global Recycled Carbon Fiber Market Volume K Tons Forecast, by Type 2020 & 2033
- Table 61: Global Recycled Carbon Fiber Market Revenue Million Forecast, by Source 2020 & 2033
- Table 62: Global Recycled Carbon Fiber Market Volume K Tons Forecast, by Source 2020 & 2033
- Table 63: Global Recycled Carbon Fiber Market Revenue Million Forecast, by End-user Industry 2020 & 2033
- Table 64: Global Recycled Carbon Fiber Market Volume K Tons Forecast, by End-user Industry 2020 & 2033
- Table 65: Global Recycled Carbon Fiber Market Revenue Million Forecast, by Country 2020 & 2033
- Table 66: Global Recycled Carbon Fiber Market Volume K Tons Forecast, by Country 2020 & 2033
- Table 67: South America Recycled Carbon Fiber Market Revenue (Million) Forecast, by Application 2020 & 2033
- Table 68: South America Recycled Carbon Fiber Market Volume (K Tons) Forecast, by Application 2020 & 2033
- Table 69: Middle East and Africa Recycled Carbon Fiber Market Revenue (Million) Forecast, by Application 2020 & 2033
- Table 70: Middle East and Africa Recycled Carbon Fiber Market Volume (K Tons) Forecast, by Application 2020 & 2033
Frequently Asked Questions
1. What is the projected Compound Annual Growth Rate (CAGR) of the Recycled Carbon Fiber Market?
The projected CAGR is approximately 13.65%.
2. Which companies are prominent players in the Recycled Carbon Fiber Market?
Key companies in the market include Sigmatex, Carbon Conversions, Procotex, Shocker Composites LLC, Toray Industries Inc, Alpha Recyclage Composites, Carbon Fiber Remanufacturing, Carbon Fiber Recycling, Mitsubishi Chemical Holdings Corporation, Gen 2 Carbon Limited, Vartega Inc *List Not Exhaustive, Karborek RCF.
3. What are the main segments of the Recycled Carbon Fiber Market?
The market segments include Type, Source, End-user Industry.
4. Can you provide details about the market size?
The market size is estimated to be USD 177.20 Million as of 2022.
5. What are some drivers contributing to market growth?
Rising Demand For Lightweight Vehicles; Growing Carbon Fiber Scrap Recycling and its Reuse in the Wind Energy Sector; Cost Effectiveness of Recycled Carbon Fiber.
6. What are the notable trends driving market growth?
Increasing Usage in the Aerospace and Defense Industry.
7. Are there any restraints impacting market growth?
Availability of Various Substitutes; Supply Chain Security for Recycled Carbon Fiber.
8. Can you provide examples of recent developments in the market?
August 2022: Vartega announced the expansion of its 50,000-square-foot manufacturing facility with a planned capacity of 2,000 metric tons per year. The company has expanded its production capacity ten times more than the previous capacity.
9. What pricing options are available for accessing the report?
Pricing options include single-user, multi-user, and enterprise licenses priced at USD 4750, USD 5250, and USD 8750 respectively.
10. Is the market size provided in terms of value or volume?
The market size is provided in terms of value, measured in Million and volume, measured in K Tons.
11. Are there any specific market keywords associated with the report?
Yes, the market keyword associated with the report is "Recycled Carbon Fiber Market," which aids in identifying and referencing the specific market segment covered.
12. How do I determine which pricing option suits my needs best?
The pricing options vary based on user requirements and access needs. Individual users may opt for single-user licenses, while businesses requiring broader access may choose multi-user or enterprise licenses for cost-effective access to the report.
13. Are there any additional resources or data provided in the Recycled Carbon Fiber Market report?
While the report offers comprehensive insights, it's advisable to review the specific contents or supplementary materials provided to ascertain if additional resources or data are available.
14. How can I stay updated on further developments or reports in the Recycled Carbon Fiber Market?
To stay informed about further developments, trends, and reports in the Recycled Carbon Fiber Market, consider subscribing to industry newsletters, following relevant companies and organizations, or regularly checking reputable industry news sources and publications.
Methodology
Step 1 - Identification of Relevant Samples Size from Population Database


Step 2 - Approaches for Defining Global Market Size (Value, Volume* & Price*)

Note*: In applicable scenarios
Step 3 - Data Sources
Primary Research
- Web Analytics
- Survey Reports
- Research Institute
- Latest Research Reports
- Opinion Leaders
Secondary Research
- Annual Reports
- White Paper
- Latest Press Release
- Industry Association
- Paid Database
- Investor Presentations

Step 4 - Data Triangulation
Involves using different sources of information in order to increase the validity of a study
These sources are likely to be stakeholders in a program - participants, other researchers, program staff, other community members, and so on.
Then we put all data in single framework & apply various statistical tools to find out the dynamic on the market.
During the analysis stage, feedback from the stakeholder groups would be compared to determine areas of agreement as well as areas of divergence