

Key Insights
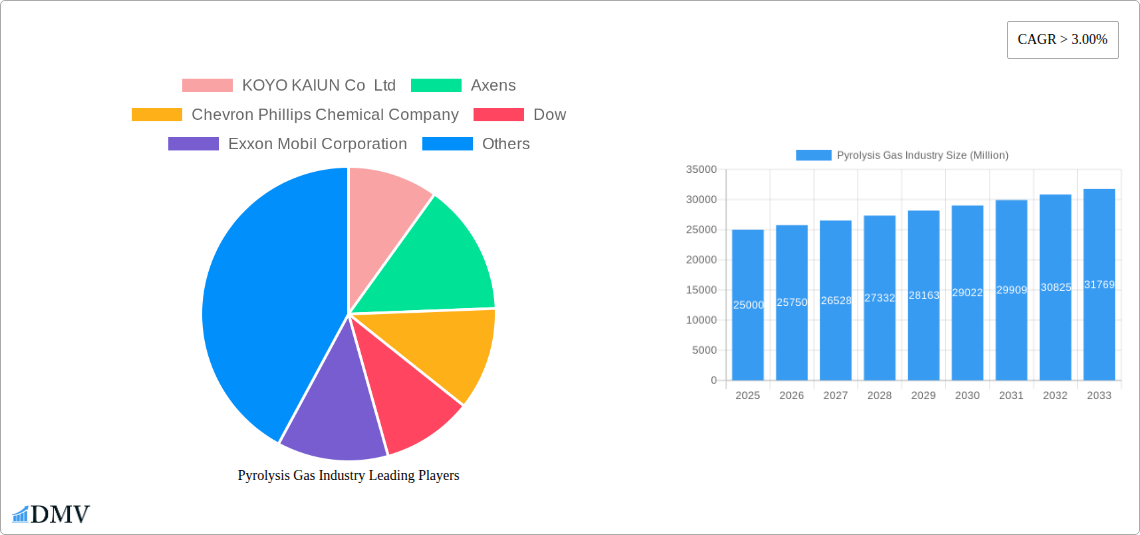
The pyrolysis gas industry is experiencing robust growth, driven by increasing demand for ethylene and propylene, key building blocks in the production of plastics, synthetic fibers, and other petrochemicals. The market's Compound Annual Growth Rate (CAGR) exceeding 3% indicates a sustained expansion, fueled by factors such as rising global population, increased consumption of plastic products, and advancements in pyrolysis technology leading to higher efficiency and reduced environmental impact. This growth is further supported by the ongoing shift towards circular economy models, promoting the recycling and upcycling of waste plastics through pyrolysis processes. Major players in the petrochemical and chemical industries, such as Dow, ExxonMobil, and SABIC, are actively investing in pyrolysis technology and expanding their production capacities, demonstrating strong market confidence. However, the industry faces challenges including fluctuating raw material prices (primarily waste plastics), stringent environmental regulations related to emissions, and the need for technological advancements to achieve optimal yield and energy efficiency. Despite these hurdles, the long-term outlook for the pyrolysis gas industry remains positive, with continued growth predicted throughout the forecast period (2025-2033).
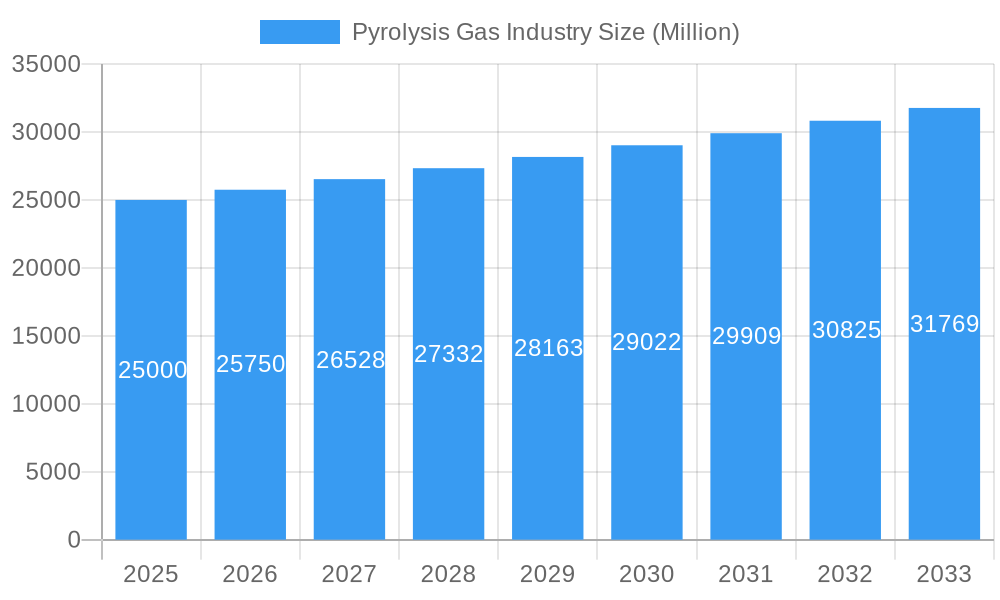
Pyrolysis Gas Industry Market Size (In Billion)
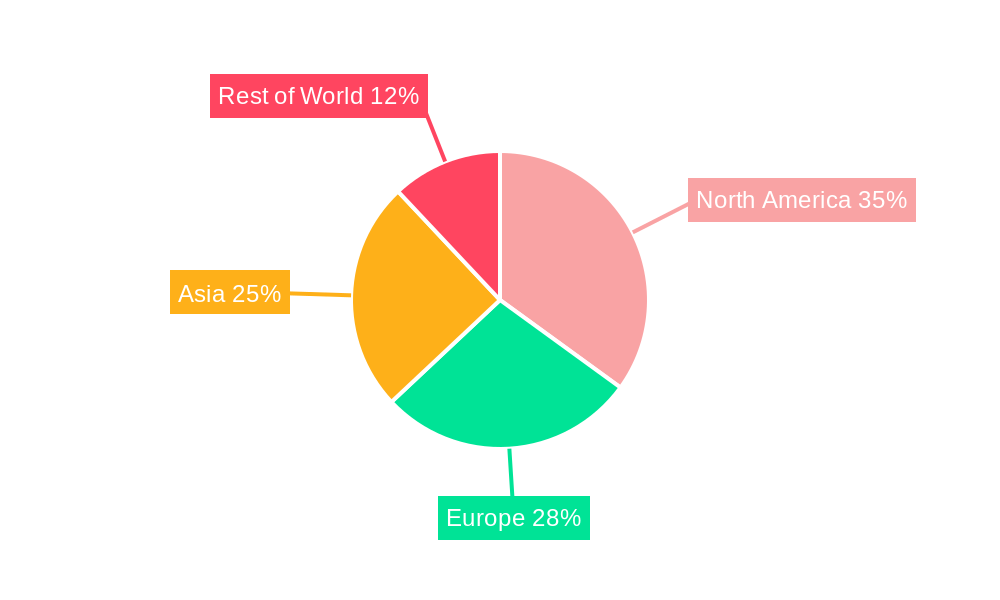
The geographic distribution of the pyrolysis gas market is likely diverse, with regions experiencing rapid industrialization and high plastic consumption showing higher growth rates. North America and Asia, particularly regions with established petrochemical infrastructures, are anticipated to maintain significant market shares. Europe, while facing stringent environmental regulations, is also expected to contribute significantly due to its focus on sustainable practices and waste management solutions. Technological advancements focusing on improving energy efficiency, reducing emissions, and enhancing the quality of pyrolysis gas products will be pivotal in shaping the market landscape. Furthermore, strategic partnerships and collaborations between industry players, technology providers, and waste management companies are expected to foster innovation and accelerate market growth. The integration of advanced analytics and data-driven approaches will be crucial in optimizing operations and managing the supply chain effectively.
Pyrolysis Gas Industry Company Market Share
Pyrolysis Gas Industry Market Report: 2019-2033
This comprehensive report provides an in-depth analysis of the Pyrolysis Gas industry, projecting a market value exceeding $XX Million by 2033. The study covers the historical period (2019-2024), base year (2025), and forecast period (2025-2033), offering crucial insights for stakeholders seeking to navigate this dynamic market. Key players such as KOYO KAIUN Co Ltd, Axens, Chevron Phillips Chemical Company, Dow, Exxon Mobil Corporation, Haldia Petrochemicals Limited, HIP-Petrohemija, Jam Petrochemical Company, ONGC Petro additions Limited, Ras Laffan Olefins Company Limited, SABIC, Shell, and Sud Chemie India Pvt Ltd are analyzed, though the list is not exhaustive.
Pyrolysis Gas Industry Market Composition & Trends
This section delves into the competitive landscape of the Pyrolysis Gas market, examining market concentration, innovation drivers, regulatory frameworks, substitute products, end-user profiles, and mergers & acquisitions (M&A) activity. The report utilizes a robust methodology to estimate market share distribution amongst key players, revealing the dominant players and emerging competitors. Analysis of M&A activity will include deal values exceeding $XX Million, identifying key strategic partnerships and their impact on market dynamics.
- Market Concentration: Analysis of the Herfindahl-Hirschman Index (HHI) to quantify market concentration.
- Innovation Catalysts: Identification of key technological advancements driving market innovation, including [Specific examples of technologies and their impact].
- Regulatory Landscape: Assessment of relevant regulations and their impact on market growth, including [Specific examples of regulations and their impact].
- Substitute Products: Examination of alternative products and their potential to impact market share.
- End-User Profiles: Detailed analysis of end-user segments and their consumption patterns.
- M&A Activity: Review of significant M&A transactions, including deal values and strategic implications. Examples include [mention specific deals and their impact on the market if available, otherwise state "Significant M&A activity observed across the forecast period"].
Pyrolysis Gas Industry Industry Evolution
This section provides a comprehensive overview of the Pyrolysis Gas industry's evolution, analyzing market growth trajectories, technological advancements, and evolving consumer demands. We examine historical growth rates, and project future growth based on detailed market segmentation and technological forecasting. The report uses a combination of primary and secondary data sources to accurately portray the industry's development. Specific data points on growth rates, adoption rates of new technologies, and changing consumer preferences will be provided, offering insights into the long-term trends shaping the industry. For example, the market is projected to grow at a CAGR of XX% during the forecast period, driven by factors such as [mention specific drivers].
Leading Regions, Countries, or Segments in Pyrolysis Gas Industry
This section identifies the dominant regions, countries, and segments within the Pyrolysis Gas industry. A detailed analysis of the leading region's dominance is provided, outlining the key contributing factors.
- Key Drivers for Leading Region/Segment:
- [Specific example: Favorable government policies and incentives, resulting in XX Million investment in capacity expansion.]
- [Specific example: High demand from key end-use industries like [specific industry], driving consumption to XX Million tons.]
- [Specific example: Established infrastructure and readily available raw materials, resulting in lower production costs.]
- In-depth Analysis of Dominance Factors: [Detailed explanation of how the factors above contribute to the dominance of the leading region/segment, potentially including competitive analysis and discussion of market access barriers.]
Pyrolysis Gas Industry Product Innovations
This section highlights recent product innovations, applications, and performance metrics. The report identifies key unique selling propositions (USPs) of leading products and analyzes the technological advancements contributing to improved efficiency and performance. For example, the introduction of [specific product innovation] has led to a XX% improvement in [specific performance metric].
Propelling Factors for Pyrolysis Gas Industry Growth
Several factors are driving growth in the Pyrolysis Gas industry. These include advancements in [specific technologies], increasing demand from [specific end-use sectors], and supportive government policies such as [mention specific policies]. The expanding global economy and increasing disposable incomes also contribute to the market's expansion.
Obstacles in the Pyrolysis Gas Industry Market
Despite significant growth potential, the Pyrolysis Gas industry faces challenges. These include stringent environmental regulations leading to increased compliance costs, supply chain disruptions impacting raw material availability, and intense competition impacting profit margins. Furthermore, volatility in raw material prices presents a significant obstacle to consistent profitability.
Future Opportunities in Pyrolysis Gas Industry
The Pyrolysis Gas market presents significant future opportunities. Emerging markets in [specific regions] represent considerable growth potential. Technological advancements, like [specific technology], will create new applications and drive market expansion. Moreover, changing consumer preferences toward sustainable and eco-friendly products will create demand for pyrolysis gas derived from recycled materials.
Major Players in the Pyrolysis Gas Industry Ecosystem
- KOYO KAIUN Co Ltd
- Axens
- Chevron Phillips Chemical Company
- Dow
- Exxon Mobil Corporation
- Haldia Petrochemicals Limited
- HIP-Petrohemija
- Jam Petrochemical Company
- ONGC Petro additions Limited
- Ras Laffan Olefins Company Limited
- SABIC
- Shell
- Sud Chemie India Pvt Ltd
- *List Not Exhaustive
Key Developments in Pyrolysis Gas Industry Industry
- [Month, Year]: [Specific Development and its impact. Example: Launch of new pyrolysis gas purification technology by Company X, leading to a 15% reduction in production costs.]
- [Month, Year]: [Specific Development and its impact]
- [Month, Year]: [Specific Development and its impact]
Strategic Pyrolysis Gas Industry Market Forecast
The future of the Pyrolysis Gas industry is promising. Continued technological innovation, growing demand from key sectors, and supportive government policies will drive market expansion. The market is projected to experience significant growth, driven by the factors outlined in this report, creating lucrative opportunities for existing players and new entrants alike. The market's expansion will be particularly strong in [specific geographic regions or segments] creating significant potential for investors and businesses within the industry.
Pyrolysis Gas Industry Segmentation
-
1. Type
- 1.1. Raw Pyrolysis Gasoline
- 1.2. Hydrogenated Pyrolysis Gasoline
-
2. Application
- 2.1. Benzene Processing
- 2.2. Aromatic Extraction
- 2.3. Feedstock of BTX Plant
- 2.4. Motor Fuels
- 2.5. Others
Pyrolysis Gas Industry Segmentation By Geography
-
1. Asia Pacific
- 1.1. China
- 1.2. India
- 1.3. Japan
- 1.4. South Korea
- 1.5. Rest of Asia Pacific
-
2. North America
- 2.1. United States
- 2.2. Canada
- 2.3. Mexico
-
3. Europe
- 3.1. Germany
- 3.2. United Kingdom
- 3.3. France
- 3.4. Italy
- 3.5. Rest of Europe
-
4. South America
- 4.1. Brazil
- 4.2. Argentina
- 4.3. Rest of South America
-
5. Middle East and Africa
- 5.1. Saudi Arabia
- 5.2. South Africa
- 5.3. Rest of Middle East and Africa
Pyrolysis Gas Industry Regional Market Share
Geographic Coverage of Pyrolysis Gas Industry
Pyrolysis Gas Industry REPORT HIGHLIGHTS
| Aspects | Details |
|---|---|
| Study Period | 2020-2034 |
| Base Year | 2025 |
| Estimated Year | 2026 |
| Forecast Period | 2026-2034 |
| Historical Period | 2020-2025 |
| Growth Rate | CAGR of > 3.00% from 2020-2034 |
| Segmentation |
|
Table of Contents
- 1. Introduction
- 1.1. Research Scope
- 1.2. Market Segmentation
- 1.3. Research Objective
- 1.4. Definitions and Assumptions
- 2. Executive Summary
- 2.1. Market Snapshot
- 3. Market Dynamics
- 3.1. Market Drivers
- 3.2. Market Restrains
- 3.3. Market Trends
- 3.4. Market Opportunities
- 4. Market Factor Analysis
- 4.1. Porters Five Forces
- 4.1.1. Bargaining Power of Suppliers
- 4.1.2. Bargaining Power of Buyers
- 4.1.3. Threat of New Entrants
- 4.1.4. Threat of Substitutes
- 4.1.5. Competitive Rivalry
- 4.2. PESTEL analysis
- 4.3. BCG Analysis
- 4.3.1. Stars (High Growth, High Market Share)
- 4.3.2. Cash Cows (Low Growth, High Market Share)
- 4.3.3. Question Mark (High Growth, Low Market Share)
- 4.3.4. Dogs (Low Growth, Low Market Share)
- 4.4. Ansoff Matrix Analysis
- 4.5. Supply Chain Analysis
- 4.6. Regulatory Landscape
- 4.7. Current Market Potential and Opportunity Assessment (TAM–SAM–SOM Framework)
- 4.8. DMV Analyst Note
- 4.1. Porters Five Forces
- 5. Market Analysis, Insights and Forecast 2021-2033
- 5.1. Market Analysis, Insights and Forecast - by Type
- 5.1.1. Raw Pyrolysis Gasoline
- 5.1.2. Hydrogenated Pyrolysis Gasoline
- 5.2. Market Analysis, Insights and Forecast - by Application
- 5.2.1. Benzene Processing
- 5.2.2. Aromatic Extraction
- 5.2.3. Feedstock of BTX Plant
- 5.2.4. Motor Fuels
- 5.2.5. Others
- 5.3. Market Analysis, Insights and Forecast - by Region
- 5.3.1. Asia Pacific
- 5.3.2. North America
- 5.3.3. Europe
- 5.3.4. South America
- 5.3.5. Middle East and Africa
- 5.1. Market Analysis, Insights and Forecast - by Type
- 6. Global Pyrolysis Gas Industry Analysis, Insights and Forecast, 2021-2033
- 6.1. Market Analysis, Insights and Forecast - by Type
- 6.1.1. Raw Pyrolysis Gasoline
- 6.1.2. Hydrogenated Pyrolysis Gasoline
- 6.2. Market Analysis, Insights and Forecast - by Application
- 6.2.1. Benzene Processing
- 6.2.2. Aromatic Extraction
- 6.2.3. Feedstock of BTX Plant
- 6.2.4. Motor Fuels
- 6.2.5. Others
- 6.1. Market Analysis, Insights and Forecast - by Type
- 7. Asia Pacific Pyrolysis Gas Industry Analysis, Insights and Forecast, 2020-2032
- 7.1. Market Analysis, Insights and Forecast - by Type
- 7.1.1. Raw Pyrolysis Gasoline
- 7.1.2. Hydrogenated Pyrolysis Gasoline
- 7.2. Market Analysis, Insights and Forecast - by Application
- 7.2.1. Benzene Processing
- 7.2.2. Aromatic Extraction
- 7.2.3. Feedstock of BTX Plant
- 7.2.4. Motor Fuels
- 7.2.5. Others
- 7.1. Market Analysis, Insights and Forecast - by Type
- 8. North America Pyrolysis Gas Industry Analysis, Insights and Forecast, 2020-2032
- 8.1. Market Analysis, Insights and Forecast - by Type
- 8.1.1. Raw Pyrolysis Gasoline
- 8.1.2. Hydrogenated Pyrolysis Gasoline
- 8.2. Market Analysis, Insights and Forecast - by Application
- 8.2.1. Benzene Processing
- 8.2.2. Aromatic Extraction
- 8.2.3. Feedstock of BTX Plant
- 8.2.4. Motor Fuels
- 8.2.5. Others
- 8.1. Market Analysis, Insights and Forecast - by Type
- 9. Europe Pyrolysis Gas Industry Analysis, Insights and Forecast, 2020-2032
- 9.1. Market Analysis, Insights and Forecast - by Type
- 9.1.1. Raw Pyrolysis Gasoline
- 9.1.2. Hydrogenated Pyrolysis Gasoline
- 9.2. Market Analysis, Insights and Forecast - by Application
- 9.2.1. Benzene Processing
- 9.2.2. Aromatic Extraction
- 9.2.3. Feedstock of BTX Plant
- 9.2.4. Motor Fuels
- 9.2.5. Others
- 9.1. Market Analysis, Insights and Forecast - by Type
- 10. South America Pyrolysis Gas Industry Analysis, Insights and Forecast, 2020-2032
- 10.1. Market Analysis, Insights and Forecast - by Type
- 10.1.1. Raw Pyrolysis Gasoline
- 10.1.2. Hydrogenated Pyrolysis Gasoline
- 10.2. Market Analysis, Insights and Forecast - by Application
- 10.2.1. Benzene Processing
- 10.2.2. Aromatic Extraction
- 10.2.3. Feedstock of BTX Plant
- 10.2.4. Motor Fuels
- 10.2.5. Others
- 10.1. Market Analysis, Insights and Forecast - by Type
- 11. Middle East and Africa Pyrolysis Gas Industry Analysis, Insights and Forecast, 2020-2032
- 11.1. Market Analysis, Insights and Forecast - by Type
- 11.1.1. Raw Pyrolysis Gasoline
- 11.1.2. Hydrogenated Pyrolysis Gasoline
- 11.2. Market Analysis, Insights and Forecast - by Application
- 11.2.1. Benzene Processing
- 11.2.2. Aromatic Extraction
- 11.2.3. Feedstock of BTX Plant
- 11.2.4. Motor Fuels
- 11.2.5. Others
- 11.1. Market Analysis, Insights and Forecast - by Type
- 12. Competitive Analysis
- 12.1. Company Profiles
- 12.1.1 KOYO KAIUN Co Ltd
- 12.1.1.1. Company Overview
- 12.1.1.2. Products
- 12.1.1.3. Company Financials
- 12.1.1.4. SWOT Analysis
- 12.1.2 Axens
- 12.1.2.1. Company Overview
- 12.1.2.2. Products
- 12.1.2.3. Company Financials
- 12.1.2.4. SWOT Analysis
- 12.1.3 Chevron Phillips Chemical Company
- 12.1.3.1. Company Overview
- 12.1.3.2. Products
- 12.1.3.3. Company Financials
- 12.1.3.4. SWOT Analysis
- 12.1.4 Dow
- 12.1.4.1. Company Overview
- 12.1.4.2. Products
- 12.1.4.3. Company Financials
- 12.1.4.4. SWOT Analysis
- 12.1.5 Exxon Mobil Corporation
- 12.1.5.1. Company Overview
- 12.1.5.2. Products
- 12.1.5.3. Company Financials
- 12.1.5.4. SWOT Analysis
- 12.1.6 Haldia Petrochemicals Limited
- 12.1.6.1. Company Overview
- 12.1.6.2. Products
- 12.1.6.3. Company Financials
- 12.1.6.4. SWOT Analysis
- 12.1.7 HIP-Petrohemija
- 12.1.7.1. Company Overview
- 12.1.7.2. Products
- 12.1.7.3. Company Financials
- 12.1.7.4. SWOT Analysis
- 12.1.8 Jam Petrochemical Company
- 12.1.8.1. Company Overview
- 12.1.8.2. Products
- 12.1.8.3. Company Financials
- 12.1.8.4. SWOT Analysis
- 12.1.9 ONGC Petro additions Limited
- 12.1.9.1. Company Overview
- 12.1.9.2. Products
- 12.1.9.3. Company Financials
- 12.1.9.4. SWOT Analysis
- 12.1.10 Ras Laffan Olefins Company Limited
- 12.1.10.1. Company Overview
- 12.1.10.2. Products
- 12.1.10.3. Company Financials
- 12.1.10.4. SWOT Analysis
- 12.1.11 SABIC
- 12.1.11.1. Company Overview
- 12.1.11.2. Products
- 12.1.11.3. Company Financials
- 12.1.11.4. SWOT Analysis
- 12.1.12 Shell
- 12.1.12.1. Company Overview
- 12.1.12.2. Products
- 12.1.12.3. Company Financials
- 12.1.12.4. SWOT Analysis
- 12.1.13 Sud Chemie India Pvt Ltd*List Not Exhaustive
- 12.1.13.1. Company Overview
- 12.1.13.2. Products
- 12.1.13.3. Company Financials
- 12.1.13.4. SWOT Analysis
- 12.1.1 KOYO KAIUN Co Ltd
- 12.2. Market Entropy
- 12.2.1 Company's Key Areas Served
- 12.2.2 Recent Developments
- 12.3. Company Market Share Analysis 2025
- 12.3.1 Top 5 Companies Market Share Analysis
- 12.3.2 Top 3 Companies Market Share Analysis
- 12.4. List of Potential Customers
- 13. Research Methodology
List of Figures
- Figure 1: Global Pyrolysis Gas Industry Revenue Breakdown (Million, %) by Region 2025 & 2033
- Figure 2: Asia Pacific Pyrolysis Gas Industry Revenue (Million), by Type 2025 & 2033
- Figure 3: Asia Pacific Pyrolysis Gas Industry Revenue Share (%), by Type 2025 & 2033
- Figure 4: Asia Pacific Pyrolysis Gas Industry Revenue (Million), by Application 2025 & 2033
- Figure 5: Asia Pacific Pyrolysis Gas Industry Revenue Share (%), by Application 2025 & 2033
- Figure 6: Asia Pacific Pyrolysis Gas Industry Revenue (Million), by Country 2025 & 2033
- Figure 7: Asia Pacific Pyrolysis Gas Industry Revenue Share (%), by Country 2025 & 2033
- Figure 8: North America Pyrolysis Gas Industry Revenue (Million), by Type 2025 & 2033
- Figure 9: North America Pyrolysis Gas Industry Revenue Share (%), by Type 2025 & 2033
- Figure 10: North America Pyrolysis Gas Industry Revenue (Million), by Application 2025 & 2033
- Figure 11: North America Pyrolysis Gas Industry Revenue Share (%), by Application 2025 & 2033
- Figure 12: North America Pyrolysis Gas Industry Revenue (Million), by Country 2025 & 2033
- Figure 13: North America Pyrolysis Gas Industry Revenue Share (%), by Country 2025 & 2033
- Figure 14: Europe Pyrolysis Gas Industry Revenue (Million), by Type 2025 & 2033
- Figure 15: Europe Pyrolysis Gas Industry Revenue Share (%), by Type 2025 & 2033
- Figure 16: Europe Pyrolysis Gas Industry Revenue (Million), by Application 2025 & 2033
- Figure 17: Europe Pyrolysis Gas Industry Revenue Share (%), by Application 2025 & 2033
- Figure 18: Europe Pyrolysis Gas Industry Revenue (Million), by Country 2025 & 2033
- Figure 19: Europe Pyrolysis Gas Industry Revenue Share (%), by Country 2025 & 2033
- Figure 20: South America Pyrolysis Gas Industry Revenue (Million), by Type 2025 & 2033
- Figure 21: South America Pyrolysis Gas Industry Revenue Share (%), by Type 2025 & 2033
- Figure 22: South America Pyrolysis Gas Industry Revenue (Million), by Application 2025 & 2033
- Figure 23: South America Pyrolysis Gas Industry Revenue Share (%), by Application 2025 & 2033
- Figure 24: South America Pyrolysis Gas Industry Revenue (Million), by Country 2025 & 2033
- Figure 25: South America Pyrolysis Gas Industry Revenue Share (%), by Country 2025 & 2033
- Figure 26: Middle East and Africa Pyrolysis Gas Industry Revenue (Million), by Type 2025 & 2033
- Figure 27: Middle East and Africa Pyrolysis Gas Industry Revenue Share (%), by Type 2025 & 2033
- Figure 28: Middle East and Africa Pyrolysis Gas Industry Revenue (Million), by Application 2025 & 2033
- Figure 29: Middle East and Africa Pyrolysis Gas Industry Revenue Share (%), by Application 2025 & 2033
- Figure 30: Middle East and Africa Pyrolysis Gas Industry Revenue (Million), by Country 2025 & 2033
- Figure 31: Middle East and Africa Pyrolysis Gas Industry Revenue Share (%), by Country 2025 & 2033
List of Tables
- Table 1: Global Pyrolysis Gas Industry Revenue Million Forecast, by Type 2020 & 2033
- Table 2: Global Pyrolysis Gas Industry Revenue Million Forecast, by Application 2020 & 2033
- Table 3: Global Pyrolysis Gas Industry Revenue Million Forecast, by Region 2020 & 2033
- Table 4: Global Pyrolysis Gas Industry Revenue Million Forecast, by Type 2020 & 2033
- Table 5: Global Pyrolysis Gas Industry Revenue Million Forecast, by Application 2020 & 2033
- Table 6: Global Pyrolysis Gas Industry Revenue Million Forecast, by Country 2020 & 2033
- Table 7: China Pyrolysis Gas Industry Revenue (Million) Forecast, by Application 2020 & 2033
- Table 8: India Pyrolysis Gas Industry Revenue (Million) Forecast, by Application 2020 & 2033
- Table 9: Japan Pyrolysis Gas Industry Revenue (Million) Forecast, by Application 2020 & 2033
- Table 10: South Korea Pyrolysis Gas Industry Revenue (Million) Forecast, by Application 2020 & 2033
- Table 11: Rest of Asia Pacific Pyrolysis Gas Industry Revenue (Million) Forecast, by Application 2020 & 2033
- Table 12: Global Pyrolysis Gas Industry Revenue Million Forecast, by Type 2020 & 2033
- Table 13: Global Pyrolysis Gas Industry Revenue Million Forecast, by Application 2020 & 2033
- Table 14: Global Pyrolysis Gas Industry Revenue Million Forecast, by Country 2020 & 2033
- Table 15: United States Pyrolysis Gas Industry Revenue (Million) Forecast, by Application 2020 & 2033
- Table 16: Canada Pyrolysis Gas Industry Revenue (Million) Forecast, by Application 2020 & 2033
- Table 17: Mexico Pyrolysis Gas Industry Revenue (Million) Forecast, by Application 2020 & 2033
- Table 18: Global Pyrolysis Gas Industry Revenue Million Forecast, by Type 2020 & 2033
- Table 19: Global Pyrolysis Gas Industry Revenue Million Forecast, by Application 2020 & 2033
- Table 20: Global Pyrolysis Gas Industry Revenue Million Forecast, by Country 2020 & 2033
- Table 21: Germany Pyrolysis Gas Industry Revenue (Million) Forecast, by Application 2020 & 2033
- Table 22: United Kingdom Pyrolysis Gas Industry Revenue (Million) Forecast, by Application 2020 & 2033
- Table 23: France Pyrolysis Gas Industry Revenue (Million) Forecast, by Application 2020 & 2033
- Table 24: Italy Pyrolysis Gas Industry Revenue (Million) Forecast, by Application 2020 & 2033
- Table 25: Rest of Europe Pyrolysis Gas Industry Revenue (Million) Forecast, by Application 2020 & 2033
- Table 26: Global Pyrolysis Gas Industry Revenue Million Forecast, by Type 2020 & 2033
- Table 27: Global Pyrolysis Gas Industry Revenue Million Forecast, by Application 2020 & 2033
- Table 28: Global Pyrolysis Gas Industry Revenue Million Forecast, by Country 2020 & 2033
- Table 29: Brazil Pyrolysis Gas Industry Revenue (Million) Forecast, by Application 2020 & 2033
- Table 30: Argentina Pyrolysis Gas Industry Revenue (Million) Forecast, by Application 2020 & 2033
- Table 31: Rest of South America Pyrolysis Gas Industry Revenue (Million) Forecast, by Application 2020 & 2033
- Table 32: Global Pyrolysis Gas Industry Revenue Million Forecast, by Type 2020 & 2033
- Table 33: Global Pyrolysis Gas Industry Revenue Million Forecast, by Application 2020 & 2033
- Table 34: Global Pyrolysis Gas Industry Revenue Million Forecast, by Country 2020 & 2033
- Table 35: Saudi Arabia Pyrolysis Gas Industry Revenue (Million) Forecast, by Application 2020 & 2033
- Table 36: South Africa Pyrolysis Gas Industry Revenue (Million) Forecast, by Application 2020 & 2033
- Table 37: Rest of Middle East and Africa Pyrolysis Gas Industry Revenue (Million) Forecast, by Application 2020 & 2033
Frequently Asked Questions
1. What is the projected Compound Annual Growth Rate (CAGR) of the Pyrolysis Gas Industry?
The projected CAGR is approximately > 3.00%.
2. Which companies are prominent players in the Pyrolysis Gas Industry?
Key companies in the market include KOYO KAIUN Co Ltd, Axens, Chevron Phillips Chemical Company, Dow, Exxon Mobil Corporation, Haldia Petrochemicals Limited, HIP-Petrohemija, Jam Petrochemical Company, ONGC Petro additions Limited, Ras Laffan Olefins Company Limited, SABIC, Shell, Sud Chemie India Pvt Ltd*List Not Exhaustive.
3. What are the main segments of the Pyrolysis Gas Industry?
The market segments include Type, Application.
4. Can you provide details about the market size?
The market size is estimated to be USD XX Million as of 2022.
5. What are some drivers contributing to market growth?
; Growing Demand of Pyrolysis Gas from Benzene Processing; Other Drivers.
6. What are the notable trends driving market growth?
Growing Demand of Pyrolysis Gas from Benzene Processing.
7. Are there any restraints impacting market growth?
; Growing Demand of Pyrolysis Gas from Benzene Processing; Other Drivers.
8. Can you provide examples of recent developments in the market?
N/A
9. What pricing options are available for accessing the report?
Pricing options include single-user, multi-user, and enterprise licenses priced at USD 4750, USD 5250, and USD 8750 respectively.
10. Is the market size provided in terms of value or volume?
The market size is provided in terms of value, measured in Million.
11. Are there any specific market keywords associated with the report?
Yes, the market keyword associated with the report is "Pyrolysis Gas Industry," which aids in identifying and referencing the specific market segment covered.
12. How do I determine which pricing option suits my needs best?
The pricing options vary based on user requirements and access needs. Individual users may opt for single-user licenses, while businesses requiring broader access may choose multi-user or enterprise licenses for cost-effective access to the report.
13. Are there any additional resources or data provided in the Pyrolysis Gas Industry report?
While the report offers comprehensive insights, it's advisable to review the specific contents or supplementary materials provided to ascertain if additional resources or data are available.
14. How can I stay updated on further developments or reports in the Pyrolysis Gas Industry?
To stay informed about further developments, trends, and reports in the Pyrolysis Gas Industry, consider subscribing to industry newsletters, following relevant companies and organizations, or regularly checking reputable industry news sources and publications.
Methodology
Step 1 - Identification of Relevant Samples Size from Population Database


Step 2 - Approaches for Defining Global Market Size (Value, Volume* & Price*)

Note*: In applicable scenarios
Step 3 - Data Sources
Primary Research
- Web Analytics
- Survey Reports
- Research Institute
- Latest Research Reports
- Opinion Leaders
Secondary Research
- Annual Reports
- White Paper
- Latest Press Release
- Industry Association
- Paid Database
- Investor Presentations

Step 4 - Data Triangulation
Involves using different sources of information in order to increase the validity of a study
These sources are likely to be stakeholders in a program - participants, other researchers, program staff, other community members, and so on.
Then we put all data in single framework & apply various statistical tools to find out the dynamic on the market.
During the analysis stage, feedback from the stakeholder groups would be compared to determine areas of agreement as well as areas of divergence