

Key Insights
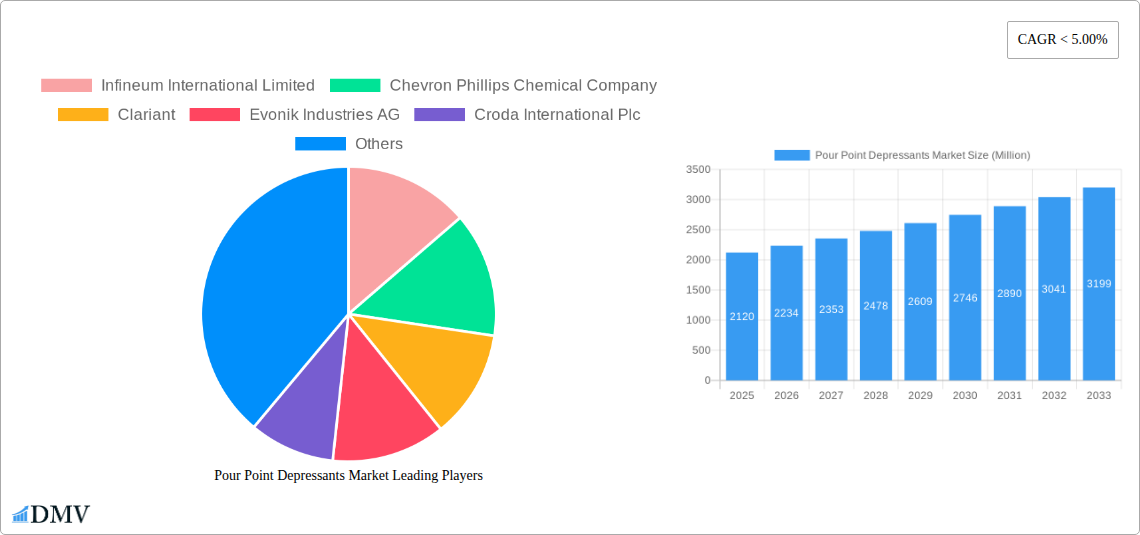
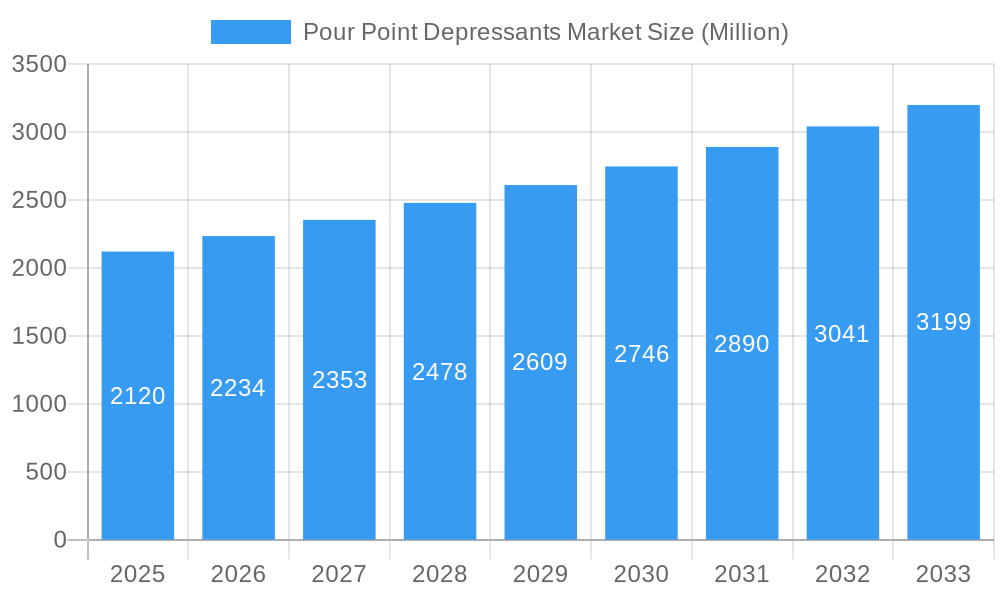
The Pour Point Depressants market, valued at $2120 million in 2025, is poised for significant growth throughout the forecast period (2025-2033). This growth is fueled by the increasing demand for efficient and cost-effective solutions to manage the flow properties of crude oil and other petroleum products, particularly in colder climates. The rising exploration and production activities in challenging geographical locations with low temperatures further accelerate market expansion. Technological advancements leading to the development of more efficient and environmentally friendly pour point depressants also contribute to market growth. The market is segmented based on type (polymeric and non-polymeric), application (crude oil, fuel oil, and others), and geography. The polymeric segment is anticipated to dominate owing to its superior performance characteristics and broader applicability. Geographically, regions with significant oil and gas production and transportation infrastructure, such as North America, Europe, and the Asia-Pacific region, are expected to hold substantial market share. Competition in the market is moderately intense, with several established players and emerging companies vying for market dominance. Strategic partnerships, mergers, and acquisitions are anticipated to shape the competitive landscape in the coming years.
Pour Point Depressants Market Market Size (In Billion)
The historical period (2019-2024) likely witnessed a steady growth trajectory, laying the foundation for the projected expansion. Considering the CAGR and market size in 2025, a realistic projection involves analyzing factors such as increased infrastructural investments in oil and gas, government regulations related to environmental impact, and innovations in pour point depressant technology. The market is expected to witness a gradual increase in the adoption of advanced pour point depressants due to their enhanced performance and sustainability. Furthermore, fluctuations in crude oil prices and economic growth will also influence the overall market dynamics and trajectory.
Pour Point Depressants Market Company Market Share
Pour Point Depressants Market: A Comprehensive Analysis (2019-2033)
This insightful report provides a comprehensive analysis of the Pour Point Depressants market, offering a detailed overview of its current state, future trajectory, and key players. Covering the period 2019-2033, with a base year of 2025 and a forecast period of 2025-2033, this report is an invaluable resource for stakeholders seeking to understand and capitalize on the opportunities within this dynamic market. The global Pour Point Depressants market is projected to reach xx Million by 2033, exhibiting a CAGR of xx% during the forecast period.
Pour Point Depressants Market Composition & Trends
This section delves into the intricate structure of the Pour Point Depressants market, examining market concentration, innovation drivers, regulatory landscapes, substitute products, end-user profiles, and M&A activities. The market is moderately concentrated, with key players such as Infineum International Limited, Chevron Phillips Chemical Company, and Clariant holding significant market share. However, the presence of several smaller, specialized players fosters competition and innovation.
- Market Share Distribution (2024): Infineum International Limited (xx%), Chevron Phillips Chemical Company (xx%), Clariant (xx%), Others (xx%).
- Innovation Catalysts: Stringent environmental regulations are pushing innovation towards eco-friendly pour point depressants.
- Regulatory Landscape: Varying regional regulations regarding emissions and chemical usage significantly influence market dynamics.
- Substitute Products: While few direct substitutes exist, alternative methods for managing pour points are being explored, posing a potential long-term threat.
- End-User Profiles: The Oil and Gas sector remains the dominant end-user, followed by Automotive and Industrial applications.
- M&A Activities: The past five years have witnessed xx M&A deals in the pour point depressants market, with a total transaction value of approximately xx Million. These deals have largely focused on expanding product portfolios and geographical reach.
Pour Point Depressants Market Industry Evolution
The Pour Point Depressants market has witnessed substantial growth over the past decade, driven by the increasing demand for efficient fuel additives in various industries. Technological advancements, particularly in the development of more effective and environmentally friendly formulations, have played a crucial role in this growth. Shifting consumer demands towards sustainable and high-performance products further fuel market expansion. The market experienced a growth rate of xx% from 2019 to 2024, and is expected to maintain a robust growth trajectory during the forecast period. The adoption rate of new, high-performance pour point depressants has increased by xx% since 2019.
Leading Regions, Countries, or Segments in Pour Point Depressants Market
The North American region currently dominates the Pour Point Depressants market, driven by robust demand from the Oil and Gas and Automotive sectors. However, Asia-Pacific is projected to experience the fastest growth rate during the forecast period, fueled by increasing industrialization and infrastructure development.
Key Drivers by Segment:
- Chemistry Type:
- Poly Alpha Olefin (PAO): High demand due to superior low-temperature performance and excellent oxidation stability. Strong investment in PAO production capacity is a key driver.
- Ethylene Co-Vinyl-Acetate: Growth driven by its cost-effectiveness and widespread applications in various industries.
- End-user Industry:
- Oil and Gas: This segment remains dominant due to the extensive use of pour point depressants in crude oil transportation and processing. Strong regulatory support for efficient fuel additives further boosts growth.
- Automotive: Growing demand for fuel efficiency and enhanced engine performance in vehicles drives the adoption of advanced pour point depressants.
Pour Point Depressants Market Product Innovations
Recent years have seen the introduction of several innovative pour point depressants with enhanced performance characteristics and environmentally friendly formulations. These include biodegradable and low-toxicity options addressing growing environmental concerns. Key innovations focus on improved pour point depression efficiency at lower concentrations, resulting in cost savings and reduced environmental impact. Unique selling propositions include enhanced dispersancy, improved cold flow properties, and compatibility with a broader range of base oils.
Propelling Factors for Pour Point Depressants Market Growth
The Pour Point Depressants market is propelled by several factors, including increasing demand for efficient fuel additives, stringent environmental regulations promoting eco-friendly solutions, and technological advancements resulting in improved product performance. The rising global energy consumption and the expansion of the Oil and Gas industry are further driving market growth.
Obstacles in the Pour Point Depressants Market
The Pour Point Depressants market faces certain challenges, including fluctuations in crude oil prices, potential supply chain disruptions, and intense competition from existing and emerging players. Stringent environmental regulations and the associated compliance costs can also impose constraints on market growth. Moreover, the development and adoption of alternative technologies for managing pour points pose a potential threat.
Future Opportunities in Pour Point Depressants Market
Future opportunities lie in developing advanced pour point depressants with enhanced performance and sustainability characteristics. Expansion into emerging markets, particularly in Asia-Pacific and Latin America, presents significant growth potential. The increasing demand for bio-based and renewable alternatives also opens new avenues for innovation and market penetration.
Major Players in the Pour Point Depressants Market Ecosystem
- Infineum International Limited
- Chevron Phillips Chemical Company
- Clariant
- Evonik Industries AG
- Croda International Plc
- SANAM Corporation
- The Lubrizol Corporation
- Thermax-USA
- Innospec
- Afton Chemical
Key Developments in Pour Point Depressants Market Industry
- 2022 Q4: Infineum International Limited launched a new, eco-friendly pour point depressant.
- 2023 Q1: Chevron Phillips Chemical Company and Clariant announced a collaboration to enhance R&D capabilities in pour point depressant technology.
- 2023 Q3: A major strategic acquisition expanded the market presence of a key player (details confidential).
Strategic Pour Point Depressants Market Forecast
The Pour Point Depressants market is poised for continued growth, driven by sustained demand from key end-user industries and ongoing innovation in product development. The focus on sustainability and environmental compliance will further shape market dynamics, creating opportunities for companies that can offer eco-friendly and high-performance solutions. The market's future success will depend on the ability of key players to adapt to evolving regulatory landscapes and consumer preferences.
Pour Point Depressants Market Segmentation
-
1. Chemistry Type
- 1.1. Ethylene Co-Vinyl-Acetate
- 1.2. Poly Alpha Olefin
- 1.3. Poly Alkyl Methacrylates (PAMA)
- 1.4. Styrene Esters
- 1.5. Others
-
2. End-user Industry
- 2.1. Oil and Gas
- 2.2. Automotive
- 2.3. Industrial
- 2.4. Marine
- 2.5. Aviation
Pour Point Depressants Market Segmentation By Geography
-
1. Asia Pacific
- 1.1. China
- 1.2. India
- 1.3. Japan
- 1.4. South Korea
- 1.5. Rest of Asia Pacific
-
2. North America
- 2.1. United States
- 2.2. Canada
- 2.3. Mexico
-
3. Europe
- 3.1. Germany
- 3.2. United Kingdom
- 3.3. France
- 3.4. Italy
- 3.5. Rest of Europe
-
4. South America
- 4.1. Brazil
- 4.2. Argentina
- 4.3. Rest of South America
-
5. Middle East and Africa
- 5.1. Saudi Arabia
- 5.2. South Africa
- 5.3. Rest of Middle East and Africa
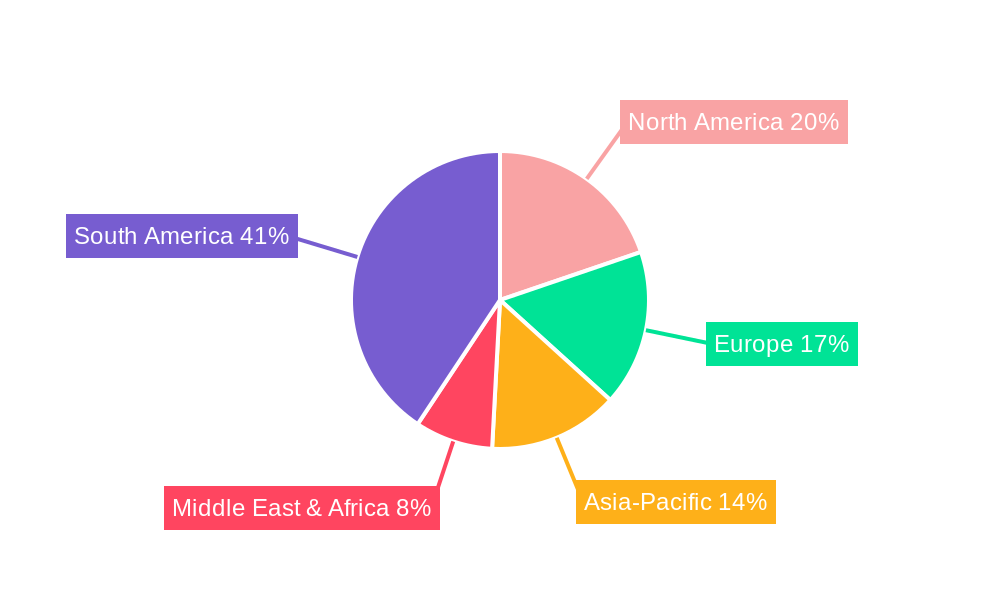
Pour Point Depressants Market Regional Market Share
Geographic Coverage of Pour Point Depressants Market
Pour Point Depressants Market REPORT HIGHLIGHTS
| Aspects | Details |
|---|---|
| Study Period | 2020-2034 |
| Base Year | 2025 |
| Estimated Year | 2026 |
| Forecast Period | 2026-2034 |
| Historical Period | 2020-2025 |
| Growth Rate | CAGR of < 5.00% from 2020-2034 |
| Segmentation |
|
Table of Contents
- 1. Introduction
- 1.1. Research Scope
- 1.2. Market Segmentation
- 1.3. Research Objective
- 1.4. Definitions and Assumptions
- 2. Executive Summary
- 2.1. Market Snapshot
- 3. Market Dynamics
- 3.1. Market Drivers
- 3.2. Market Restrains
- 3.3. Market Trends
- 3.4. Market Opportunities
- 4. Market Factor Analysis
- 4.1. Porters Five Forces
- 4.1.1. Bargaining Power of Suppliers
- 4.1.2. Bargaining Power of Buyers
- 4.1.3. Threat of New Entrants
- 4.1.4. Threat of Substitutes
- 4.1.5. Competitive Rivalry
- 4.2. PESTEL analysis
- 4.3. BCG Analysis
- 4.3.1. Stars (High Growth, High Market Share)
- 4.3.2. Cash Cows (Low Growth, High Market Share)
- 4.3.3. Question Mark (High Growth, Low Market Share)
- 4.3.4. Dogs (Low Growth, Low Market Share)
- 4.4. Ansoff Matrix Analysis
- 4.5. Supply Chain Analysis
- 4.6. Regulatory Landscape
- 4.7. Current Market Potential and Opportunity Assessment (TAM–SAM–SOM Framework)
- 4.8. DMV Analyst Note
- 4.1. Porters Five Forces
- 5. Market Analysis, Insights and Forecast 2021-2033
- 5.1. Market Analysis, Insights and Forecast - by Chemistry Type
- 5.1.1. Ethylene Co-Vinyl-Acetate
- 5.1.2. Poly Alpha Olefin
- 5.1.3. Poly Alkyl Methacrylates (PAMA)
- 5.1.4. Styrene Esters
- 5.1.5. Others
- 5.2. Market Analysis, Insights and Forecast - by End-user Industry
- 5.2.1. Oil and Gas
- 5.2.2. Automotive
- 5.2.3. Industrial
- 5.2.4. Marine
- 5.2.5. Aviation
- 5.3. Market Analysis, Insights and Forecast - by Region
- 5.3.1. Asia Pacific
- 5.3.2. North America
- 5.3.3. Europe
- 5.3.4. South America
- 5.3.5. Middle East and Africa
- 5.1. Market Analysis, Insights and Forecast - by Chemistry Type
- 6. Global Pour Point Depressants Market Analysis, Insights and Forecast, 2021-2033
- 6.1. Market Analysis, Insights and Forecast - by Chemistry Type
- 6.1.1. Ethylene Co-Vinyl-Acetate
- 6.1.2. Poly Alpha Olefin
- 6.1.3. Poly Alkyl Methacrylates (PAMA)
- 6.1.4. Styrene Esters
- 6.1.5. Others
- 6.2. Market Analysis, Insights and Forecast - by End-user Industry
- 6.2.1. Oil and Gas
- 6.2.2. Automotive
- 6.2.3. Industrial
- 6.2.4. Marine
- 6.2.5. Aviation
- 6.1. Market Analysis, Insights and Forecast - by Chemistry Type
- 7. Asia Pacific Pour Point Depressants Market Analysis, Insights and Forecast, 2020-2032
- 7.1. Market Analysis, Insights and Forecast - by Chemistry Type
- 7.1.1. Ethylene Co-Vinyl-Acetate
- 7.1.2. Poly Alpha Olefin
- 7.1.3. Poly Alkyl Methacrylates (PAMA)
- 7.1.4. Styrene Esters
- 7.1.5. Others
- 7.2. Market Analysis, Insights and Forecast - by End-user Industry
- 7.2.1. Oil and Gas
- 7.2.2. Automotive
- 7.2.3. Industrial
- 7.2.4. Marine
- 7.2.5. Aviation
- 7.1. Market Analysis, Insights and Forecast - by Chemistry Type
- 8. North America Pour Point Depressants Market Analysis, Insights and Forecast, 2020-2032
- 8.1. Market Analysis, Insights and Forecast - by Chemistry Type
- 8.1.1. Ethylene Co-Vinyl-Acetate
- 8.1.2. Poly Alpha Olefin
- 8.1.3. Poly Alkyl Methacrylates (PAMA)
- 8.1.4. Styrene Esters
- 8.1.5. Others
- 8.2. Market Analysis, Insights and Forecast - by End-user Industry
- 8.2.1. Oil and Gas
- 8.2.2. Automotive
- 8.2.3. Industrial
- 8.2.4. Marine
- 8.2.5. Aviation
- 8.1. Market Analysis, Insights and Forecast - by Chemistry Type
- 9. Europe Pour Point Depressants Market Analysis, Insights and Forecast, 2020-2032
- 9.1. Market Analysis, Insights and Forecast - by Chemistry Type
- 9.1.1. Ethylene Co-Vinyl-Acetate
- 9.1.2. Poly Alpha Olefin
- 9.1.3. Poly Alkyl Methacrylates (PAMA)
- 9.1.4. Styrene Esters
- 9.1.5. Others
- 9.2. Market Analysis, Insights and Forecast - by End-user Industry
- 9.2.1. Oil and Gas
- 9.2.2. Automotive
- 9.2.3. Industrial
- 9.2.4. Marine
- 9.2.5. Aviation
- 9.1. Market Analysis, Insights and Forecast - by Chemistry Type
- 10. South America Pour Point Depressants Market Analysis, Insights and Forecast, 2020-2032
- 10.1. Market Analysis, Insights and Forecast - by Chemistry Type
- 10.1.1. Ethylene Co-Vinyl-Acetate
- 10.1.2. Poly Alpha Olefin
- 10.1.3. Poly Alkyl Methacrylates (PAMA)
- 10.1.4. Styrene Esters
- 10.1.5. Others
- 10.2. Market Analysis, Insights and Forecast - by End-user Industry
- 10.2.1. Oil and Gas
- 10.2.2. Automotive
- 10.2.3. Industrial
- 10.2.4. Marine
- 10.2.5. Aviation
- 10.1. Market Analysis, Insights and Forecast - by Chemistry Type
- 11. Middle East and Africa Pour Point Depressants Market Analysis, Insights and Forecast, 2020-2032
- 11.1. Market Analysis, Insights and Forecast - by Chemistry Type
- 11.1.1. Ethylene Co-Vinyl-Acetate
- 11.1.2. Poly Alpha Olefin
- 11.1.3. Poly Alkyl Methacrylates (PAMA)
- 11.1.4. Styrene Esters
- 11.1.5. Others
- 11.2. Market Analysis, Insights and Forecast - by End-user Industry
- 11.2.1. Oil and Gas
- 11.2.2. Automotive
- 11.2.3. Industrial
- 11.2.4. Marine
- 11.2.5. Aviation
- 11.1. Market Analysis, Insights and Forecast - by Chemistry Type
- 12. Competitive Analysis
- 12.1. Company Profiles
- 12.1.1 Infineum International Limited
- 12.1.1.1. Company Overview
- 12.1.1.2. Products
- 12.1.1.3. Company Financials
- 12.1.1.4. SWOT Analysis
- 12.1.2 Chevron Phillips Chemical Company
- 12.1.2.1. Company Overview
- 12.1.2.2. Products
- 12.1.2.3. Company Financials
- 12.1.2.4. SWOT Analysis
- 12.1.3 Clariant
- 12.1.3.1. Company Overview
- 12.1.3.2. Products
- 12.1.3.3. Company Financials
- 12.1.3.4. SWOT Analysis
- 12.1.4 Evonik Industries AG
- 12.1.4.1. Company Overview
- 12.1.4.2. Products
- 12.1.4.3. Company Financials
- 12.1.4.4. SWOT Analysis
- 12.1.5 Croda International Plc
- 12.1.5.1. Company Overview
- 12.1.5.2. Products
- 12.1.5.3. Company Financials
- 12.1.5.4. SWOT Analysis
- 12.1.6 SANAM Corporation
- 12.1.6.1. Company Overview
- 12.1.6.2. Products
- 12.1.6.3. Company Financials
- 12.1.6.4. SWOT Analysis
- 12.1.7 The Lubrizol Corporation
- 12.1.7.1. Company Overview
- 12.1.7.2. Products
- 12.1.7.3. Company Financials
- 12.1.7.4. SWOT Analysis
- 12.1.8 Thermax-USA*List Not Exhaustive
- 12.1.8.1. Company Overview
- 12.1.8.2. Products
- 12.1.8.3. Company Financials
- 12.1.8.4. SWOT Analysis
- 12.1.9 Innospec
- 12.1.9.1. Company Overview
- 12.1.9.2. Products
- 12.1.9.3. Company Financials
- 12.1.9.4. SWOT Analysis
- 12.1.10 Afton Chemical
- 12.1.10.1. Company Overview
- 12.1.10.2. Products
- 12.1.10.3. Company Financials
- 12.1.10.4. SWOT Analysis
- 12.1.1 Infineum International Limited
- 12.2. Market Entropy
- 12.2.1 Company's Key Areas Served
- 12.2.2 Recent Developments
- 12.3. Company Market Share Analysis 2025
- 12.3.1 Top 5 Companies Market Share Analysis
- 12.3.2 Top 3 Companies Market Share Analysis
- 12.4. List of Potential Customers
- 13. Research Methodology
List of Figures
- Figure 1: Global Pour Point Depressants Market Revenue Breakdown (Million, %) by Region 2025 & 2033
- Figure 2: Asia Pacific Pour Point Depressants Market Revenue (Million), by Chemistry Type 2025 & 2033
- Figure 3: Asia Pacific Pour Point Depressants Market Revenue Share (%), by Chemistry Type 2025 & 2033
- Figure 4: Asia Pacific Pour Point Depressants Market Revenue (Million), by End-user Industry 2025 & 2033
- Figure 5: Asia Pacific Pour Point Depressants Market Revenue Share (%), by End-user Industry 2025 & 2033
- Figure 6: Asia Pacific Pour Point Depressants Market Revenue (Million), by Country 2025 & 2033
- Figure 7: Asia Pacific Pour Point Depressants Market Revenue Share (%), by Country 2025 & 2033
- Figure 8: North America Pour Point Depressants Market Revenue (Million), by Chemistry Type 2025 & 2033
- Figure 9: North America Pour Point Depressants Market Revenue Share (%), by Chemistry Type 2025 & 2033
- Figure 10: North America Pour Point Depressants Market Revenue (Million), by End-user Industry 2025 & 2033
- Figure 11: North America Pour Point Depressants Market Revenue Share (%), by End-user Industry 2025 & 2033
- Figure 12: North America Pour Point Depressants Market Revenue (Million), by Country 2025 & 2033
- Figure 13: North America Pour Point Depressants Market Revenue Share (%), by Country 2025 & 2033
- Figure 14: Europe Pour Point Depressants Market Revenue (Million), by Chemistry Type 2025 & 2033
- Figure 15: Europe Pour Point Depressants Market Revenue Share (%), by Chemistry Type 2025 & 2033
- Figure 16: Europe Pour Point Depressants Market Revenue (Million), by End-user Industry 2025 & 2033
- Figure 17: Europe Pour Point Depressants Market Revenue Share (%), by End-user Industry 2025 & 2033
- Figure 18: Europe Pour Point Depressants Market Revenue (Million), by Country 2025 & 2033
- Figure 19: Europe Pour Point Depressants Market Revenue Share (%), by Country 2025 & 2033
- Figure 20: South America Pour Point Depressants Market Revenue (Million), by Chemistry Type 2025 & 2033
- Figure 21: South America Pour Point Depressants Market Revenue Share (%), by Chemistry Type 2025 & 2033
- Figure 22: South America Pour Point Depressants Market Revenue (Million), by End-user Industry 2025 & 2033
- Figure 23: South America Pour Point Depressants Market Revenue Share (%), by End-user Industry 2025 & 2033
- Figure 24: South America Pour Point Depressants Market Revenue (Million), by Country 2025 & 2033
- Figure 25: South America Pour Point Depressants Market Revenue Share (%), by Country 2025 & 2033
- Figure 26: Middle East and Africa Pour Point Depressants Market Revenue (Million), by Chemistry Type 2025 & 2033
- Figure 27: Middle East and Africa Pour Point Depressants Market Revenue Share (%), by Chemistry Type 2025 & 2033
- Figure 28: Middle East and Africa Pour Point Depressants Market Revenue (Million), by End-user Industry 2025 & 2033
- Figure 29: Middle East and Africa Pour Point Depressants Market Revenue Share (%), by End-user Industry 2025 & 2033
- Figure 30: Middle East and Africa Pour Point Depressants Market Revenue (Million), by Country 2025 & 2033
- Figure 31: Middle East and Africa Pour Point Depressants Market Revenue Share (%), by Country 2025 & 2033
List of Tables
- Table 1: Global Pour Point Depressants Market Revenue Million Forecast, by Chemistry Type 2020 & 2033
- Table 2: Global Pour Point Depressants Market Revenue Million Forecast, by End-user Industry 2020 & 2033
- Table 3: Global Pour Point Depressants Market Revenue Million Forecast, by Region 2020 & 2033
- Table 4: Global Pour Point Depressants Market Revenue Million Forecast, by Chemistry Type 2020 & 2033
- Table 5: Global Pour Point Depressants Market Revenue Million Forecast, by End-user Industry 2020 & 2033
- Table 6: Global Pour Point Depressants Market Revenue Million Forecast, by Country 2020 & 2033
- Table 7: China Pour Point Depressants Market Revenue (Million) Forecast, by Application 2020 & 2033
- Table 8: India Pour Point Depressants Market Revenue (Million) Forecast, by Application 2020 & 2033
- Table 9: Japan Pour Point Depressants Market Revenue (Million) Forecast, by Application 2020 & 2033
- Table 10: South Korea Pour Point Depressants Market Revenue (Million) Forecast, by Application 2020 & 2033
- Table 11: Rest of Asia Pacific Pour Point Depressants Market Revenue (Million) Forecast, by Application 2020 & 2033
- Table 12: Global Pour Point Depressants Market Revenue Million Forecast, by Chemistry Type 2020 & 2033
- Table 13: Global Pour Point Depressants Market Revenue Million Forecast, by End-user Industry 2020 & 2033
- Table 14: Global Pour Point Depressants Market Revenue Million Forecast, by Country 2020 & 2033
- Table 15: United States Pour Point Depressants Market Revenue (Million) Forecast, by Application 2020 & 2033
- Table 16: Canada Pour Point Depressants Market Revenue (Million) Forecast, by Application 2020 & 2033
- Table 17: Mexico Pour Point Depressants Market Revenue (Million) Forecast, by Application 2020 & 2033
- Table 18: Global Pour Point Depressants Market Revenue Million Forecast, by Chemistry Type 2020 & 2033
- Table 19: Global Pour Point Depressants Market Revenue Million Forecast, by End-user Industry 2020 & 2033
- Table 20: Global Pour Point Depressants Market Revenue Million Forecast, by Country 2020 & 2033
- Table 21: Germany Pour Point Depressants Market Revenue (Million) Forecast, by Application 2020 & 2033
- Table 22: United Kingdom Pour Point Depressants Market Revenue (Million) Forecast, by Application 2020 & 2033
- Table 23: France Pour Point Depressants Market Revenue (Million) Forecast, by Application 2020 & 2033
- Table 24: Italy Pour Point Depressants Market Revenue (Million) Forecast, by Application 2020 & 2033
- Table 25: Rest of Europe Pour Point Depressants Market Revenue (Million) Forecast, by Application 2020 & 2033
- Table 26: Global Pour Point Depressants Market Revenue Million Forecast, by Chemistry Type 2020 & 2033
- Table 27: Global Pour Point Depressants Market Revenue Million Forecast, by End-user Industry 2020 & 2033
- Table 28: Global Pour Point Depressants Market Revenue Million Forecast, by Country 2020 & 2033
- Table 29: Brazil Pour Point Depressants Market Revenue (Million) Forecast, by Application 2020 & 2033
- Table 30: Argentina Pour Point Depressants Market Revenue (Million) Forecast, by Application 2020 & 2033
- Table 31: Rest of South America Pour Point Depressants Market Revenue (Million) Forecast, by Application 2020 & 2033
- Table 32: Global Pour Point Depressants Market Revenue Million Forecast, by Chemistry Type 2020 & 2033
- Table 33: Global Pour Point Depressants Market Revenue Million Forecast, by End-user Industry 2020 & 2033
- Table 34: Global Pour Point Depressants Market Revenue Million Forecast, by Country 2020 & 2033
- Table 35: Saudi Arabia Pour Point Depressants Market Revenue (Million) Forecast, by Application 2020 & 2033
- Table 36: South Africa Pour Point Depressants Market Revenue (Million) Forecast, by Application 2020 & 2033
- Table 37: Rest of Middle East and Africa Pour Point Depressants Market Revenue (Million) Forecast, by Application 2020 & 2033
Frequently Asked Questions
1. What is the projected Compound Annual Growth Rate (CAGR) of the Pour Point Depressants Market?
The projected CAGR is approximately < 5.00%.
2. Which companies are prominent players in the Pour Point Depressants Market?
Key companies in the market include Infineum International Limited, Chevron Phillips Chemical Company, Clariant, Evonik Industries AG, Croda International Plc, SANAM Corporation, The Lubrizol Corporation, Thermax-USA*List Not Exhaustive, Innospec, Afton Chemical.
3. What are the main segments of the Pour Point Depressants Market?
The market segments include Chemistry Type, End-user Industry.
4. Can you provide details about the market size?
The market size is estimated to be USD 2120 Million as of 2022.
5. What are some drivers contributing to market growth?
; Growing Demand for High Quality Fuels and Lubricants; Increasing Industrialization.
6. What are the notable trends driving market growth?
Growing Demand for High Quality Fuels and Lubricants.
7. Are there any restraints impacting market growth?
; Unfavorable Conditions Arising Due to COVID-19 Outbreak.
8. Can you provide examples of recent developments in the market?
Recent developments in the sector include the launch of new, eco-friendly pour point depressants by key players, collaborations to enhance research and development capabilities, and strategic acquisitions to expand market presence.
9. What pricing options are available for accessing the report?
Pricing options include single-user, multi-user, and enterprise licenses priced at USD 4750, USD 5250, and USD 8750 respectively.
10. Is the market size provided in terms of value or volume?
The market size is provided in terms of value, measured in Million.
11. Are there any specific market keywords associated with the report?
Yes, the market keyword associated with the report is "Pour Point Depressants Market," which aids in identifying and referencing the specific market segment covered.
12. How do I determine which pricing option suits my needs best?
The pricing options vary based on user requirements and access needs. Individual users may opt for single-user licenses, while businesses requiring broader access may choose multi-user or enterprise licenses for cost-effective access to the report.
13. Are there any additional resources or data provided in the Pour Point Depressants Market report?
While the report offers comprehensive insights, it's advisable to review the specific contents or supplementary materials provided to ascertain if additional resources or data are available.
14. How can I stay updated on further developments or reports in the Pour Point Depressants Market?
To stay informed about further developments, trends, and reports in the Pour Point Depressants Market, consider subscribing to industry newsletters, following relevant companies and organizations, or regularly checking reputable industry news sources and publications.
Methodology
Step 1 - Identification of Relevant Samples Size from Population Database


Step 2 - Approaches for Defining Global Market Size (Value, Volume* & Price*)

Note*: In applicable scenarios
Step 3 - Data Sources
Primary Research
- Web Analytics
- Survey Reports
- Research Institute
- Latest Research Reports
- Opinion Leaders
Secondary Research
- Annual Reports
- White Paper
- Latest Press Release
- Industry Association
- Paid Database
- Investor Presentations

Step 4 - Data Triangulation
Involves using different sources of information in order to increase the validity of a study
These sources are likely to be stakeholders in a program - participants, other researchers, program staff, other community members, and so on.
Then we put all data in single framework & apply various statistical tools to find out the dynamic on the market.
During the analysis stage, feedback from the stakeholder groups would be compared to determine areas of agreement as well as areas of divergence