

Key Insights
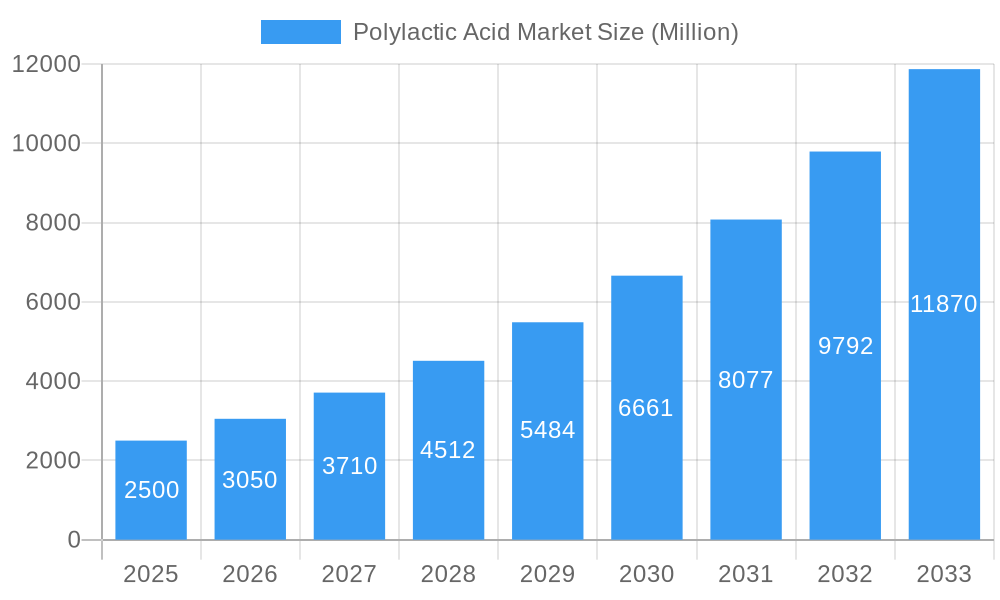
The Polylactic Acid (PLA) market is poised for significant expansion, fueled by the escalating demand for sustainable and biodegradable plastic alternatives. Anticipated to achieve a Compound Annual Growth Rate (CAGR) of 17.5%, the market is projected to reach a valuation of $2.01 billion by the base year, 2025. This growth trajectory is underpinned by several key factors: a rising consumer preference for eco-conscious packaging, stringent governmental mandates to reduce plastic waste, and the broadening utility of PLA across sectors including medical devices, electronics, and textiles. The market predominantly utilizes corn, cassava, sugarcane, and sugar beet as raw materials, with fiber, films, and sheets representing the primary PLA product forms. The Asia-Pacific region, particularly China and India, is expected to spearhead market growth due to rapid industrialization and increasing consumer purchasing power. However, adoption is moderated by the comparatively higher cost of PLA versus conventional petroleum-based plastics and the necessity for technological enhancements to optimize its performance in specialized applications.
Polylactic Acid Market Market Size (In Billion)
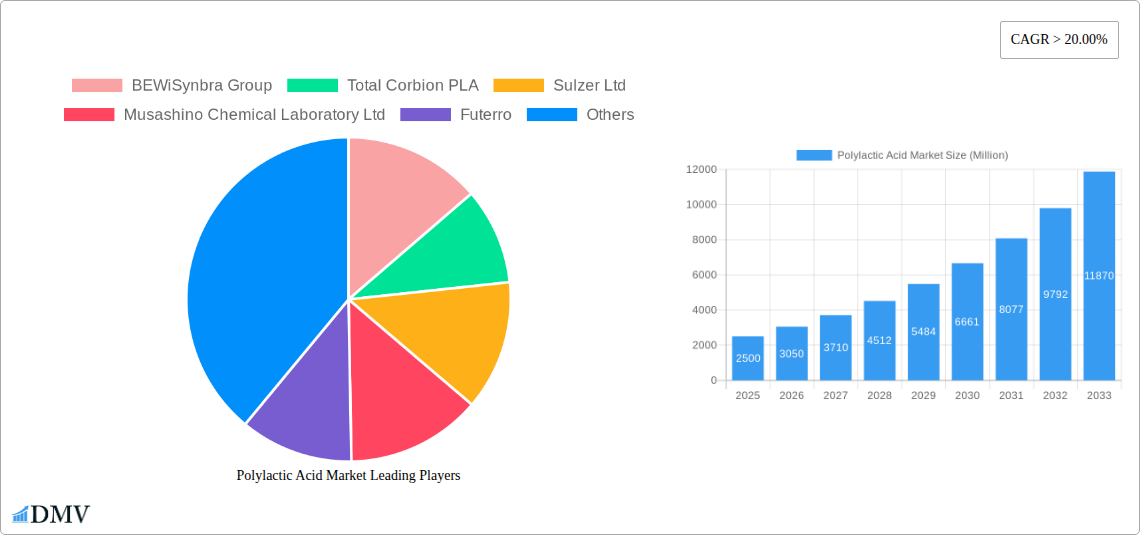
The competitive arena features a blend of global industry leaders and agile, specialized firms. Prominent companies such as BASF SE, NatureWorks LLC, and Total Corbion PLA are capitalizing on their established expertise and extensive supply chains to secure market dominance. Concurrently, regional entities are focusing on specialized applications and efficient production methods to remain competitive. The forecast period (2025-2033) indicates a continuation of robust growth, driven by ongoing technological innovation, expanding application horizons, and heightened consumer awareness of environmental sustainability. The market's future success will depend on overcoming existing hurdles, promoting innovation in PLA manufacturing, and facilitating its widespread integration across diverse industries. This will likely involve further investigation into feedstock diversification and the exploration of novel PLA applications beyond packaging to broaden its market penetration.
Polylactic Acid Market Company Market Share
Polylactic Acid (PLA) Market Report: A Comprehensive Analysis (2019-2033)
This insightful report provides a comprehensive analysis of the Polylactic Acid (PLA) market, offering a detailed overview of its current state, future trajectory, and key players. Covering the period from 2019 to 2033, with a focus on 2025, this report is an essential resource for stakeholders seeking to understand and capitalize on the opportunities within this rapidly evolving market. The global PLA market is projected to reach xx Million by 2033, demonstrating significant growth potential.
Polylactic Acid Market Composition & Trends
This section delves into the intricate dynamics of the PLA market, examining market concentration, innovation drivers, regulatory frameworks, substitute products, end-user profiles, and mergers & acquisitions (M&A) activity. We analyze the market share distribution among key players and quantify the value of significant M&A deals concluded during the historical period. The report also explores the impact of evolving regulations on bioplastics and the competitive landscape presented by substitute materials.
- Market Concentration: Analysis of market share held by top players (e.g., NatureWorks LLC holding xx% market share in 2024), revealing the degree of competition and consolidation.
- Innovation Catalysts: Identification of key technological advancements driving market growth, including advancements in bio-based feedstock and PLA processing techniques.
- Regulatory Landscape: Examination of existing and upcoming regulations impacting PLA production and application across various regions.
- Substitute Products: Evaluation of competing materials (e.g., PET, other bioplastics) and their impact on PLA market share.
- End-User Profiles: Detailed analysis of end-user industries, including their consumption patterns, growth drivers, and market share across segments like packaging, medical, and textiles.
- M&A Activity: Assessment of significant M&A transactions, including deal values and their impact on market structure and competitiveness (e.g., the impact of Sulzer's agreement with Jindan New Biomaterials).
Polylactic Acid Market Industry Evolution
This section provides a detailed analysis of the PLA market's evolutionary path, tracing its growth trajectory from 2019 to 2033. We examine technological innovations, shifting consumer preferences towards sustainable materials, and the influence of these factors on market expansion. We present quantifiable data, including Compound Annual Growth Rates (CAGRs) and adoption rates of PLA in various applications. The evolution from primarily niche applications to wider market penetration is detailed, analyzing the key factors driving this transition. The increasing demand for biodegradable plastics and the growing awareness of environmental sustainability are discussed as key catalysts for growth.
Leading Regions, Countries, or Segments in Polylactic Acid Market
This section identifies the leading regions, countries, and market segments within the PLA industry. A detailed analysis of the factors driving dominance in each segment is provided.
Dominant Regions/Countries: (e.g., Analysis of North America's leading position driven by strong regulatory support and consumer demand for sustainable products. Asia Pacific's rapid growth explained by increasing manufacturing capacity and government initiatives.)
Dominant Raw Materials:
- Corn: Analysis of corn's prevalence as a feedstock, driven by established supply chains and economies of scale.
- Cassava, Sugarcane, and Sugar Beet: Assessment of the advantages and challenges associated with using these alternative raw materials.
- Other Raw Materials (Molasses, Potato, Wheat): Exploration of the potential of these less conventional feedstocks and the associated research and development activities.
Dominant Forms:
- Fiber: Analysis of fiber's widespread applications in textiles and other industries.
- Films and Sheets: Assessment of its use in flexible packaging and other applications.
- Coatings: Discussion of its use in various coating applications.
Dominant End-user Industries:
- Packaging: Analysis of its widespread adoption in food and non-food packaging, driven by demand for biodegradable alternatives.
- Medical: Assessment of its use in medical implants and disposables, highlighting its biocompatibility.
- Other End-user Industries (Construction, Consumer Goods): Exploration of emerging applications in these areas.
Polylactic Acid Market Product Innovations
This section highlights recent advancements in PLA technology, including improved material properties, enhanced processing techniques, and novel applications. Specific examples of unique selling propositions (USPs) and technological advancements that are driving market growth will be presented. We will explore innovations in PLA blends and composites which allow for the improvement of the inherent PLA properties, broadening its applicability.
Propelling Factors for Polylactic Acid Market Growth
Several key drivers are fueling the expansion of the PLA market. Technological advancements leading to cost reductions in production, increasing consumer awareness of environmental sustainability, and supportive government policies and regulations aimed at reducing reliance on conventional plastics are key. Specific examples will illustrate the positive impact of these factors on market growth.
Obstacles in the Polylactic Acid Market
Despite its growth potential, the PLA market faces certain challenges. High production costs compared to conventional plastics, supply chain vulnerabilities related to feedstock availability, and competition from alternative bioplastics and traditional polymers pose significant restraints. The report will quantify these impacts on market growth.
Future Opportunities in Polylactic Acid Market
The PLA market presents significant future opportunities. Expanding applications in new sectors like construction and electronics, advancements in bio-based feedstock sourcing, and the growing demand for compostable packaging are creating promising avenues for growth. This section will highlight emerging trends and technologies shaping the future of the PLA market.
Major Players in the Polylactic Acid Market Ecosystem
- BEWiSynbra Group
- Total Corbion PLA
- Sulzer Ltd
- Musashino Chemical Laboratory Ltd
- Futerro
- BASF SE
- Esun
- Zhejiang Hisun Biomaterials Co Ltd
- Shanghai Tong Jie Liang Biomaterials Co Ltd
- NatureWorks LLC
- Cofco
- Polysciences Inc
- Weforyou
- Jiangxi Keyuan Bio-Material Co Ltd
- Danimer Scientific
Key Developments in Polylactic Acid Market Industry
- September 2023: Danimer Scientific's collaboration with Chevron Phillips Chemical to develop high-volume biodegradable plastic products using Danimer's Rinnovo polymers signals a significant step towards increased market penetration for PLA-based bioplastics.
- May 2023: Sulzer's agreement with China's Jindan New Biomaterials to produce up to 750,000 tonnes of PLA annually demonstrates the growing investment in PLA production capacity, particularly in Asia. This will likely increase the market supply and potentially lower prices.
Strategic Polylactic Acid Market Forecast
The PLA market is poised for substantial growth driven by increasing environmental awareness, technological advancements reducing production costs, and the expanding applications across diverse industries. The forecast period (2025-2033) anticipates robust growth, propelled by innovation and strategic partnerships. The report concludes with a confident outlook on the future of the PLA market, emphasizing its potential to become a dominant player in the sustainable materials sector.
Polylactic Acid Market Segmentation
-
1. Raw Material
- 1.1. Corn
- 1.2. Cassava
- 1.3. Sugarcane and Sugar Beet
- 1.4. Other Raw Materials(molasses, potato, wheat)
-
2. Form
- 2.1. Fiber
- 2.2. Films and Sheets
- 2.3. Coatings
- 2.4. Other Forms
-
3. End-user Industry
- 3.1. Packaging
- 3.2. Medical
- 3.3. Electronics
- 3.4. Agriculture
- 3.5. Textiles
- 3.6. Other En
Polylactic Acid Market Segmentation By Geography
-
1. Asia Pacific
- 1.1. China
- 1.2. India
- 1.3. Japan
- 1.4. South Korea
- 1.5. ASEAN Countries
- 1.6. Rest of Asia Pacific
-
2. North America
- 2.1. United States
- 2.2. Canada
- 2.3. Mexico
-
3. Europe
- 3.1. Germany
- 3.2. United Kingdom
- 3.3. France
- 3.4. Italy
- 3.5. CIS region
- 3.6. Rest of Europe
-
4. South America
- 4.1. Brazil
- 4.2. Argentina
- 4.3. Rest of South America
-
5. Middle East and Africa
- 5.1. Saudi Arabia
- 5.2. South Africa
- 5.3. Rest of Middle East and Africa
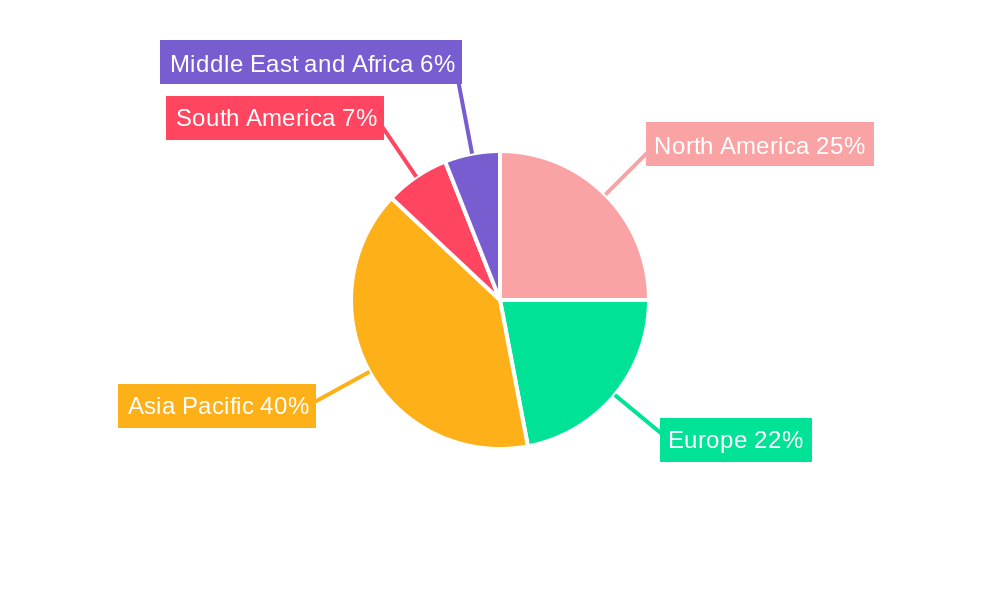
Polylactic Acid Market Regional Market Share
Geographic Coverage of Polylactic Acid Market
Polylactic Acid Market REPORT HIGHLIGHTS
| Aspects | Details |
|---|---|
| Study Period | 2020-2034 |
| Base Year | 2025 |
| Estimated Year | 2026 |
| Forecast Period | 2026-2034 |
| Historical Period | 2020-2025 |
| Growth Rate | CAGR of 17.5% from 2020-2034 |
| Segmentation |
|
Table of Contents
- 1. Introduction
- 1.1. Research Scope
- 1.2. Market Segmentation
- 1.3. Research Objective
- 1.4. Definitions and Assumptions
- 2. Executive Summary
- 2.1. Market Snapshot
- 3. Market Dynamics
- 3.1. Market Drivers
- 3.2. Market Restrains
- 3.3. Market Trends
- 3.4. Market Opportunities
- 4. Market Factor Analysis
- 4.1. Porters Five Forces
- 4.1.1. Bargaining Power of Suppliers
- 4.1.2. Bargaining Power of Buyers
- 4.1.3. Threat of New Entrants
- 4.1.4. Threat of Substitutes
- 4.1.5. Competitive Rivalry
- 4.2. PESTEL analysis
- 4.3. BCG Analysis
- 4.3.1. Stars (High Growth, High Market Share)
- 4.3.2. Cash Cows (Low Growth, High Market Share)
- 4.3.3. Question Mark (High Growth, Low Market Share)
- 4.3.4. Dogs (Low Growth, Low Market Share)
- 4.4. Ansoff Matrix Analysis
- 4.5. Supply Chain Analysis
- 4.6. Regulatory Landscape
- 4.7. Current Market Potential and Opportunity Assessment (TAM–SAM–SOM Framework)
- 4.8. DMV Analyst Note
- 4.1. Porters Five Forces
- 5. Market Analysis, Insights and Forecast 2021-2033
- 5.1. Market Analysis, Insights and Forecast - by Raw Material
- 5.1.1. Corn
- 5.1.2. Cassava
- 5.1.3. Sugarcane and Sugar Beet
- 5.1.4. Other Raw Materials(molasses, potato, wheat)
- 5.2. Market Analysis, Insights and Forecast - by Form
- 5.2.1. Fiber
- 5.2.2. Films and Sheets
- 5.2.3. Coatings
- 5.2.4. Other Forms
- 5.3. Market Analysis, Insights and Forecast - by End-user Industry
- 5.3.1. Packaging
- 5.3.2. Medical
- 5.3.3. Electronics
- 5.3.4. Agriculture
- 5.3.5. Textiles
- 5.3.6. Other En
- 5.4. Market Analysis, Insights and Forecast - by Region
- 5.4.1. Asia Pacific
- 5.4.2. North America
- 5.4.3. Europe
- 5.4.4. South America
- 5.4.5. Middle East and Africa
- 5.1. Market Analysis, Insights and Forecast - by Raw Material
- 6. Global Polylactic Acid Market Analysis, Insights and Forecast, 2021-2033
- 6.1. Market Analysis, Insights and Forecast - by Raw Material
- 6.1.1. Corn
- 6.1.2. Cassava
- 6.1.3. Sugarcane and Sugar Beet
- 6.1.4. Other Raw Materials(molasses, potato, wheat)
- 6.2. Market Analysis, Insights and Forecast - by Form
- 6.2.1. Fiber
- 6.2.2. Films and Sheets
- 6.2.3. Coatings
- 6.2.4. Other Forms
- 6.3. Market Analysis, Insights and Forecast - by End-user Industry
- 6.3.1. Packaging
- 6.3.2. Medical
- 6.3.3. Electronics
- 6.3.4. Agriculture
- 6.3.5. Textiles
- 6.3.6. Other En
- 6.1. Market Analysis, Insights and Forecast - by Raw Material
- 7. Asia Pacific Polylactic Acid Market Analysis, Insights and Forecast, 2020-2032
- 7.1. Market Analysis, Insights and Forecast - by Raw Material
- 7.1.1. Corn
- 7.1.2. Cassava
- 7.1.3. Sugarcane and Sugar Beet
- 7.1.4. Other Raw Materials(molasses, potato, wheat)
- 7.2. Market Analysis, Insights and Forecast - by Form
- 7.2.1. Fiber
- 7.2.2. Films and Sheets
- 7.2.3. Coatings
- 7.2.4. Other Forms
- 7.3. Market Analysis, Insights and Forecast - by End-user Industry
- 7.3.1. Packaging
- 7.3.2. Medical
- 7.3.3. Electronics
- 7.3.4. Agriculture
- 7.3.5. Textiles
- 7.3.6. Other En
- 7.1. Market Analysis, Insights and Forecast - by Raw Material
- 8. North America Polylactic Acid Market Analysis, Insights and Forecast, 2020-2032
- 8.1. Market Analysis, Insights and Forecast - by Raw Material
- 8.1.1. Corn
- 8.1.2. Cassava
- 8.1.3. Sugarcane and Sugar Beet
- 8.1.4. Other Raw Materials(molasses, potato, wheat)
- 8.2. Market Analysis, Insights and Forecast - by Form
- 8.2.1. Fiber
- 8.2.2. Films and Sheets
- 8.2.3. Coatings
- 8.2.4. Other Forms
- 8.3. Market Analysis, Insights and Forecast - by End-user Industry
- 8.3.1. Packaging
- 8.3.2. Medical
- 8.3.3. Electronics
- 8.3.4. Agriculture
- 8.3.5. Textiles
- 8.3.6. Other En
- 8.1. Market Analysis, Insights and Forecast - by Raw Material
- 9. Europe Polylactic Acid Market Analysis, Insights and Forecast, 2020-2032
- 9.1. Market Analysis, Insights and Forecast - by Raw Material
- 9.1.1. Corn
- 9.1.2. Cassava
- 9.1.3. Sugarcane and Sugar Beet
- 9.1.4. Other Raw Materials(molasses, potato, wheat)
- 9.2. Market Analysis, Insights and Forecast - by Form
- 9.2.1. Fiber
- 9.2.2. Films and Sheets
- 9.2.3. Coatings
- 9.2.4. Other Forms
- 9.3. Market Analysis, Insights and Forecast - by End-user Industry
- 9.3.1. Packaging
- 9.3.2. Medical
- 9.3.3. Electronics
- 9.3.4. Agriculture
- 9.3.5. Textiles
- 9.3.6. Other En
- 9.1. Market Analysis, Insights and Forecast - by Raw Material
- 10. South America Polylactic Acid Market Analysis, Insights and Forecast, 2020-2032
- 10.1. Market Analysis, Insights and Forecast - by Raw Material
- 10.1.1. Corn
- 10.1.2. Cassava
- 10.1.3. Sugarcane and Sugar Beet
- 10.1.4. Other Raw Materials(molasses, potato, wheat)
- 10.2. Market Analysis, Insights and Forecast - by Form
- 10.2.1. Fiber
- 10.2.2. Films and Sheets
- 10.2.3. Coatings
- 10.2.4. Other Forms
- 10.3. Market Analysis, Insights and Forecast - by End-user Industry
- 10.3.1. Packaging
- 10.3.2. Medical
- 10.3.3. Electronics
- 10.3.4. Agriculture
- 10.3.5. Textiles
- 10.3.6. Other En
- 10.1. Market Analysis, Insights and Forecast - by Raw Material
- 11. Middle East and Africa Polylactic Acid Market Analysis, Insights and Forecast, 2020-2032
- 11.1. Market Analysis, Insights and Forecast - by Raw Material
- 11.1.1. Corn
- 11.1.2. Cassava
- 11.1.3. Sugarcane and Sugar Beet
- 11.1.4. Other Raw Materials(molasses, potato, wheat)
- 11.2. Market Analysis, Insights and Forecast - by Form
- 11.2.1. Fiber
- 11.2.2. Films and Sheets
- 11.2.3. Coatings
- 11.2.4. Other Forms
- 11.3. Market Analysis, Insights and Forecast - by End-user Industry
- 11.3.1. Packaging
- 11.3.2. Medical
- 11.3.3. Electronics
- 11.3.4. Agriculture
- 11.3.5. Textiles
- 11.3.6. Other En
- 11.1. Market Analysis, Insights and Forecast - by Raw Material
- 12. Competitive Analysis
- 12.1. Company Profiles
- 12.1.1 BEWiSynbra Group
- 12.1.1.1. Company Overview
- 12.1.1.2. Products
- 12.1.1.3. Company Financials
- 12.1.1.4. SWOT Analysis
- 12.1.2 Total Corbion PLA
- 12.1.2.1. Company Overview
- 12.1.2.2. Products
- 12.1.2.3. Company Financials
- 12.1.2.4. SWOT Analysis
- 12.1.3 Sulzer Ltd
- 12.1.3.1. Company Overview
- 12.1.3.2. Products
- 12.1.3.3. Company Financials
- 12.1.3.4. SWOT Analysis
- 12.1.4 Musashino Chemical Laboratory Ltd
- 12.1.4.1. Company Overview
- 12.1.4.2. Products
- 12.1.4.3. Company Financials
- 12.1.4.4. SWOT Analysis
- 12.1.5 Futerro
- 12.1.5.1. Company Overview
- 12.1.5.2. Products
- 12.1.5.3. Company Financials
- 12.1.5.4. SWOT Analysis
- 12.1.6 BASF SE
- 12.1.6.1. Company Overview
- 12.1.6.2. Products
- 12.1.6.3. Company Financials
- 12.1.6.4. SWOT Analysis
- 12.1.7 Esun
- 12.1.7.1. Company Overview
- 12.1.7.2. Products
- 12.1.7.3. Company Financials
- 12.1.7.4. SWOT Analysis
- 12.1.8 Zhejiang Hisun Biomaterials Co Ltd*List Not Exhaustive
- 12.1.8.1. Company Overview
- 12.1.8.2. Products
- 12.1.8.3. Company Financials
- 12.1.8.4. SWOT Analysis
- 12.1.9 Shanghai Tong Jie Liang Biomaterials Co Ltd
- 12.1.9.1. Company Overview
- 12.1.9.2. Products
- 12.1.9.3. Company Financials
- 12.1.9.4. SWOT Analysis
- 12.1.10 NatureWorks LLC
- 12.1.10.1. Company Overview
- 12.1.10.2. Products
- 12.1.10.3. Company Financials
- 12.1.10.4. SWOT Analysis
- 12.1.11 Cofco
- 12.1.11.1. Company Overview
- 12.1.11.2. Products
- 12.1.11.3. Company Financials
- 12.1.11.4. SWOT Analysis
- 12.1.12 Polysciences Inc
- 12.1.12.1. Company Overview
- 12.1.12.2. Products
- 12.1.12.3. Company Financials
- 12.1.12.4. SWOT Analysis
- 12.1.13 Weforyou
- 12.1.13.1. Company Overview
- 12.1.13.2. Products
- 12.1.13.3. Company Financials
- 12.1.13.4. SWOT Analysis
- 12.1.14 Jiangxi Keyuan Bio-Material Co Ltd
- 12.1.14.1. Company Overview
- 12.1.14.2. Products
- 12.1.14.3. Company Financials
- 12.1.14.4. SWOT Analysis
- 12.1.15 Danimer Scientific
- 12.1.15.1. Company Overview
- 12.1.15.2. Products
- 12.1.15.3. Company Financials
- 12.1.15.4. SWOT Analysis
- 12.1.1 BEWiSynbra Group
- 12.2. Market Entropy
- 12.2.1 Company's Key Areas Served
- 12.2.2 Recent Developments
- 12.3. Company Market Share Analysis 2025
- 12.3.1 Top 5 Companies Market Share Analysis
- 12.3.2 Top 3 Companies Market Share Analysis
- 12.4. List of Potential Customers
- 13. Research Methodology
List of Figures
- Figure 1: Global Polylactic Acid Market Revenue Breakdown (billion, %) by Region 2025 & 2033
- Figure 2: Global Polylactic Acid Market Volume Breakdown (Million, %) by Region 2025 & 2033
- Figure 3: Asia Pacific Polylactic Acid Market Revenue (billion), by Raw Material 2025 & 2033
- Figure 4: Asia Pacific Polylactic Acid Market Volume (Million), by Raw Material 2025 & 2033
- Figure 5: Asia Pacific Polylactic Acid Market Revenue Share (%), by Raw Material 2025 & 2033
- Figure 6: Asia Pacific Polylactic Acid Market Volume Share (%), by Raw Material 2025 & 2033
- Figure 7: Asia Pacific Polylactic Acid Market Revenue (billion), by Form 2025 & 2033
- Figure 8: Asia Pacific Polylactic Acid Market Volume (Million), by Form 2025 & 2033
- Figure 9: Asia Pacific Polylactic Acid Market Revenue Share (%), by Form 2025 & 2033
- Figure 10: Asia Pacific Polylactic Acid Market Volume Share (%), by Form 2025 & 2033
- Figure 11: Asia Pacific Polylactic Acid Market Revenue (billion), by End-user Industry 2025 & 2033
- Figure 12: Asia Pacific Polylactic Acid Market Volume (Million), by End-user Industry 2025 & 2033
- Figure 13: Asia Pacific Polylactic Acid Market Revenue Share (%), by End-user Industry 2025 & 2033
- Figure 14: Asia Pacific Polylactic Acid Market Volume Share (%), by End-user Industry 2025 & 2033
- Figure 15: Asia Pacific Polylactic Acid Market Revenue (billion), by Country 2025 & 2033
- Figure 16: Asia Pacific Polylactic Acid Market Volume (Million), by Country 2025 & 2033
- Figure 17: Asia Pacific Polylactic Acid Market Revenue Share (%), by Country 2025 & 2033
- Figure 18: Asia Pacific Polylactic Acid Market Volume Share (%), by Country 2025 & 2033
- Figure 19: North America Polylactic Acid Market Revenue (billion), by Raw Material 2025 & 2033
- Figure 20: North America Polylactic Acid Market Volume (Million), by Raw Material 2025 & 2033
- Figure 21: North America Polylactic Acid Market Revenue Share (%), by Raw Material 2025 & 2033
- Figure 22: North America Polylactic Acid Market Volume Share (%), by Raw Material 2025 & 2033
- Figure 23: North America Polylactic Acid Market Revenue (billion), by Form 2025 & 2033
- Figure 24: North America Polylactic Acid Market Volume (Million), by Form 2025 & 2033
- Figure 25: North America Polylactic Acid Market Revenue Share (%), by Form 2025 & 2033
- Figure 26: North America Polylactic Acid Market Volume Share (%), by Form 2025 & 2033
- Figure 27: North America Polylactic Acid Market Revenue (billion), by End-user Industry 2025 & 2033
- Figure 28: North America Polylactic Acid Market Volume (Million), by End-user Industry 2025 & 2033
- Figure 29: North America Polylactic Acid Market Revenue Share (%), by End-user Industry 2025 & 2033
- Figure 30: North America Polylactic Acid Market Volume Share (%), by End-user Industry 2025 & 2033
- Figure 31: North America Polylactic Acid Market Revenue (billion), by Country 2025 & 2033
- Figure 32: North America Polylactic Acid Market Volume (Million), by Country 2025 & 2033
- Figure 33: North America Polylactic Acid Market Revenue Share (%), by Country 2025 & 2033
- Figure 34: North America Polylactic Acid Market Volume Share (%), by Country 2025 & 2033
- Figure 35: Europe Polylactic Acid Market Revenue (billion), by Raw Material 2025 & 2033
- Figure 36: Europe Polylactic Acid Market Volume (Million), by Raw Material 2025 & 2033
- Figure 37: Europe Polylactic Acid Market Revenue Share (%), by Raw Material 2025 & 2033
- Figure 38: Europe Polylactic Acid Market Volume Share (%), by Raw Material 2025 & 2033
- Figure 39: Europe Polylactic Acid Market Revenue (billion), by Form 2025 & 2033
- Figure 40: Europe Polylactic Acid Market Volume (Million), by Form 2025 & 2033
- Figure 41: Europe Polylactic Acid Market Revenue Share (%), by Form 2025 & 2033
- Figure 42: Europe Polylactic Acid Market Volume Share (%), by Form 2025 & 2033
- Figure 43: Europe Polylactic Acid Market Revenue (billion), by End-user Industry 2025 & 2033
- Figure 44: Europe Polylactic Acid Market Volume (Million), by End-user Industry 2025 & 2033
- Figure 45: Europe Polylactic Acid Market Revenue Share (%), by End-user Industry 2025 & 2033
- Figure 46: Europe Polylactic Acid Market Volume Share (%), by End-user Industry 2025 & 2033
- Figure 47: Europe Polylactic Acid Market Revenue (billion), by Country 2025 & 2033
- Figure 48: Europe Polylactic Acid Market Volume (Million), by Country 2025 & 2033
- Figure 49: Europe Polylactic Acid Market Revenue Share (%), by Country 2025 & 2033
- Figure 50: Europe Polylactic Acid Market Volume Share (%), by Country 2025 & 2033
- Figure 51: South America Polylactic Acid Market Revenue (billion), by Raw Material 2025 & 2033
- Figure 52: South America Polylactic Acid Market Volume (Million), by Raw Material 2025 & 2033
- Figure 53: South America Polylactic Acid Market Revenue Share (%), by Raw Material 2025 & 2033
- Figure 54: South America Polylactic Acid Market Volume Share (%), by Raw Material 2025 & 2033
- Figure 55: South America Polylactic Acid Market Revenue (billion), by Form 2025 & 2033
- Figure 56: South America Polylactic Acid Market Volume (Million), by Form 2025 & 2033
- Figure 57: South America Polylactic Acid Market Revenue Share (%), by Form 2025 & 2033
- Figure 58: South America Polylactic Acid Market Volume Share (%), by Form 2025 & 2033
- Figure 59: South America Polylactic Acid Market Revenue (billion), by End-user Industry 2025 & 2033
- Figure 60: South America Polylactic Acid Market Volume (Million), by End-user Industry 2025 & 2033
- Figure 61: South America Polylactic Acid Market Revenue Share (%), by End-user Industry 2025 & 2033
- Figure 62: South America Polylactic Acid Market Volume Share (%), by End-user Industry 2025 & 2033
- Figure 63: South America Polylactic Acid Market Revenue (billion), by Country 2025 & 2033
- Figure 64: South America Polylactic Acid Market Volume (Million), by Country 2025 & 2033
- Figure 65: South America Polylactic Acid Market Revenue Share (%), by Country 2025 & 2033
- Figure 66: South America Polylactic Acid Market Volume Share (%), by Country 2025 & 2033
- Figure 67: Middle East and Africa Polylactic Acid Market Revenue (billion), by Raw Material 2025 & 2033
- Figure 68: Middle East and Africa Polylactic Acid Market Volume (Million), by Raw Material 2025 & 2033
- Figure 69: Middle East and Africa Polylactic Acid Market Revenue Share (%), by Raw Material 2025 & 2033
- Figure 70: Middle East and Africa Polylactic Acid Market Volume Share (%), by Raw Material 2025 & 2033
- Figure 71: Middle East and Africa Polylactic Acid Market Revenue (billion), by Form 2025 & 2033
- Figure 72: Middle East and Africa Polylactic Acid Market Volume (Million), by Form 2025 & 2033
- Figure 73: Middle East and Africa Polylactic Acid Market Revenue Share (%), by Form 2025 & 2033
- Figure 74: Middle East and Africa Polylactic Acid Market Volume Share (%), by Form 2025 & 2033
- Figure 75: Middle East and Africa Polylactic Acid Market Revenue (billion), by End-user Industry 2025 & 2033
- Figure 76: Middle East and Africa Polylactic Acid Market Volume (Million), by End-user Industry 2025 & 2033
- Figure 77: Middle East and Africa Polylactic Acid Market Revenue Share (%), by End-user Industry 2025 & 2033
- Figure 78: Middle East and Africa Polylactic Acid Market Volume Share (%), by End-user Industry 2025 & 2033
- Figure 79: Middle East and Africa Polylactic Acid Market Revenue (billion), by Country 2025 & 2033
- Figure 80: Middle East and Africa Polylactic Acid Market Volume (Million), by Country 2025 & 2033
- Figure 81: Middle East and Africa Polylactic Acid Market Revenue Share (%), by Country 2025 & 2033
- Figure 82: Middle East and Africa Polylactic Acid Market Volume Share (%), by Country 2025 & 2033
List of Tables
- Table 1: Global Polylactic Acid Market Revenue billion Forecast, by Raw Material 2020 & 2033
- Table 2: Global Polylactic Acid Market Volume Million Forecast, by Raw Material 2020 & 2033
- Table 3: Global Polylactic Acid Market Revenue billion Forecast, by Form 2020 & 2033
- Table 4: Global Polylactic Acid Market Volume Million Forecast, by Form 2020 & 2033
- Table 5: Global Polylactic Acid Market Revenue billion Forecast, by End-user Industry 2020 & 2033
- Table 6: Global Polylactic Acid Market Volume Million Forecast, by End-user Industry 2020 & 2033
- Table 7: Global Polylactic Acid Market Revenue billion Forecast, by Region 2020 & 2033
- Table 8: Global Polylactic Acid Market Volume Million Forecast, by Region 2020 & 2033
- Table 9: Global Polylactic Acid Market Revenue billion Forecast, by Raw Material 2020 & 2033
- Table 10: Global Polylactic Acid Market Volume Million Forecast, by Raw Material 2020 & 2033
- Table 11: Global Polylactic Acid Market Revenue billion Forecast, by Form 2020 & 2033
- Table 12: Global Polylactic Acid Market Volume Million Forecast, by Form 2020 & 2033
- Table 13: Global Polylactic Acid Market Revenue billion Forecast, by End-user Industry 2020 & 2033
- Table 14: Global Polylactic Acid Market Volume Million Forecast, by End-user Industry 2020 & 2033
- Table 15: Global Polylactic Acid Market Revenue billion Forecast, by Country 2020 & 2033
- Table 16: Global Polylactic Acid Market Volume Million Forecast, by Country 2020 & 2033
- Table 17: China Polylactic Acid Market Revenue (billion) Forecast, by Application 2020 & 2033
- Table 18: China Polylactic Acid Market Volume (Million) Forecast, by Application 2020 & 2033
- Table 19: India Polylactic Acid Market Revenue (billion) Forecast, by Application 2020 & 2033
- Table 20: India Polylactic Acid Market Volume (Million) Forecast, by Application 2020 & 2033
- Table 21: Japan Polylactic Acid Market Revenue (billion) Forecast, by Application 2020 & 2033
- Table 22: Japan Polylactic Acid Market Volume (Million) Forecast, by Application 2020 & 2033
- Table 23: South Korea Polylactic Acid Market Revenue (billion) Forecast, by Application 2020 & 2033
- Table 24: South Korea Polylactic Acid Market Volume (Million) Forecast, by Application 2020 & 2033
- Table 25: ASEAN Countries Polylactic Acid Market Revenue (billion) Forecast, by Application 2020 & 2033
- Table 26: ASEAN Countries Polylactic Acid Market Volume (Million) Forecast, by Application 2020 & 2033
- Table 27: Rest of Asia Pacific Polylactic Acid Market Revenue (billion) Forecast, by Application 2020 & 2033
- Table 28: Rest of Asia Pacific Polylactic Acid Market Volume (Million) Forecast, by Application 2020 & 2033
- Table 29: Global Polylactic Acid Market Revenue billion Forecast, by Raw Material 2020 & 2033
- Table 30: Global Polylactic Acid Market Volume Million Forecast, by Raw Material 2020 & 2033
- Table 31: Global Polylactic Acid Market Revenue billion Forecast, by Form 2020 & 2033
- Table 32: Global Polylactic Acid Market Volume Million Forecast, by Form 2020 & 2033
- Table 33: Global Polylactic Acid Market Revenue billion Forecast, by End-user Industry 2020 & 2033
- Table 34: Global Polylactic Acid Market Volume Million Forecast, by End-user Industry 2020 & 2033
- Table 35: Global Polylactic Acid Market Revenue billion Forecast, by Country 2020 & 2033
- Table 36: Global Polylactic Acid Market Volume Million Forecast, by Country 2020 & 2033
- Table 37: United States Polylactic Acid Market Revenue (billion) Forecast, by Application 2020 & 2033
- Table 38: United States Polylactic Acid Market Volume (Million) Forecast, by Application 2020 & 2033
- Table 39: Canada Polylactic Acid Market Revenue (billion) Forecast, by Application 2020 & 2033
- Table 40: Canada Polylactic Acid Market Volume (Million) Forecast, by Application 2020 & 2033
- Table 41: Mexico Polylactic Acid Market Revenue (billion) Forecast, by Application 2020 & 2033
- Table 42: Mexico Polylactic Acid Market Volume (Million) Forecast, by Application 2020 & 2033
- Table 43: Global Polylactic Acid Market Revenue billion Forecast, by Raw Material 2020 & 2033
- Table 44: Global Polylactic Acid Market Volume Million Forecast, by Raw Material 2020 & 2033
- Table 45: Global Polylactic Acid Market Revenue billion Forecast, by Form 2020 & 2033
- Table 46: Global Polylactic Acid Market Volume Million Forecast, by Form 2020 & 2033
- Table 47: Global Polylactic Acid Market Revenue billion Forecast, by End-user Industry 2020 & 2033
- Table 48: Global Polylactic Acid Market Volume Million Forecast, by End-user Industry 2020 & 2033
- Table 49: Global Polylactic Acid Market Revenue billion Forecast, by Country 2020 & 2033
- Table 50: Global Polylactic Acid Market Volume Million Forecast, by Country 2020 & 2033
- Table 51: Germany Polylactic Acid Market Revenue (billion) Forecast, by Application 2020 & 2033
- Table 52: Germany Polylactic Acid Market Volume (Million) Forecast, by Application 2020 & 2033
- Table 53: United Kingdom Polylactic Acid Market Revenue (billion) Forecast, by Application 2020 & 2033
- Table 54: United Kingdom Polylactic Acid Market Volume (Million) Forecast, by Application 2020 & 2033
- Table 55: France Polylactic Acid Market Revenue (billion) Forecast, by Application 2020 & 2033
- Table 56: France Polylactic Acid Market Volume (Million) Forecast, by Application 2020 & 2033
- Table 57: Italy Polylactic Acid Market Revenue (billion) Forecast, by Application 2020 & 2033
- Table 58: Italy Polylactic Acid Market Volume (Million) Forecast, by Application 2020 & 2033
- Table 59: CIS region Polylactic Acid Market Revenue (billion) Forecast, by Application 2020 & 2033
- Table 60: CIS region Polylactic Acid Market Volume (Million) Forecast, by Application 2020 & 2033
- Table 61: Rest of Europe Polylactic Acid Market Revenue (billion) Forecast, by Application 2020 & 2033
- Table 62: Rest of Europe Polylactic Acid Market Volume (Million) Forecast, by Application 2020 & 2033
- Table 63: Global Polylactic Acid Market Revenue billion Forecast, by Raw Material 2020 & 2033
- Table 64: Global Polylactic Acid Market Volume Million Forecast, by Raw Material 2020 & 2033
- Table 65: Global Polylactic Acid Market Revenue billion Forecast, by Form 2020 & 2033
- Table 66: Global Polylactic Acid Market Volume Million Forecast, by Form 2020 & 2033
- Table 67: Global Polylactic Acid Market Revenue billion Forecast, by End-user Industry 2020 & 2033
- Table 68: Global Polylactic Acid Market Volume Million Forecast, by End-user Industry 2020 & 2033
- Table 69: Global Polylactic Acid Market Revenue billion Forecast, by Country 2020 & 2033
- Table 70: Global Polylactic Acid Market Volume Million Forecast, by Country 2020 & 2033
- Table 71: Brazil Polylactic Acid Market Revenue (billion) Forecast, by Application 2020 & 2033
- Table 72: Brazil Polylactic Acid Market Volume (Million) Forecast, by Application 2020 & 2033
- Table 73: Argentina Polylactic Acid Market Revenue (billion) Forecast, by Application 2020 & 2033
- Table 74: Argentina Polylactic Acid Market Volume (Million) Forecast, by Application 2020 & 2033
- Table 75: Rest of South America Polylactic Acid Market Revenue (billion) Forecast, by Application 2020 & 2033
- Table 76: Rest of South America Polylactic Acid Market Volume (Million) Forecast, by Application 2020 & 2033
- Table 77: Global Polylactic Acid Market Revenue billion Forecast, by Raw Material 2020 & 2033
- Table 78: Global Polylactic Acid Market Volume Million Forecast, by Raw Material 2020 & 2033
- Table 79: Global Polylactic Acid Market Revenue billion Forecast, by Form 2020 & 2033
- Table 80: Global Polylactic Acid Market Volume Million Forecast, by Form 2020 & 2033
- Table 81: Global Polylactic Acid Market Revenue billion Forecast, by End-user Industry 2020 & 2033
- Table 82: Global Polylactic Acid Market Volume Million Forecast, by End-user Industry 2020 & 2033
- Table 83: Global Polylactic Acid Market Revenue billion Forecast, by Country 2020 & 2033
- Table 84: Global Polylactic Acid Market Volume Million Forecast, by Country 2020 & 2033
- Table 85: Saudi Arabia Polylactic Acid Market Revenue (billion) Forecast, by Application 2020 & 2033
- Table 86: Saudi Arabia Polylactic Acid Market Volume (Million) Forecast, by Application 2020 & 2033
- Table 87: South Africa Polylactic Acid Market Revenue (billion) Forecast, by Application 2020 & 2033
- Table 88: South Africa Polylactic Acid Market Volume (Million) Forecast, by Application 2020 & 2033
- Table 89: Rest of Middle East and Africa Polylactic Acid Market Revenue (billion) Forecast, by Application 2020 & 2033
- Table 90: Rest of Middle East and Africa Polylactic Acid Market Volume (Million) Forecast, by Application 2020 & 2033
Frequently Asked Questions
1. What is the projected Compound Annual Growth Rate (CAGR) of the Polylactic Acid Market?
The projected CAGR is approximately 17.5%.
2. Which companies are prominent players in the Polylactic Acid Market?
Key companies in the market include BEWiSynbra Group, Total Corbion PLA, Sulzer Ltd, Musashino Chemical Laboratory Ltd, Futerro, BASF SE, Esun, Zhejiang Hisun Biomaterials Co Ltd*List Not Exhaustive, Shanghai Tong Jie Liang Biomaterials Co Ltd, NatureWorks LLC, Cofco, Polysciences Inc, Weforyou, Jiangxi Keyuan Bio-Material Co Ltd, Danimer Scientific.
3. What are the main segments of the Polylactic Acid Market?
The market segments include Raw Material, Form, End-user Industry.
4. Can you provide details about the market size?
The market size is estimated to be USD 2.01 billion as of 2022.
5. What are some drivers contributing to market growth?
Favorable Government Policies Promoting Bio-plastics; Other Drivers.
6. What are the notable trends driving market growth?
The Packaging Segment is Expected to Dominate the Market.
7. Are there any restraints impacting market growth?
High Price and Other Disadvantages; Other Restraints.
8. Can you provide examples of recent developments in the market?
September 2023: Danimer Scientific has announced its collaboration with Chevron Phillips Chemical to explore the development and commercialization of high-volume biodegradable plastic products using Danimer’s Rinnovo polymers. This partnership aims to boost the company’s profile of PLA-based bioplastic products in the market.
9. What pricing options are available for accessing the report?
Pricing options include single-user, multi-user, and enterprise licenses priced at USD 4750, USD 5250, and USD 8750 respectively.
10. Is the market size provided in terms of value or volume?
The market size is provided in terms of value, measured in billion and volume, measured in Million.
11. Are there any specific market keywords associated with the report?
Yes, the market keyword associated with the report is "Polylactic Acid Market," which aids in identifying and referencing the specific market segment covered.
12. How do I determine which pricing option suits my needs best?
The pricing options vary based on user requirements and access needs. Individual users may opt for single-user licenses, while businesses requiring broader access may choose multi-user or enterprise licenses for cost-effective access to the report.
13. Are there any additional resources or data provided in the Polylactic Acid Market report?
While the report offers comprehensive insights, it's advisable to review the specific contents or supplementary materials provided to ascertain if additional resources or data are available.
14. How can I stay updated on further developments or reports in the Polylactic Acid Market?
To stay informed about further developments, trends, and reports in the Polylactic Acid Market, consider subscribing to industry newsletters, following relevant companies and organizations, or regularly checking reputable industry news sources and publications.
Methodology
Step 1 - Identification of Relevant Samples Size from Population Database


Step 2 - Approaches for Defining Global Market Size (Value, Volume* & Price*)

Note*: In applicable scenarios
Step 3 - Data Sources
Primary Research
- Web Analytics
- Survey Reports
- Research Institute
- Latest Research Reports
- Opinion Leaders
Secondary Research
- Annual Reports
- White Paper
- Latest Press Release
- Industry Association
- Paid Database
- Investor Presentations

Step 4 - Data Triangulation
Involves using different sources of information in order to increase the validity of a study
These sources are likely to be stakeholders in a program - participants, other researchers, program staff, other community members, and so on.
Then we put all data in single framework & apply various statistical tools to find out the dynamic on the market.
During the analysis stage, feedback from the stakeholder groups would be compared to determine areas of agreement as well as areas of divergence