

Key Insights
The global phosphorescent pigments market is poised for significant expansion, driven by escalating demand across a spectrum of industries. Projected to reach $6.88 billion by 2025, the market is anticipated to grow at a robust Compound Annual Growth Rate (CAGR) of 15.73% from 2025 to 2033. Key growth drivers include the increasing integration of phosphorescent pigments in paints and coatings for enhanced safety and visibility, particularly in signage and automotive applications. Expanding use in plastics for novelty glow-in-the-dark products, alongside growing applications in printing inks and textiles for unique aesthetic effects, are further fueling market momentum. Technological innovations enhancing pigment performance, such as extended luminescence persistence and improved brightness, are also contributing to this upward trend. While environmental regulations may present challenges, the market is dominated by high-performing and cost-effective strontium aluminate and zinc sulfide pigments. Significant growth is expected in North America and Asia-Pacific, attributed to their well-established industrial bases and rapidly developing economies.
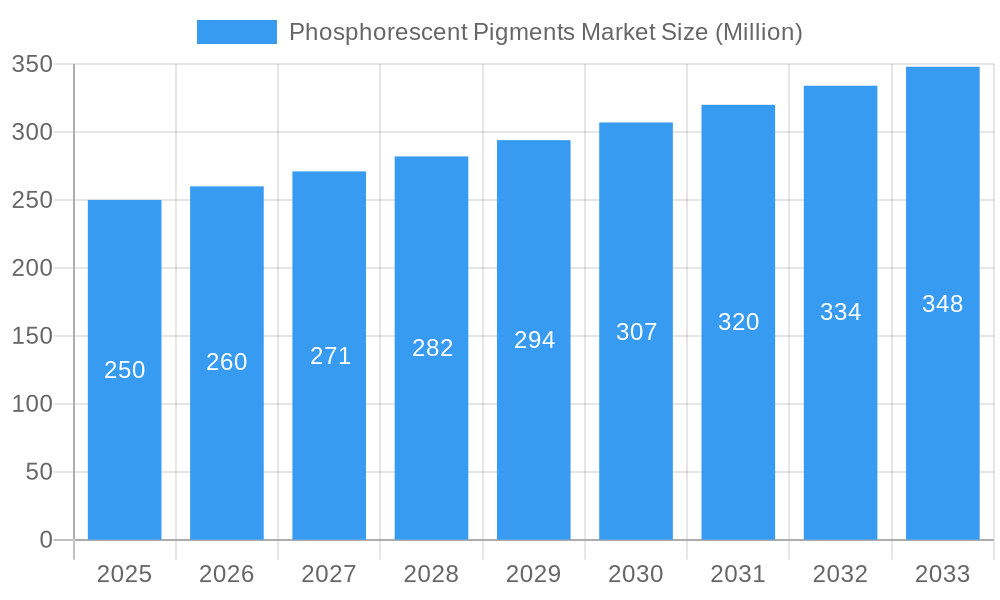
Phosphorescent Pigments Market Market Size (In Billion)
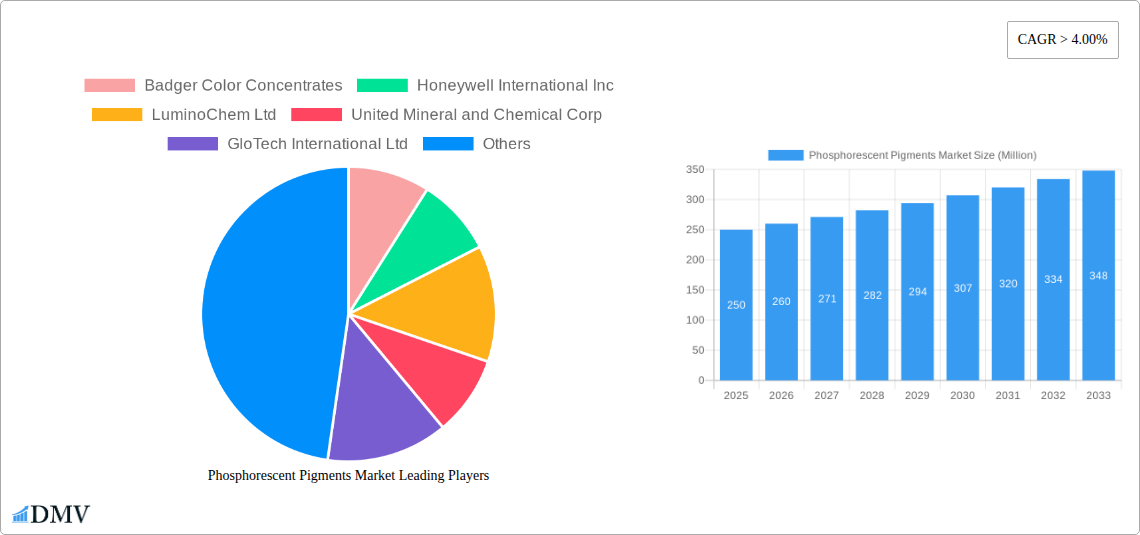
The competitive arena features a blend of established leaders and emerging innovators. Prominent companies such as Badger Color Concentrates, Honeywell International Inc., and LuminoChem Ltd. are actively pursuing product development and strategic alliances to solidify their market positions. Market segmentation by pigment type (Zinc Sulfide, Strontium Aluminate, and Others) and application (Paints & Coatings, Plastics, Printing Inks, Textiles, and Others) offers critical insights into specific growth avenues. Future market evolution will likely be shaped by the development of sustainable phosphorescent pigments, aligning with increasing environmental awareness and stringent regulatory frameworks. The exploration of novel applications in security marking and medical imaging also holds the potential to substantially broaden the market's reach.
Phosphorescent Pigments Market Company Market Share
Phosphorescent Pigments Market: A Comprehensive Report (2019-2033)
This insightful report provides a detailed analysis of the global phosphorescent pigments market, offering a comprehensive overview of market trends, leading players, and future growth prospects. The study period covers 2019-2033, with 2025 serving as the base and estimated year. The forecast period extends from 2025 to 2033, encompassing historical data from 2019-2024. This report is essential for stakeholders seeking to understand the dynamics of this dynamic market and make informed strategic decisions. The market is segmented by type (Zinc Sulfide, Strontium Aluminate, Other Types) and application (Paints & Coatings, Plastics, Printing Inks, Textiles, Other Applications). Key players analyzed include Badger Color Concentrates, Honeywell International Inc, LuminoChem Ltd, United Mineral and Chemical Corp, GloTech International Ltd, Nemoto & Co Ltd, Kremer Pigmente, Nemoto Lumi-Materials Company Limited, Radiant Color NV, and Allureglow International. The report projects a market value of xx Million by 2033.
Phosphorescent Pigments Market Market Composition & Trends
The phosphorescent pigments market exhibits a moderately consolidated structure, with a few major players holding significant market share. The market share distribution is estimated as follows: the top 5 players account for approximately xx% of the global market in 2025, with Honeywell International Inc. leading the pack at approximately xx%. However, the market is witnessing increased competition from smaller, specialized players offering niche products. Innovation is a key driver, with companies focusing on developing pigments with enhanced brightness, longer persistence, and improved environmental profiles. Stringent environmental regulations regarding heavy metal content in pigments are shaping the market, driving the adoption of eco-friendly alternatives. Substitute products, such as fluorescent pigments, pose a competitive threat; however, the unique properties of phosphorescent pigments, including their ability to glow in the dark, continue to drive demand in specific applications. End-users include manufacturers in the paints & coatings, plastics, and printing inks industries, exhibiting diverse needs and preferences. M&A activities in the phosphorescent pigment market have been relatively limited in recent years, with a total deal value of approximately xx Million between 2019 and 2024.
- Market Concentration: Moderately consolidated, top 5 players holding approximately xx% market share in 2025.
- Innovation Catalysts: Development of brighter, longer-lasting, and eco-friendly pigments.
- Regulatory Landscape: Stringent environmental regulations impacting heavy metal use.
- Substitute Products: Fluorescent pigments pose a competitive threat.
- End-User Profiles: Diverse needs across paints & coatings, plastics, and printing inks industries.
- M&A Activities: Limited activity with a total deal value of approximately xx Million (2019-2024).
Phosphorescent Pigments Market Industry Evolution
The phosphorescent pigments market has witnessed steady growth over the past few years, driven primarily by increasing demand from the paints & coatings and plastics sectors. The market exhibited a CAGR of approximately xx% during the historical period (2019-2024). Technological advancements, particularly in the synthesis of new phosphorescent materials and improved particle size control, have significantly enhanced the performance of these pigments. Consumers are increasingly demanding sustainable and eco-friendly products, driving the development of pigments with reduced environmental impact. The adoption of phosphorescent pigments in new applications, such as security printing and displays, is also fueling market expansion. The market is expected to continue its growth trajectory, with a projected CAGR of approximately xx% during the forecast period (2025-2033), reaching a value of xx Million by 2033. This growth will be fueled by ongoing technological innovations, expanding applications, and rising consumer awareness of the unique capabilities of phosphorescent materials.
Leading Regions, Countries, or Segments in Phosphorescent Pigments Market
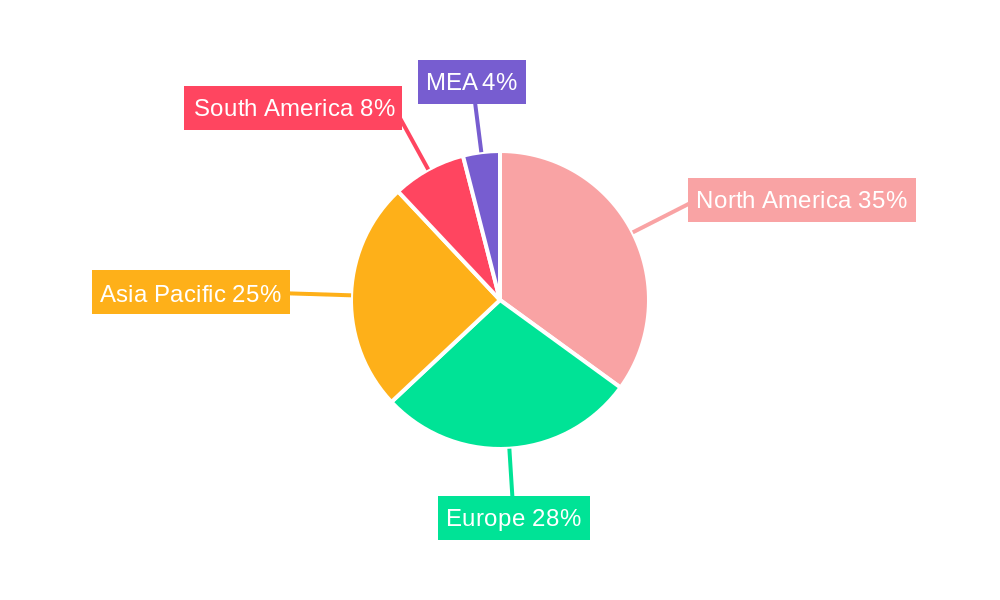
Dominant Region/Segment: North America currently holds the largest market share in 2025, driven by high demand from the paints & coatings sector and strong technological advancements. Within this region, the United States and Canada are key contributors. The Zinc Sulfide segment is the largest type segment in terms of revenue generation and volume consumption. The paints and coatings application dominates across all regions in terms of market size and growth.
Key Drivers (North America):
- Strong demand from paints & coatings sector
- Significant investments in R&D
- Favorable regulatory environment (although evolving).
Dominance Factors: Established manufacturing base in North America contributes to lower production costs and easier supply chain management. North American consumers have high disposable incomes, pushing demand for high-value, quality products.
Other Regions: Asia Pacific is projected to showcase rapid growth in the forecast period due to growing construction activities, increasing industrialization, and rising consumer spending. Europe is another key regional market for these pigments.
Phosphorescent Pigments Market Product Innovations
Recent product innovations focus on enhancing the brightness, persistence, and color range of phosphorescent pigments. New formulations using advanced materials are resulting in pigments with improved light emission efficiency and longer afterglow durations. Advances in nanotechnology have enabled the creation of pigments with enhanced dispersibility and stability, improving performance in various applications. These innovations are expanding the scope of phosphorescent pigments across diverse sectors like automotive lighting and personal safety equipment. The unique selling propositions include improved luminance, extended glow time, and reduced environmental footprint.
Propelling Factors for Phosphorescent Pigments Market Growth
Technological advancements in material science are driving the development of superior phosphorescent pigments with enhanced performance characteristics. The growing demand from diverse end-use industries, such as automotive, construction, and safety equipment, is fueling market expansion. Furthermore, favorable government regulations promoting the use of sustainable materials in various applications contribute to increased market growth.
Obstacles in the Phosphorescent Pigments Market Market
The high cost of manufacturing some phosphorescent pigments presents a significant barrier to entry and broader adoption. Fluctuations in raw material prices can negatively impact profitability. The risk of supply chain disruptions due to geopolitical instability or natural disasters also poses a considerable challenge. Additionally, the presence of substitute products and intense competition among manufacturers add to the challenges.
Future Opportunities in Phosphorescent Pigments Market
The rising demand for energy-efficient lighting solutions creates immense potential for phosphorescent pigments. Developing novel applications in areas like bioimaging and sensor technology promises new avenues for market growth. The increasing focus on eco-friendly and sustainable materials will drive the demand for environmentally benign phosphorescent pigments.
Major Players in the Phosphorescent Pigments Market Ecosystem
- Badger Color Concentrates
- Honeywell International Inc
- LuminoChem Ltd
- United Mineral and Chemical Corp
- GloTech International Ltd
- Nemoto & Co Ltd
- Kremer Pigmente
- Nemoto Lumi-Materials Company Limited
- Radiant Color NV
- Allureglow International
Key Developments in Phosphorescent Pigments Market Industry
- 2022: Honeywell International Inc. launched a new line of high-performance phosphorescent pigments.
- 2023: LuminoChem Ltd. secured a significant investment to expand its manufacturing capabilities.
- 2024: A merger between two smaller phosphorescent pigment manufacturers reshaped the market landscape. (Further details are available in the full report).
Strategic Phosphorescent Pigments Market Market Forecast
The phosphorescent pigments market is poised for significant growth over the forecast period, driven by technological advancements, expanding applications, and increasing consumer demand for sustainable products. The market's future hinges on continued innovation in material science and the exploration of novel applications, promising a robust and dynamic market landscape in the coming years. The market is expected to witness substantial expansion across diverse regions, particularly in developing economies.
Phosphorescent Pigments Market Segmentation
-
1. Type
- 1.1. Zinc Sulfide
- 1.2. Strontium Aluminate
- 1.3. Other Types
-
2. Application
- 2.1. Paints & Coatings
- 2.2. Plastics
- 2.3. Printing Inks
- 2.4. Textiles
- 2.5. Other Application
Phosphorescent Pigments Market Segmentation By Geography
-
1. Asia Pacific
- 1.1. China
- 1.2. India
- 1.3. Japan
- 1.4. South Korea
- 1.5. Rest of Asia Pacific
-
2. North America
- 2.1. United States
- 2.2. Canada
- 2.3. Mexico
-
3. Europe
- 3.1. Germany
- 3.2. United Kingdom
- 3.3. Italy
- 3.4. France
- 3.5. Rest of Europe
-
4. South America
- 4.1. Brazil
- 4.2. Argentina
- 4.3. Rest of South America
- 5. Middle East
-
6. Saudi Arabia
- 6.1. South Africa
- 6.2. Rest of Middle East
Phosphorescent Pigments Market Regional Market Share
Geographic Coverage of Phosphorescent Pigments Market
Phosphorescent Pigments Market REPORT HIGHLIGHTS
| Aspects | Details |
|---|---|
| Study Period | 2020-2034 |
| Base Year | 2025 |
| Estimated Year | 2026 |
| Forecast Period | 2026-2034 |
| Historical Period | 2020-2025 |
| Growth Rate | CAGR of 15.73% from 2020-2034 |
| Segmentation |
|
Table of Contents
- 1. Introduction
- 1.1. Research Scope
- 1.2. Market Segmentation
- 1.3. Research Objective
- 1.4. Definitions and Assumptions
- 2. Executive Summary
- 2.1. Market Snapshot
- 3. Market Dynamics
- 3.1. Market Drivers
- 3.2. Market Restrains
- 3.3. Market Trends
- 3.4. Market Opportunities
- 4. Market Factor Analysis
- 4.1. Porters Five Forces
- 4.1.1. Bargaining Power of Suppliers
- 4.1.2. Bargaining Power of Buyers
- 4.1.3. Threat of New Entrants
- 4.1.4. Threat of Substitutes
- 4.1.5. Competitive Rivalry
- 4.2. PESTEL analysis
- 4.3. BCG Analysis
- 4.3.1. Stars (High Growth, High Market Share)
- 4.3.2. Cash Cows (Low Growth, High Market Share)
- 4.3.3. Question Mark (High Growth, Low Market Share)
- 4.3.4. Dogs (Low Growth, Low Market Share)
- 4.4. Ansoff Matrix Analysis
- 4.5. Supply Chain Analysis
- 4.6. Regulatory Landscape
- 4.7. Current Market Potential and Opportunity Assessment (TAM–SAM–SOM Framework)
- 4.8. DMV Analyst Note
- 4.1. Porters Five Forces
- 5. Market Analysis, Insights and Forecast 2021-2033
- 5.1. Market Analysis, Insights and Forecast - by Type
- 5.1.1. Zinc Sulfide
- 5.1.2. Strontium Aluminate
- 5.1.3. Other Types
- 5.2. Market Analysis, Insights and Forecast - by Application
- 5.2.1. Paints & Coatings
- 5.2.2. Plastics
- 5.2.3. Printing Inks
- 5.2.4. Textiles
- 5.2.5. Other Application
- 5.3. Market Analysis, Insights and Forecast - by Region
- 5.3.1. Asia Pacific
- 5.3.2. North America
- 5.3.3. Europe
- 5.3.4. South America
- 5.3.5. Middle East
- 5.3.6. Saudi Arabia
- 5.1. Market Analysis, Insights and Forecast - by Type
- 6. Global Phosphorescent Pigments Market Analysis, Insights and Forecast, 2021-2033
- 6.1. Market Analysis, Insights and Forecast - by Type
- 6.1.1. Zinc Sulfide
- 6.1.2. Strontium Aluminate
- 6.1.3. Other Types
- 6.2. Market Analysis, Insights and Forecast - by Application
- 6.2.1. Paints & Coatings
- 6.2.2. Plastics
- 6.2.3. Printing Inks
- 6.2.4. Textiles
- 6.2.5. Other Application
- 6.1. Market Analysis, Insights and Forecast - by Type
- 7. Asia Pacific Phosphorescent Pigments Market Analysis, Insights and Forecast, 2020-2032
- 7.1. Market Analysis, Insights and Forecast - by Type
- 7.1.1. Zinc Sulfide
- 7.1.2. Strontium Aluminate
- 7.1.3. Other Types
- 7.2. Market Analysis, Insights and Forecast - by Application
- 7.2.1. Paints & Coatings
- 7.2.2. Plastics
- 7.2.3. Printing Inks
- 7.2.4. Textiles
- 7.2.5. Other Application
- 7.1. Market Analysis, Insights and Forecast - by Type
- 8. North America Phosphorescent Pigments Market Analysis, Insights and Forecast, 2020-2032
- 8.1. Market Analysis, Insights and Forecast - by Type
- 8.1.1. Zinc Sulfide
- 8.1.2. Strontium Aluminate
- 8.1.3. Other Types
- 8.2. Market Analysis, Insights and Forecast - by Application
- 8.2.1. Paints & Coatings
- 8.2.2. Plastics
- 8.2.3. Printing Inks
- 8.2.4. Textiles
- 8.2.5. Other Application
- 8.1. Market Analysis, Insights and Forecast - by Type
- 9. Europe Phosphorescent Pigments Market Analysis, Insights and Forecast, 2020-2032
- 9.1. Market Analysis, Insights and Forecast - by Type
- 9.1.1. Zinc Sulfide
- 9.1.2. Strontium Aluminate
- 9.1.3. Other Types
- 9.2. Market Analysis, Insights and Forecast - by Application
- 9.2.1. Paints & Coatings
- 9.2.2. Plastics
- 9.2.3. Printing Inks
- 9.2.4. Textiles
- 9.2.5. Other Application
- 9.1. Market Analysis, Insights and Forecast - by Type
- 10. South America Phosphorescent Pigments Market Analysis, Insights and Forecast, 2020-2032
- 10.1. Market Analysis, Insights and Forecast - by Type
- 10.1.1. Zinc Sulfide
- 10.1.2. Strontium Aluminate
- 10.1.3. Other Types
- 10.2. Market Analysis, Insights and Forecast - by Application
- 10.2.1. Paints & Coatings
- 10.2.2. Plastics
- 10.2.3. Printing Inks
- 10.2.4. Textiles
- 10.2.5. Other Application
- 10.1. Market Analysis, Insights and Forecast - by Type
- 11. Middle East Phosphorescent Pigments Market Analysis, Insights and Forecast, 2020-2032
- 11.1. Market Analysis, Insights and Forecast - by Type
- 11.1.1. Zinc Sulfide
- 11.1.2. Strontium Aluminate
- 11.1.3. Other Types
- 11.2. Market Analysis, Insights and Forecast - by Application
- 11.2.1. Paints & Coatings
- 11.2.2. Plastics
- 11.2.3. Printing Inks
- 11.2.4. Textiles
- 11.2.5. Other Application
- 11.1. Market Analysis, Insights and Forecast - by Type
- 12. Saudi Arabia Phosphorescent Pigments Market Analysis, Insights and Forecast, 2020-2032
- 12.1. Market Analysis, Insights and Forecast - by Type
- 12.1.1. Zinc Sulfide
- 12.1.2. Strontium Aluminate
- 12.1.3. Other Types
- 12.2. Market Analysis, Insights and Forecast - by Application
- 12.2.1. Paints & Coatings
- 12.2.2. Plastics
- 12.2.3. Printing Inks
- 12.2.4. Textiles
- 12.2.5. Other Application
- 12.1. Market Analysis, Insights and Forecast - by Type
- 13. Competitive Analysis
- 13.1. Company Profiles
- 13.1.1 Badger Color Concentrates
- 13.1.1.1. Company Overview
- 13.1.1.2. Products
- 13.1.1.3. Company Financials
- 13.1.1.4. SWOT Analysis
- 13.1.2 Honeywell International Inc
- 13.1.2.1. Company Overview
- 13.1.2.2. Products
- 13.1.2.3. Company Financials
- 13.1.2.4. SWOT Analysis
- 13.1.3 LuminoChem Ltd
- 13.1.3.1. Company Overview
- 13.1.3.2. Products
- 13.1.3.3. Company Financials
- 13.1.3.4. SWOT Analysis
- 13.1.4 United Mineral and Chemical Corp
- 13.1.4.1. Company Overview
- 13.1.4.2. Products
- 13.1.4.3. Company Financials
- 13.1.4.4. SWOT Analysis
- 13.1.5 GloTech International Ltd
- 13.1.5.1. Company Overview
- 13.1.5.2. Products
- 13.1.5.3. Company Financials
- 13.1.5.4. SWOT Analysis
- 13.1.6 Nemoto & Co Ltd
- 13.1.6.1. Company Overview
- 13.1.6.2. Products
- 13.1.6.3. Company Financials
- 13.1.6.4. SWOT Analysis
- 13.1.7 Kremer Pigmente
- 13.1.7.1. Company Overview
- 13.1.7.2. Products
- 13.1.7.3. Company Financials
- 13.1.7.4. SWOT Analysis
- 13.1.8 Nemoto Lumi-Materials Company Limited
- 13.1.8.1. Company Overview
- 13.1.8.2. Products
- 13.1.8.3. Company Financials
- 13.1.8.4. SWOT Analysis
- 13.1.9 Radiant Color NV
- 13.1.9.1. Company Overview
- 13.1.9.2. Products
- 13.1.9.3. Company Financials
- 13.1.9.4. SWOT Analysis
- 13.1.10 Allureglow International
- 13.1.10.1. Company Overview
- 13.1.10.2. Products
- 13.1.10.3. Company Financials
- 13.1.10.4. SWOT Analysis
- 13.1.1 Badger Color Concentrates
- 13.2. Market Entropy
- 13.2.1 Company's Key Areas Served
- 13.2.2 Recent Developments
- 13.3. Company Market Share Analysis 2025
- 13.3.1 Top 5 Companies Market Share Analysis
- 13.3.2 Top 3 Companies Market Share Analysis
- 13.4. List of Potential Customers
- 14. Research Methodology
List of Figures
- Figure 1: Global Phosphorescent Pigments Market Revenue Breakdown (billion, %) by Region 2025 & 2033
- Figure 2: Global Phosphorescent Pigments Market Volume Breakdown (K Tons, %) by Region 2025 & 2033
- Figure 3: Asia Pacific Phosphorescent Pigments Market Revenue (billion), by Type 2025 & 2033
- Figure 4: Asia Pacific Phosphorescent Pigments Market Volume (K Tons), by Type 2025 & 2033
- Figure 5: Asia Pacific Phosphorescent Pigments Market Revenue Share (%), by Type 2025 & 2033
- Figure 6: Asia Pacific Phosphorescent Pigments Market Volume Share (%), by Type 2025 & 2033
- Figure 7: Asia Pacific Phosphorescent Pigments Market Revenue (billion), by Application 2025 & 2033
- Figure 8: Asia Pacific Phosphorescent Pigments Market Volume (K Tons), by Application 2025 & 2033
- Figure 9: Asia Pacific Phosphorescent Pigments Market Revenue Share (%), by Application 2025 & 2033
- Figure 10: Asia Pacific Phosphorescent Pigments Market Volume Share (%), by Application 2025 & 2033
- Figure 11: Asia Pacific Phosphorescent Pigments Market Revenue (billion), by Country 2025 & 2033
- Figure 12: Asia Pacific Phosphorescent Pigments Market Volume (K Tons), by Country 2025 & 2033
- Figure 13: Asia Pacific Phosphorescent Pigments Market Revenue Share (%), by Country 2025 & 2033
- Figure 14: Asia Pacific Phosphorescent Pigments Market Volume Share (%), by Country 2025 & 2033
- Figure 15: North America Phosphorescent Pigments Market Revenue (billion), by Type 2025 & 2033
- Figure 16: North America Phosphorescent Pigments Market Volume (K Tons), by Type 2025 & 2033
- Figure 17: North America Phosphorescent Pigments Market Revenue Share (%), by Type 2025 & 2033
- Figure 18: North America Phosphorescent Pigments Market Volume Share (%), by Type 2025 & 2033
- Figure 19: North America Phosphorescent Pigments Market Revenue (billion), by Application 2025 & 2033
- Figure 20: North America Phosphorescent Pigments Market Volume (K Tons), by Application 2025 & 2033
- Figure 21: North America Phosphorescent Pigments Market Revenue Share (%), by Application 2025 & 2033
- Figure 22: North America Phosphorescent Pigments Market Volume Share (%), by Application 2025 & 2033
- Figure 23: North America Phosphorescent Pigments Market Revenue (billion), by Country 2025 & 2033
- Figure 24: North America Phosphorescent Pigments Market Volume (K Tons), by Country 2025 & 2033
- Figure 25: North America Phosphorescent Pigments Market Revenue Share (%), by Country 2025 & 2033
- Figure 26: North America Phosphorescent Pigments Market Volume Share (%), by Country 2025 & 2033
- Figure 27: Europe Phosphorescent Pigments Market Revenue (billion), by Type 2025 & 2033
- Figure 28: Europe Phosphorescent Pigments Market Volume (K Tons), by Type 2025 & 2033
- Figure 29: Europe Phosphorescent Pigments Market Revenue Share (%), by Type 2025 & 2033
- Figure 30: Europe Phosphorescent Pigments Market Volume Share (%), by Type 2025 & 2033
- Figure 31: Europe Phosphorescent Pigments Market Revenue (billion), by Application 2025 & 2033
- Figure 32: Europe Phosphorescent Pigments Market Volume (K Tons), by Application 2025 & 2033
- Figure 33: Europe Phosphorescent Pigments Market Revenue Share (%), by Application 2025 & 2033
- Figure 34: Europe Phosphorescent Pigments Market Volume Share (%), by Application 2025 & 2033
- Figure 35: Europe Phosphorescent Pigments Market Revenue (billion), by Country 2025 & 2033
- Figure 36: Europe Phosphorescent Pigments Market Volume (K Tons), by Country 2025 & 2033
- Figure 37: Europe Phosphorescent Pigments Market Revenue Share (%), by Country 2025 & 2033
- Figure 38: Europe Phosphorescent Pigments Market Volume Share (%), by Country 2025 & 2033
- Figure 39: South America Phosphorescent Pigments Market Revenue (billion), by Type 2025 & 2033
- Figure 40: South America Phosphorescent Pigments Market Volume (K Tons), by Type 2025 & 2033
- Figure 41: South America Phosphorescent Pigments Market Revenue Share (%), by Type 2025 & 2033
- Figure 42: South America Phosphorescent Pigments Market Volume Share (%), by Type 2025 & 2033
- Figure 43: South America Phosphorescent Pigments Market Revenue (billion), by Application 2025 & 2033
- Figure 44: South America Phosphorescent Pigments Market Volume (K Tons), by Application 2025 & 2033
- Figure 45: South America Phosphorescent Pigments Market Revenue Share (%), by Application 2025 & 2033
- Figure 46: South America Phosphorescent Pigments Market Volume Share (%), by Application 2025 & 2033
- Figure 47: South America Phosphorescent Pigments Market Revenue (billion), by Country 2025 & 2033
- Figure 48: South America Phosphorescent Pigments Market Volume (K Tons), by Country 2025 & 2033
- Figure 49: South America Phosphorescent Pigments Market Revenue Share (%), by Country 2025 & 2033
- Figure 50: South America Phosphorescent Pigments Market Volume Share (%), by Country 2025 & 2033
- Figure 51: Middle East Phosphorescent Pigments Market Revenue (billion), by Type 2025 & 2033
- Figure 52: Middle East Phosphorescent Pigments Market Volume (K Tons), by Type 2025 & 2033
- Figure 53: Middle East Phosphorescent Pigments Market Revenue Share (%), by Type 2025 & 2033
- Figure 54: Middle East Phosphorescent Pigments Market Volume Share (%), by Type 2025 & 2033
- Figure 55: Middle East Phosphorescent Pigments Market Revenue (billion), by Application 2025 & 2033
- Figure 56: Middle East Phosphorescent Pigments Market Volume (K Tons), by Application 2025 & 2033
- Figure 57: Middle East Phosphorescent Pigments Market Revenue Share (%), by Application 2025 & 2033
- Figure 58: Middle East Phosphorescent Pigments Market Volume Share (%), by Application 2025 & 2033
- Figure 59: Middle East Phosphorescent Pigments Market Revenue (billion), by Country 2025 & 2033
- Figure 60: Middle East Phosphorescent Pigments Market Volume (K Tons), by Country 2025 & 2033
- Figure 61: Middle East Phosphorescent Pigments Market Revenue Share (%), by Country 2025 & 2033
- Figure 62: Middle East Phosphorescent Pigments Market Volume Share (%), by Country 2025 & 2033
- Figure 63: Saudi Arabia Phosphorescent Pigments Market Revenue (billion), by Type 2025 & 2033
- Figure 64: Saudi Arabia Phosphorescent Pigments Market Volume (K Tons), by Type 2025 & 2033
- Figure 65: Saudi Arabia Phosphorescent Pigments Market Revenue Share (%), by Type 2025 & 2033
- Figure 66: Saudi Arabia Phosphorescent Pigments Market Volume Share (%), by Type 2025 & 2033
- Figure 67: Saudi Arabia Phosphorescent Pigments Market Revenue (billion), by Application 2025 & 2033
- Figure 68: Saudi Arabia Phosphorescent Pigments Market Volume (K Tons), by Application 2025 & 2033
- Figure 69: Saudi Arabia Phosphorescent Pigments Market Revenue Share (%), by Application 2025 & 2033
- Figure 70: Saudi Arabia Phosphorescent Pigments Market Volume Share (%), by Application 2025 & 2033
- Figure 71: Saudi Arabia Phosphorescent Pigments Market Revenue (billion), by Country 2025 & 2033
- Figure 72: Saudi Arabia Phosphorescent Pigments Market Volume (K Tons), by Country 2025 & 2033
- Figure 73: Saudi Arabia Phosphorescent Pigments Market Revenue Share (%), by Country 2025 & 2033
- Figure 74: Saudi Arabia Phosphorescent Pigments Market Volume Share (%), by Country 2025 & 2033
List of Tables
- Table 1: Global Phosphorescent Pigments Market Revenue billion Forecast, by Type 2020 & 2033
- Table 2: Global Phosphorescent Pigments Market Volume K Tons Forecast, by Type 2020 & 2033
- Table 3: Global Phosphorescent Pigments Market Revenue billion Forecast, by Application 2020 & 2033
- Table 4: Global Phosphorescent Pigments Market Volume K Tons Forecast, by Application 2020 & 2033
- Table 5: Global Phosphorescent Pigments Market Revenue billion Forecast, by Region 2020 & 2033
- Table 6: Global Phosphorescent Pigments Market Volume K Tons Forecast, by Region 2020 & 2033
- Table 7: Global Phosphorescent Pigments Market Revenue billion Forecast, by Type 2020 & 2033
- Table 8: Global Phosphorescent Pigments Market Volume K Tons Forecast, by Type 2020 & 2033
- Table 9: Global Phosphorescent Pigments Market Revenue billion Forecast, by Application 2020 & 2033
- Table 10: Global Phosphorescent Pigments Market Volume K Tons Forecast, by Application 2020 & 2033
- Table 11: Global Phosphorescent Pigments Market Revenue billion Forecast, by Country 2020 & 2033
- Table 12: Global Phosphorescent Pigments Market Volume K Tons Forecast, by Country 2020 & 2033
- Table 13: China Phosphorescent Pigments Market Revenue (billion) Forecast, by Application 2020 & 2033
- Table 14: China Phosphorescent Pigments Market Volume (K Tons) Forecast, by Application 2020 & 2033
- Table 15: India Phosphorescent Pigments Market Revenue (billion) Forecast, by Application 2020 & 2033
- Table 16: India Phosphorescent Pigments Market Volume (K Tons) Forecast, by Application 2020 & 2033
- Table 17: Japan Phosphorescent Pigments Market Revenue (billion) Forecast, by Application 2020 & 2033
- Table 18: Japan Phosphorescent Pigments Market Volume (K Tons) Forecast, by Application 2020 & 2033
- Table 19: South Korea Phosphorescent Pigments Market Revenue (billion) Forecast, by Application 2020 & 2033
- Table 20: South Korea Phosphorescent Pigments Market Volume (K Tons) Forecast, by Application 2020 & 2033
- Table 21: Rest of Asia Pacific Phosphorescent Pigments Market Revenue (billion) Forecast, by Application 2020 & 2033
- Table 22: Rest of Asia Pacific Phosphorescent Pigments Market Volume (K Tons) Forecast, by Application 2020 & 2033
- Table 23: Global Phosphorescent Pigments Market Revenue billion Forecast, by Type 2020 & 2033
- Table 24: Global Phosphorescent Pigments Market Volume K Tons Forecast, by Type 2020 & 2033
- Table 25: Global Phosphorescent Pigments Market Revenue billion Forecast, by Application 2020 & 2033
- Table 26: Global Phosphorescent Pigments Market Volume K Tons Forecast, by Application 2020 & 2033
- Table 27: Global Phosphorescent Pigments Market Revenue billion Forecast, by Country 2020 & 2033
- Table 28: Global Phosphorescent Pigments Market Volume K Tons Forecast, by Country 2020 & 2033
- Table 29: United States Phosphorescent Pigments Market Revenue (billion) Forecast, by Application 2020 & 2033
- Table 30: United States Phosphorescent Pigments Market Volume (K Tons) Forecast, by Application 2020 & 2033
- Table 31: Canada Phosphorescent Pigments Market Revenue (billion) Forecast, by Application 2020 & 2033
- Table 32: Canada Phosphorescent Pigments Market Volume (K Tons) Forecast, by Application 2020 & 2033
- Table 33: Mexico Phosphorescent Pigments Market Revenue (billion) Forecast, by Application 2020 & 2033
- Table 34: Mexico Phosphorescent Pigments Market Volume (K Tons) Forecast, by Application 2020 & 2033
- Table 35: Global Phosphorescent Pigments Market Revenue billion Forecast, by Type 2020 & 2033
- Table 36: Global Phosphorescent Pigments Market Volume K Tons Forecast, by Type 2020 & 2033
- Table 37: Global Phosphorescent Pigments Market Revenue billion Forecast, by Application 2020 & 2033
- Table 38: Global Phosphorescent Pigments Market Volume K Tons Forecast, by Application 2020 & 2033
- Table 39: Global Phosphorescent Pigments Market Revenue billion Forecast, by Country 2020 & 2033
- Table 40: Global Phosphorescent Pigments Market Volume K Tons Forecast, by Country 2020 & 2033
- Table 41: Germany Phosphorescent Pigments Market Revenue (billion) Forecast, by Application 2020 & 2033
- Table 42: Germany Phosphorescent Pigments Market Volume (K Tons) Forecast, by Application 2020 & 2033
- Table 43: United Kingdom Phosphorescent Pigments Market Revenue (billion) Forecast, by Application 2020 & 2033
- Table 44: United Kingdom Phosphorescent Pigments Market Volume (K Tons) Forecast, by Application 2020 & 2033
- Table 45: Italy Phosphorescent Pigments Market Revenue (billion) Forecast, by Application 2020 & 2033
- Table 46: Italy Phosphorescent Pigments Market Volume (K Tons) Forecast, by Application 2020 & 2033
- Table 47: France Phosphorescent Pigments Market Revenue (billion) Forecast, by Application 2020 & 2033
- Table 48: France Phosphorescent Pigments Market Volume (K Tons) Forecast, by Application 2020 & 2033
- Table 49: Rest of Europe Phosphorescent Pigments Market Revenue (billion) Forecast, by Application 2020 & 2033
- Table 50: Rest of Europe Phosphorescent Pigments Market Volume (K Tons) Forecast, by Application 2020 & 2033
- Table 51: Global Phosphorescent Pigments Market Revenue billion Forecast, by Type 2020 & 2033
- Table 52: Global Phosphorescent Pigments Market Volume K Tons Forecast, by Type 2020 & 2033
- Table 53: Global Phosphorescent Pigments Market Revenue billion Forecast, by Application 2020 & 2033
- Table 54: Global Phosphorescent Pigments Market Volume K Tons Forecast, by Application 2020 & 2033
- Table 55: Global Phosphorescent Pigments Market Revenue billion Forecast, by Country 2020 & 2033
- Table 56: Global Phosphorescent Pigments Market Volume K Tons Forecast, by Country 2020 & 2033
- Table 57: Brazil Phosphorescent Pigments Market Revenue (billion) Forecast, by Application 2020 & 2033
- Table 58: Brazil Phosphorescent Pigments Market Volume (K Tons) Forecast, by Application 2020 & 2033
- Table 59: Argentina Phosphorescent Pigments Market Revenue (billion) Forecast, by Application 2020 & 2033
- Table 60: Argentina Phosphorescent Pigments Market Volume (K Tons) Forecast, by Application 2020 & 2033
- Table 61: Rest of South America Phosphorescent Pigments Market Revenue (billion) Forecast, by Application 2020 & 2033
- Table 62: Rest of South America Phosphorescent Pigments Market Volume (K Tons) Forecast, by Application 2020 & 2033
- Table 63: Global Phosphorescent Pigments Market Revenue billion Forecast, by Type 2020 & 2033
- Table 64: Global Phosphorescent Pigments Market Volume K Tons Forecast, by Type 2020 & 2033
- Table 65: Global Phosphorescent Pigments Market Revenue billion Forecast, by Application 2020 & 2033
- Table 66: Global Phosphorescent Pigments Market Volume K Tons Forecast, by Application 2020 & 2033
- Table 67: Global Phosphorescent Pigments Market Revenue billion Forecast, by Country 2020 & 2033
- Table 68: Global Phosphorescent Pigments Market Volume K Tons Forecast, by Country 2020 & 2033
- Table 69: Global Phosphorescent Pigments Market Revenue billion Forecast, by Type 2020 & 2033
- Table 70: Global Phosphorescent Pigments Market Volume K Tons Forecast, by Type 2020 & 2033
- Table 71: Global Phosphorescent Pigments Market Revenue billion Forecast, by Application 2020 & 2033
- Table 72: Global Phosphorescent Pigments Market Volume K Tons Forecast, by Application 2020 & 2033
- Table 73: Global Phosphorescent Pigments Market Revenue billion Forecast, by Country 2020 & 2033
- Table 74: Global Phosphorescent Pigments Market Volume K Tons Forecast, by Country 2020 & 2033
- Table 75: South Africa Phosphorescent Pigments Market Revenue (billion) Forecast, by Application 2020 & 2033
- Table 76: South Africa Phosphorescent Pigments Market Volume (K Tons) Forecast, by Application 2020 & 2033
- Table 77: Rest of Middle East Phosphorescent Pigments Market Revenue (billion) Forecast, by Application 2020 & 2033
- Table 78: Rest of Middle East Phosphorescent Pigments Market Volume (K Tons) Forecast, by Application 2020 & 2033
Frequently Asked Questions
1. What is the projected Compound Annual Growth Rate (CAGR) of the Phosphorescent Pigments Market?
The projected CAGR is approximately 15.73%.
2. Which companies are prominent players in the Phosphorescent Pigments Market?
Key companies in the market include Badger Color Concentrates, Honeywell International Inc, LuminoChem Ltd, United Mineral and Chemical Corp , GloTech International Ltd, Nemoto & Co Ltd, Kremer Pigmente, Nemoto Lumi-Materials Company Limited, Radiant Color NV, Allureglow International.
3. What are the main segments of the Phosphorescent Pigments Market?
The market segments include Type, Application.
4. Can you provide details about the market size?
The market size is estimated to be USD 6.88 billion as of 2022.
5. What are some drivers contributing to market growth?
; Rising demand from paints & coatings; Increasing product application in signage boards.
6. What are the notable trends driving market growth?
Paints & Coatings Dominating the Phosphorescent Pigments Market Growth.
7. Are there any restraints impacting market growth?
Fluctuating Prices of Nickel and Other Alloying Elements; Other Restraints.
8. Can you provide examples of recent developments in the market?
N/A
9. What pricing options are available for accessing the report?
Pricing options include single-user, multi-user, and enterprise licenses priced at USD 4750, USD 5250, and USD 8750 respectively.
10. Is the market size provided in terms of value or volume?
The market size is provided in terms of value, measured in billion and volume, measured in K Tons.
11. Are there any specific market keywords associated with the report?
Yes, the market keyword associated with the report is "Phosphorescent Pigments Market," which aids in identifying and referencing the specific market segment covered.
12. How do I determine which pricing option suits my needs best?
The pricing options vary based on user requirements and access needs. Individual users may opt for single-user licenses, while businesses requiring broader access may choose multi-user or enterprise licenses for cost-effective access to the report.
13. Are there any additional resources or data provided in the Phosphorescent Pigments Market report?
While the report offers comprehensive insights, it's advisable to review the specific contents or supplementary materials provided to ascertain if additional resources or data are available.
14. How can I stay updated on further developments or reports in the Phosphorescent Pigments Market?
To stay informed about further developments, trends, and reports in the Phosphorescent Pigments Market, consider subscribing to industry newsletters, following relevant companies and organizations, or regularly checking reputable industry news sources and publications.
Methodology
Step 1 - Identification of Relevant Samples Size from Population Database


Step 2 - Approaches for Defining Global Market Size (Value, Volume* & Price*)

Note*: In applicable scenarios
Step 3 - Data Sources
Primary Research
- Web Analytics
- Survey Reports
- Research Institute
- Latest Research Reports
- Opinion Leaders
Secondary Research
- Annual Reports
- White Paper
- Latest Press Release
- Industry Association
- Paid Database
- Investor Presentations

Step 4 - Data Triangulation
Involves using different sources of information in order to increase the validity of a study
These sources are likely to be stakeholders in a program - participants, other researchers, program staff, other community members, and so on.
Then we put all data in single framework & apply various statistical tools to find out the dynamic on the market.
During the analysis stage, feedback from the stakeholder groups would be compared to determine areas of agreement as well as areas of divergence