

Key Insights
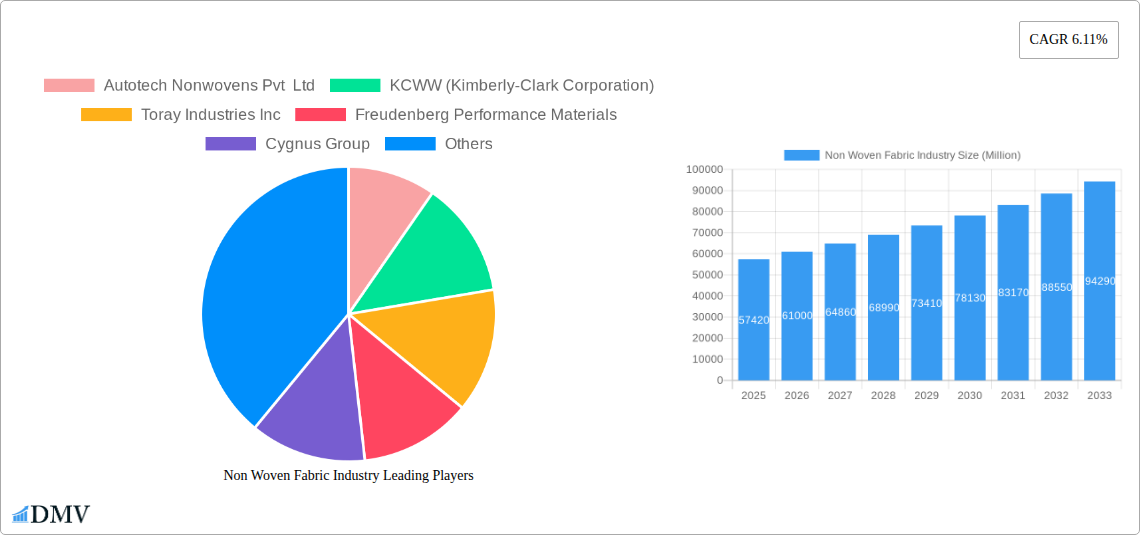
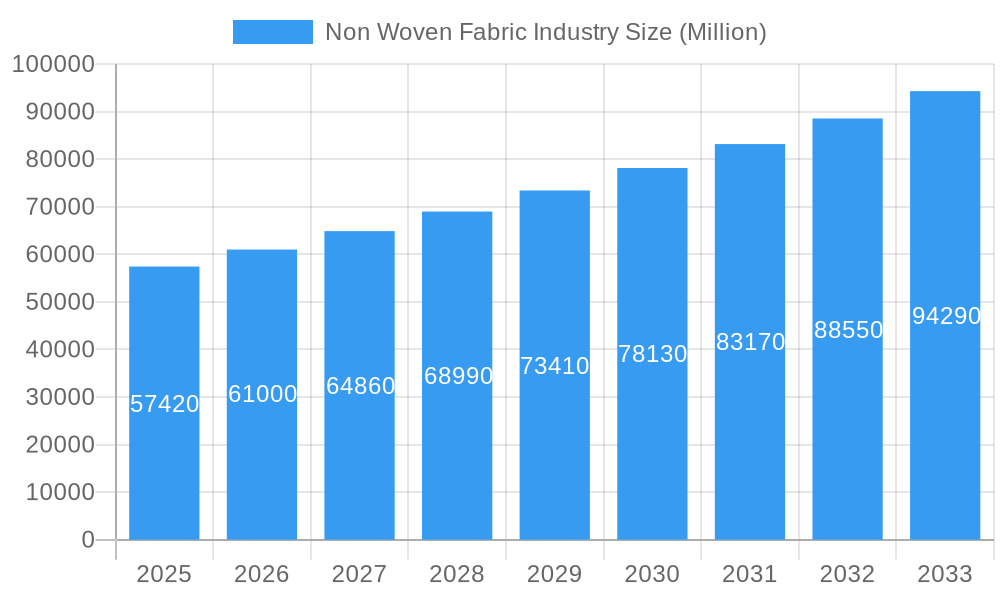
The global non-woven fabric market, valued at $57.42 billion in 2025, is projected to experience robust growth, driven by a compound annual growth rate (CAGR) of 6.11% from 2025 to 2033. This expansion is fueled by several key factors. Firstly, the increasing demand across diverse end-user industries, including construction (for insulation and geotextiles), healthcare (for hygiene products and medical garments), and automotive (for filtration and interior components), is a significant driver. Technological advancements, particularly in spun-bond and meltblown technologies, are enabling the production of non-wovens with enhanced properties like strength, breathability, and filtration efficiency, further stimulating market growth. The rising preference for sustainable and eco-friendly materials is also influencing the market, with greater adoption of bio-based materials like rayon and cotton blends. However, fluctuations in raw material prices and potential environmental concerns related to certain manufacturing processes pose challenges to sustained growth. The market is segmented by technology (spun-bond, wet-laid, dry-laid, meltblown, etc.), material (polyester, polypropylene, polyethylene, rayon, etc.), and end-user industry, offering diverse opportunities for market players. Competition is intense, with both established multinational corporations and regional players vying for market share. Geographic expansion, particularly in developing economies of Asia-Pacific and South America, presents significant potential for future growth.
Non Woven Fabric Industry Market Size (In Billion)
The competitive landscape is characterized by a mix of large multinational corporations like Kimberly-Clark, Toray Industries, and DuPont, alongside specialized regional players like Autotech Nonwovens and PFNonwovens. These companies are focused on innovation, product diversification, and strategic partnerships to maintain their market positions. Future growth will likely be driven by further technological advancements in material science and manufacturing processes, leading to the development of high-performance non-wovens with tailored properties for specific applications. Sustainability will remain a crucial factor, with increased emphasis on recycled materials and environmentally friendly manufacturing practices. Regional market dynamics will also play a crucial role, with variations in demand and regulatory environments influencing market penetration in different regions. The forecast period (2025-2033) suggests significant opportunities for growth, provided companies can effectively address the challenges and capitalize on the emerging trends in the industry.
Non Woven Fabric Industry Company Market Share
Non Woven Fabric Industry Market Report: 2019-2033
This comprehensive report provides a detailed analysis of the Non Woven Fabric industry, projecting a market value of $XXX Million by 2033. The study covers the period 2019-2033, with 2025 as the base and estimated year. This insightful analysis delves into market composition, technological advancements, leading players, and future growth opportunities, equipping stakeholders with actionable intelligence for strategic decision-making. The report features in-depth analysis across various segments including Spun-bond, Meltblown, Polyester, Polypropylene materials, and key end-use industries like Healthcare and Construction.
Non Woven Fabric Industry Market Composition & Trends
This section evaluates the competitive landscape of the Non Woven Fabric market, analyzing market concentration, innovation drivers, regulatory frameworks, and substitution trends. The report explores the impact of mergers and acquisitions (M&A) activities on market dynamics, providing insights into deal values and market share distribution.
- Market Concentration: The industry is characterized by a mix of large multinational corporations and smaller specialized players, leading to a moderately consolidated market. Market share is estimated to be distributed as follows (estimated values): KCWW (Kimberly-Clark Corporation): xx%, Toray Industries Inc: xx%, Freudenberg Performance Materials: xx%, and others sharing the remaining xx%.
- Innovation Catalysts: Significant investments in R&D drive innovation, focusing on sustainable materials like bio-based options and advanced manufacturing processes like meltblown technology for enhanced performance and functionality.
- Regulatory Landscape: Stringent environmental regulations concerning waste management and material sustainability influence product development and manufacturing processes. Compliance costs and the drive for eco-friendly solutions are key factors.
- Substitute Products: The industry faces competition from alternative materials like traditional woven fabrics and other specialized materials depending on the end-use application. However, nonwovens often offer superior performance in specific applications, mitigating this threat.
- End-User Profiles: The report segments end-users across Construction, Textile, Healthcare, Automotive, and other sectors. The Healthcare segment exhibits robust growth due to increased demand for hygiene and medical applications.
- M&A Activities: Recent years have seen several significant M&A deals, with estimated values totaling $XXX Million. These activities aim to expand market reach, enhance product portfolios, and strengthen technological capabilities.
Non Woven Fabric Industry Industry Evolution
This section analyzes the evolution of the Non Woven Fabric industry, tracing market growth trajectories, technological advancements, and shifts in consumer demand from 2019 to 2033. The report details the impact of these factors on market dynamics and provides specific data points, including historical and projected growth rates.
The industry witnessed a Compound Annual Growth Rate (CAGR) of xx% during 2019-2024. This growth is expected to continue, with a projected CAGR of xx% during 2025-2033, driven by increasing demand across diverse applications, particularly in healthcare and construction. Advancements in spun-bond and meltblown technologies have significantly improved product performance and opened up new applications. The shift towards sustainable and eco-friendly materials is reshaping the industry, driving demand for bio-based and recycled nonwovens. Consumer preferences for higher-performing, sustainable, and cost-effective products are influencing product development and market competition.
Leading Regions, Countries, or Segments in Non Woven Fabric Industry
This section identifies the leading regions, countries, and segments within the Non Woven Fabric industry. The analysis considers technology (spun-bond, wet-laid, dry-laid, meltblown), material (polyester, polypropylene, polyethylene, rayon), and end-user industry (construction, textile, healthcare, automotive).
- Dominant Regions/Countries: [Paragraph detailing the dominant regions/countries based on market size and growth drivers, incorporating information about investment trends and regulatory support]. Asia-Pacific is projected to be the leading region due to factors such as rapid industrialization, rising disposable incomes, and a burgeoning healthcare sector.
- Dominant Technology: Spun-bond and meltblown technologies dominate the market due to their cost-effectiveness, versatility, and suitability for various applications. [Paragraph on the drivers for their dominance including innovation and specific applications]
- Dominant Material: Polypropylene holds a significant market share due to its low cost, lightweight nature, and good performance characteristics. [Paragraph analyzing its market share and reasons for dominance]
- Dominant End-User Industry: The healthcare industry drives significant demand for nonwoven fabrics due to their use in hygiene products, medical apparel, and wound care applications. [Paragraph analyzing the specific factors driving the growth of this end-user industry]
Non Woven Fabric Industry Product Innovations
Recent innovations focus on enhancing product performance, sustainability, and cost-effectiveness. The introduction of new materials, such as bio-based polymers and recycled fibers, is driving the development of eco-friendly nonwovens. Advanced manufacturing processes, such as needle-punching and hydroentanglement, are used to create high-performance materials with unique properties. These innovations are expanding the applications of nonwoven fabrics into new sectors. Key innovations include incorporating antimicrobial agents for enhanced hygiene and the development of high-strength, lightweight materials for various applications.
Propelling Factors for Non Woven Fabric Industry Growth
Several factors drive the growth of the nonwoven fabric industry. Technological advancements lead to the creation of innovative products with enhanced functionality. The increasing demand from key end-use sectors, such as healthcare and construction, is a major contributor. Favorable government policies and regulations promoting sustainable materials also contribute to market growth. Furthermore, cost-effectiveness compared to traditional fabrics makes nonwovens an attractive choice for many applications.
Obstacles in the Non Woven Fabric Industry Market
The industry faces challenges including fluctuations in raw material prices, which directly impact production costs. Supply chain disruptions can cause production delays and increase costs. Intense competition among numerous manufacturers creates pressure on pricing and profit margins. Meeting stringent environmental regulations and adhering to sustainable practices adds to the operational costs. These factors collectively impact the overall market dynamics.
Future Opportunities in Non Woven Fabric Industry
Emerging opportunities lie in expanding into new markets, particularly in developing economies with growing demand for nonwoven products. The increasing focus on sustainability opens doors for eco-friendly and biodegradable nonwovens. Technological advancements, such as nanotechnology and smart materials, could lead to the creation of innovative products with enhanced properties. Exploring new applications in sectors like advanced filtration and protective apparel will unlock further growth.
Major Players in the Non Woven Fabric Industry Ecosystem
- Autotech Nonwovens Pvt Ltd
- KCWW (Kimberly-Clark Corporation)
- Toray Industries Inc
- Freudenberg Performance Materials
- Cygnus Group
- TWE Group
- PFNonwovens Czech SRO
- Eximius Incorporation
- Glatfelter
- DuPont
- Ahlstrom-Munksj
- Fitesa
- Johns Manville
- Paramount Tech Fab Industries
- Berry Global Inc
Key Developments in Non Woven Fabric Industry Industry
- June 2022: Asten Johnson announced the creation of its new division named AJ Nonwovens, aiming to boost production capacity and speed in the North American market. This signifies a strategic move to capitalize on market growth opportunities.
- August 2022: Willacoochee Industrial Fabrics, Inc. (WINFAB) invested in a new nonwoven geotextile manufacturing production line in Nashville, GA, expected to commence operation in Q2 2023. This expansion indicates growing demand in the geosynthetics sector.
Strategic Non Woven Fabric Industry Market Forecast
The nonwoven fabric market is poised for significant growth, driven by technological innovation, increasing demand from key end-use industries, and the growing adoption of sustainable materials. The market's future is bright, with significant potential for expansion in developing economies and new applications. Continued investment in R&D and strategic partnerships will be key to success in this dynamic and evolving market. The market is projected to maintain a robust growth trajectory throughout the forecast period (2025-2033).
Non Woven Fabric Industry Segmentation
-
1. Technology
- 1.1. Spun-bond
- 1.2. Wet-laid
- 1.3. Dry-laid
- 1.4. Other Technologies (Meltblown, and others)
-
2. Material
- 2.1. Polyester
- 2.2. Polypropylene
- 2.3. Polyethylene
- 2.4. Rayon (Viscose)
- 2.5. Other Materials (Cotton and other bio based)
-
3. End-user Industry
- 3.1. Construction
- 3.2. Textile
- 3.3. Healthcare
- 3.4. Automotive
- 3.5. Other En
Non Woven Fabric Industry Segmentation By Geography
-
1. Asia Pacific
- 1.1. China
- 1.2. India
- 1.3. Japan
- 1.4. South Korea
- 1.5. Malaysia
- 1.6. Thailand
- 1.7. Indonesia
- 1.8. Vietnam
- 1.9. Rest of Asia Pacific
-
2. North America
- 2.1. United States
- 2.2. Canada
- 2.3. Mexico
-
3. Europe
- 3.1. Germany
- 3.2. United Kingdom
- 3.3. France
- 3.4. Italy
- 3.5. Spain
- 3.6. Turkey
- 3.7. Russia
- 3.8. NORDIC Countries
- 3.9. Rest of Europe
-
4. South America
- 4.1. Brazil
- 4.2. Argentina
- 4.3. Colombia
- 4.4. Rest of South America
-
5. Middle East and Africa
- 5.1. Saudi Arabia
- 5.2. Nigeria
- 5.3. Qatar
- 5.4. Egypt
- 5.5. United Arab Emirates
- 5.6. South Africa
- 5.7. Rest of Middle East and Africa
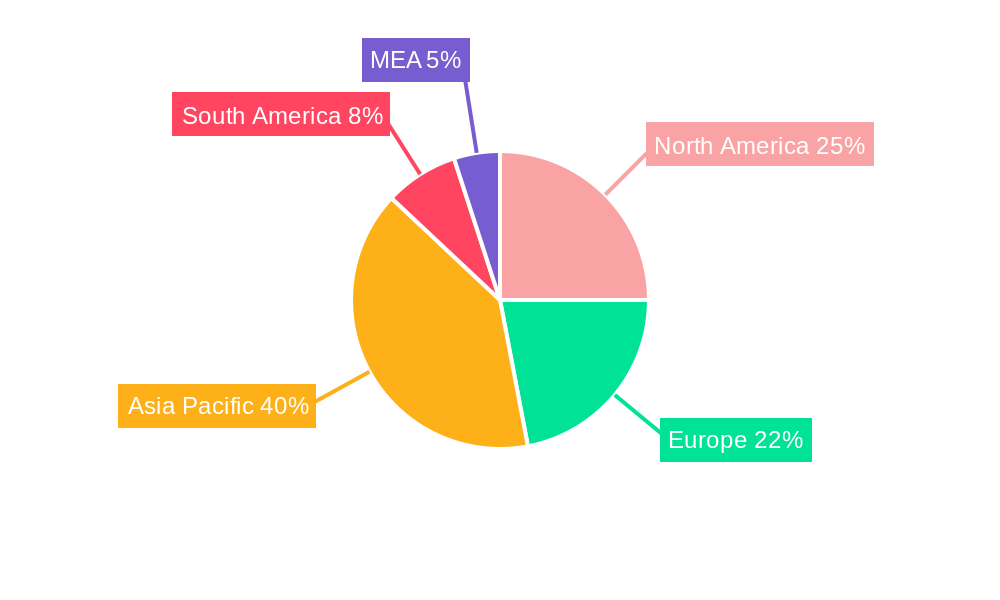
Non Woven Fabric Industry Regional Market Share
Geographic Coverage of Non Woven Fabric Industry
Non Woven Fabric Industry REPORT HIGHLIGHTS
| Aspects | Details |
|---|---|
| Study Period | 2020-2034 |
| Base Year | 2025 |
| Estimated Year | 2026 |
| Forecast Period | 2026-2034 |
| Historical Period | 2020-2025 |
| Growth Rate | CAGR of 6.11% from 2020-2034 |
| Segmentation |
|
Table of Contents
- 1. Introduction
- 1.1. Research Scope
- 1.2. Market Segmentation
- 1.3. Research Objective
- 1.4. Definitions and Assumptions
- 2. Executive Summary
- 2.1. Market Snapshot
- 3. Market Dynamics
- 3.1. Market Drivers
- 3.2. Market Restrains
- 3.3. Market Trends
- 3.4. Market Opportunities
- 4. Market Factor Analysis
- 4.1. Porters Five Forces
- 4.1.1. Bargaining Power of Suppliers
- 4.1.2. Bargaining Power of Buyers
- 4.1.3. Threat of New Entrants
- 4.1.4. Threat of Substitutes
- 4.1.5. Competitive Rivalry
- 4.2. PESTEL analysis
- 4.3. BCG Analysis
- 4.3.1. Stars (High Growth, High Market Share)
- 4.3.2. Cash Cows (Low Growth, High Market Share)
- 4.3.3. Question Mark (High Growth, Low Market Share)
- 4.3.4. Dogs (Low Growth, Low Market Share)
- 4.4. Ansoff Matrix Analysis
- 4.5. Supply Chain Analysis
- 4.6. Regulatory Landscape
- 4.7. Current Market Potential and Opportunity Assessment (TAM–SAM–SOM Framework)
- 4.8. DMV Analyst Note
- 4.1. Porters Five Forces
- 5. Market Analysis, Insights and Forecast 2021-2033
- 5.1. Market Analysis, Insights and Forecast - by Technology
- 5.1.1. Spun-bond
- 5.1.2. Wet-laid
- 5.1.3. Dry-laid
- 5.1.4. Other Technologies (Meltblown, and others)
- 5.2. Market Analysis, Insights and Forecast - by Material
- 5.2.1. Polyester
- 5.2.2. Polypropylene
- 5.2.3. Polyethylene
- 5.2.4. Rayon (Viscose)
- 5.2.5. Other Materials (Cotton and other bio based)
- 5.3. Market Analysis, Insights and Forecast - by End-user Industry
- 5.3.1. Construction
- 5.3.2. Textile
- 5.3.3. Healthcare
- 5.3.4. Automotive
- 5.3.5. Other En
- 5.4. Market Analysis, Insights and Forecast - by Region
- 5.4.1. Asia Pacific
- 5.4.2. North America
- 5.4.3. Europe
- 5.4.4. South America
- 5.4.5. Middle East and Africa
- 5.1. Market Analysis, Insights and Forecast - by Technology
- 6. Global Non Woven Fabric Industry Analysis, Insights and Forecast, 2021-2033
- 6.1. Market Analysis, Insights and Forecast - by Technology
- 6.1.1. Spun-bond
- 6.1.2. Wet-laid
- 6.1.3. Dry-laid
- 6.1.4. Other Technologies (Meltblown, and others)
- 6.2. Market Analysis, Insights and Forecast - by Material
- 6.2.1. Polyester
- 6.2.2. Polypropylene
- 6.2.3. Polyethylene
- 6.2.4. Rayon (Viscose)
- 6.2.5. Other Materials (Cotton and other bio based)
- 6.3. Market Analysis, Insights and Forecast - by End-user Industry
- 6.3.1. Construction
- 6.3.2. Textile
- 6.3.3. Healthcare
- 6.3.4. Automotive
- 6.3.5. Other En
- 6.1. Market Analysis, Insights and Forecast - by Technology
- 7. Asia Pacific Non Woven Fabric Industry Analysis, Insights and Forecast, 2020-2032
- 7.1. Market Analysis, Insights and Forecast - by Technology
- 7.1.1. Spun-bond
- 7.1.2. Wet-laid
- 7.1.3. Dry-laid
- 7.1.4. Other Technologies (Meltblown, and others)
- 7.2. Market Analysis, Insights and Forecast - by Material
- 7.2.1. Polyester
- 7.2.2. Polypropylene
- 7.2.3. Polyethylene
- 7.2.4. Rayon (Viscose)
- 7.2.5. Other Materials (Cotton and other bio based)
- 7.3. Market Analysis, Insights and Forecast - by End-user Industry
- 7.3.1. Construction
- 7.3.2. Textile
- 7.3.3. Healthcare
- 7.3.4. Automotive
- 7.3.5. Other En
- 7.1. Market Analysis, Insights and Forecast - by Technology
- 8. North America Non Woven Fabric Industry Analysis, Insights and Forecast, 2020-2032
- 8.1. Market Analysis, Insights and Forecast - by Technology
- 8.1.1. Spun-bond
- 8.1.2. Wet-laid
- 8.1.3. Dry-laid
- 8.1.4. Other Technologies (Meltblown, and others)
- 8.2. Market Analysis, Insights and Forecast - by Material
- 8.2.1. Polyester
- 8.2.2. Polypropylene
- 8.2.3. Polyethylene
- 8.2.4. Rayon (Viscose)
- 8.2.5. Other Materials (Cotton and other bio based)
- 8.3. Market Analysis, Insights and Forecast - by End-user Industry
- 8.3.1. Construction
- 8.3.2. Textile
- 8.3.3. Healthcare
- 8.3.4. Automotive
- 8.3.5. Other En
- 8.1. Market Analysis, Insights and Forecast - by Technology
- 9. Europe Non Woven Fabric Industry Analysis, Insights and Forecast, 2020-2032
- 9.1. Market Analysis, Insights and Forecast - by Technology
- 9.1.1. Spun-bond
- 9.1.2. Wet-laid
- 9.1.3. Dry-laid
- 9.1.4. Other Technologies (Meltblown, and others)
- 9.2. Market Analysis, Insights and Forecast - by Material
- 9.2.1. Polyester
- 9.2.2. Polypropylene
- 9.2.3. Polyethylene
- 9.2.4. Rayon (Viscose)
- 9.2.5. Other Materials (Cotton and other bio based)
- 9.3. Market Analysis, Insights and Forecast - by End-user Industry
- 9.3.1. Construction
- 9.3.2. Textile
- 9.3.3. Healthcare
- 9.3.4. Automotive
- 9.3.5. Other En
- 9.1. Market Analysis, Insights and Forecast - by Technology
- 10. South America Non Woven Fabric Industry Analysis, Insights and Forecast, 2020-2032
- 10.1. Market Analysis, Insights and Forecast - by Technology
- 10.1.1. Spun-bond
- 10.1.2. Wet-laid
- 10.1.3. Dry-laid
- 10.1.4. Other Technologies (Meltblown, and others)
- 10.2. Market Analysis, Insights and Forecast - by Material
- 10.2.1. Polyester
- 10.2.2. Polypropylene
- 10.2.3. Polyethylene
- 10.2.4. Rayon (Viscose)
- 10.2.5. Other Materials (Cotton and other bio based)
- 10.3. Market Analysis, Insights and Forecast - by End-user Industry
- 10.3.1. Construction
- 10.3.2. Textile
- 10.3.3. Healthcare
- 10.3.4. Automotive
- 10.3.5. Other En
- 10.1. Market Analysis, Insights and Forecast - by Technology
- 11. Middle East and Africa Non Woven Fabric Industry Analysis, Insights and Forecast, 2020-2032
- 11.1. Market Analysis, Insights and Forecast - by Technology
- 11.1.1. Spun-bond
- 11.1.2. Wet-laid
- 11.1.3. Dry-laid
- 11.1.4. Other Technologies (Meltblown, and others)
- 11.2. Market Analysis, Insights and Forecast - by Material
- 11.2.1. Polyester
- 11.2.2. Polypropylene
- 11.2.3. Polyethylene
- 11.2.4. Rayon (Viscose)
- 11.2.5. Other Materials (Cotton and other bio based)
- 11.3. Market Analysis, Insights and Forecast - by End-user Industry
- 11.3.1. Construction
- 11.3.2. Textile
- 11.3.3. Healthcare
- 11.3.4. Automotive
- 11.3.5. Other En
- 11.1. Market Analysis, Insights and Forecast - by Technology
- 12. Competitive Analysis
- 12.1. Company Profiles
- 12.1.1 Autotech Nonwovens Pvt Ltd
- 12.1.1.1. Company Overview
- 12.1.1.2. Products
- 12.1.1.3. Company Financials
- 12.1.1.4. SWOT Analysis
- 12.1.2 KCWW (Kimberly-Clark Corporation)
- 12.1.2.1. Company Overview
- 12.1.2.2. Products
- 12.1.2.3. Company Financials
- 12.1.2.4. SWOT Analysis
- 12.1.3 Toray Industries Inc
- 12.1.3.1. Company Overview
- 12.1.3.2. Products
- 12.1.3.3. Company Financials
- 12.1.3.4. SWOT Analysis
- 12.1.4 Freudenberg Performance Materials
- 12.1.4.1. Company Overview
- 12.1.4.2. Products
- 12.1.4.3. Company Financials
- 12.1.4.4. SWOT Analysis
- 12.1.5 Cygnus Group
- 12.1.5.1. Company Overview
- 12.1.5.2. Products
- 12.1.5.3. Company Financials
- 12.1.5.4. SWOT Analysis
- 12.1.6 TWE Group*List Not Exhaustive
- 12.1.6.1. Company Overview
- 12.1.6.2. Products
- 12.1.6.3. Company Financials
- 12.1.6.4. SWOT Analysis
- 12.1.7 PFNonwovens Czech SRO
- 12.1.7.1. Company Overview
- 12.1.7.2. Products
- 12.1.7.3. Company Financials
- 12.1.7.4. SWOT Analysis
- 12.1.8 Eximius Incorporation
- 12.1.8.1. Company Overview
- 12.1.8.2. Products
- 12.1.8.3. Company Financials
- 12.1.8.4. SWOT Analysis
- 12.1.9 Glatfelter
- 12.1.9.1. Company Overview
- 12.1.9.2. Products
- 12.1.9.3. Company Financials
- 12.1.9.4. SWOT Analysis
- 12.1.10 DuPont
- 12.1.10.1. Company Overview
- 12.1.10.2. Products
- 12.1.10.3. Company Financials
- 12.1.10.4. SWOT Analysis
- 12.1.11 Ahlstrom-Munksj
- 12.1.11.1. Company Overview
- 12.1.11.2. Products
- 12.1.11.3. Company Financials
- 12.1.11.4. SWOT Analysis
- 12.1.12 Fitesa
- 12.1.12.1. Company Overview
- 12.1.12.2. Products
- 12.1.12.3. Company Financials
- 12.1.12.4. SWOT Analysis
- 12.1.13 Johns Manville
- 12.1.13.1. Company Overview
- 12.1.13.2. Products
- 12.1.13.3. Company Financials
- 12.1.13.4. SWOT Analysis
- 12.1.14 Paramount Tech Fab Industries
- 12.1.14.1. Company Overview
- 12.1.14.2. Products
- 12.1.14.3. Company Financials
- 12.1.14.4. SWOT Analysis
- 12.1.15 Berry Global Inc
- 12.1.15.1. Company Overview
- 12.1.15.2. Products
- 12.1.15.3. Company Financials
- 12.1.15.4. SWOT Analysis
- 12.1.1 Autotech Nonwovens Pvt Ltd
- 12.2. Market Entropy
- 12.2.1 Company's Key Areas Served
- 12.2.2 Recent Developments
- 12.3. Company Market Share Analysis 2025
- 12.3.1 Top 5 Companies Market Share Analysis
- 12.3.2 Top 3 Companies Market Share Analysis
- 12.4. List of Potential Customers
- 13. Research Methodology
List of Figures
- Figure 1: Global Non Woven Fabric Industry Revenue Breakdown (Million, %) by Region 2025 & 2033
- Figure 2: Global Non Woven Fabric Industry Volume Breakdown (K Tons, %) by Region 2025 & 2033
- Figure 3: Asia Pacific Non Woven Fabric Industry Revenue (Million), by Technology 2025 & 2033
- Figure 4: Asia Pacific Non Woven Fabric Industry Volume (K Tons), by Technology 2025 & 2033
- Figure 5: Asia Pacific Non Woven Fabric Industry Revenue Share (%), by Technology 2025 & 2033
- Figure 6: Asia Pacific Non Woven Fabric Industry Volume Share (%), by Technology 2025 & 2033
- Figure 7: Asia Pacific Non Woven Fabric Industry Revenue (Million), by Material 2025 & 2033
- Figure 8: Asia Pacific Non Woven Fabric Industry Volume (K Tons), by Material 2025 & 2033
- Figure 9: Asia Pacific Non Woven Fabric Industry Revenue Share (%), by Material 2025 & 2033
- Figure 10: Asia Pacific Non Woven Fabric Industry Volume Share (%), by Material 2025 & 2033
- Figure 11: Asia Pacific Non Woven Fabric Industry Revenue (Million), by End-user Industry 2025 & 2033
- Figure 12: Asia Pacific Non Woven Fabric Industry Volume (K Tons), by End-user Industry 2025 & 2033
- Figure 13: Asia Pacific Non Woven Fabric Industry Revenue Share (%), by End-user Industry 2025 & 2033
- Figure 14: Asia Pacific Non Woven Fabric Industry Volume Share (%), by End-user Industry 2025 & 2033
- Figure 15: Asia Pacific Non Woven Fabric Industry Revenue (Million), by Country 2025 & 2033
- Figure 16: Asia Pacific Non Woven Fabric Industry Volume (K Tons), by Country 2025 & 2033
- Figure 17: Asia Pacific Non Woven Fabric Industry Revenue Share (%), by Country 2025 & 2033
- Figure 18: Asia Pacific Non Woven Fabric Industry Volume Share (%), by Country 2025 & 2033
- Figure 19: North America Non Woven Fabric Industry Revenue (Million), by Technology 2025 & 2033
- Figure 20: North America Non Woven Fabric Industry Volume (K Tons), by Technology 2025 & 2033
- Figure 21: North America Non Woven Fabric Industry Revenue Share (%), by Technology 2025 & 2033
- Figure 22: North America Non Woven Fabric Industry Volume Share (%), by Technology 2025 & 2033
- Figure 23: North America Non Woven Fabric Industry Revenue (Million), by Material 2025 & 2033
- Figure 24: North America Non Woven Fabric Industry Volume (K Tons), by Material 2025 & 2033
- Figure 25: North America Non Woven Fabric Industry Revenue Share (%), by Material 2025 & 2033
- Figure 26: North America Non Woven Fabric Industry Volume Share (%), by Material 2025 & 2033
- Figure 27: North America Non Woven Fabric Industry Revenue (Million), by End-user Industry 2025 & 2033
- Figure 28: North America Non Woven Fabric Industry Volume (K Tons), by End-user Industry 2025 & 2033
- Figure 29: North America Non Woven Fabric Industry Revenue Share (%), by End-user Industry 2025 & 2033
- Figure 30: North America Non Woven Fabric Industry Volume Share (%), by End-user Industry 2025 & 2033
- Figure 31: North America Non Woven Fabric Industry Revenue (Million), by Country 2025 & 2033
- Figure 32: North America Non Woven Fabric Industry Volume (K Tons), by Country 2025 & 2033
- Figure 33: North America Non Woven Fabric Industry Revenue Share (%), by Country 2025 & 2033
- Figure 34: North America Non Woven Fabric Industry Volume Share (%), by Country 2025 & 2033
- Figure 35: Europe Non Woven Fabric Industry Revenue (Million), by Technology 2025 & 2033
- Figure 36: Europe Non Woven Fabric Industry Volume (K Tons), by Technology 2025 & 2033
- Figure 37: Europe Non Woven Fabric Industry Revenue Share (%), by Technology 2025 & 2033
- Figure 38: Europe Non Woven Fabric Industry Volume Share (%), by Technology 2025 & 2033
- Figure 39: Europe Non Woven Fabric Industry Revenue (Million), by Material 2025 & 2033
- Figure 40: Europe Non Woven Fabric Industry Volume (K Tons), by Material 2025 & 2033
- Figure 41: Europe Non Woven Fabric Industry Revenue Share (%), by Material 2025 & 2033
- Figure 42: Europe Non Woven Fabric Industry Volume Share (%), by Material 2025 & 2033
- Figure 43: Europe Non Woven Fabric Industry Revenue (Million), by End-user Industry 2025 & 2033
- Figure 44: Europe Non Woven Fabric Industry Volume (K Tons), by End-user Industry 2025 & 2033
- Figure 45: Europe Non Woven Fabric Industry Revenue Share (%), by End-user Industry 2025 & 2033
- Figure 46: Europe Non Woven Fabric Industry Volume Share (%), by End-user Industry 2025 & 2033
- Figure 47: Europe Non Woven Fabric Industry Revenue (Million), by Country 2025 & 2033
- Figure 48: Europe Non Woven Fabric Industry Volume (K Tons), by Country 2025 & 2033
- Figure 49: Europe Non Woven Fabric Industry Revenue Share (%), by Country 2025 & 2033
- Figure 50: Europe Non Woven Fabric Industry Volume Share (%), by Country 2025 & 2033
- Figure 51: South America Non Woven Fabric Industry Revenue (Million), by Technology 2025 & 2033
- Figure 52: South America Non Woven Fabric Industry Volume (K Tons), by Technology 2025 & 2033
- Figure 53: South America Non Woven Fabric Industry Revenue Share (%), by Technology 2025 & 2033
- Figure 54: South America Non Woven Fabric Industry Volume Share (%), by Technology 2025 & 2033
- Figure 55: South America Non Woven Fabric Industry Revenue (Million), by Material 2025 & 2033
- Figure 56: South America Non Woven Fabric Industry Volume (K Tons), by Material 2025 & 2033
- Figure 57: South America Non Woven Fabric Industry Revenue Share (%), by Material 2025 & 2033
- Figure 58: South America Non Woven Fabric Industry Volume Share (%), by Material 2025 & 2033
- Figure 59: South America Non Woven Fabric Industry Revenue (Million), by End-user Industry 2025 & 2033
- Figure 60: South America Non Woven Fabric Industry Volume (K Tons), by End-user Industry 2025 & 2033
- Figure 61: South America Non Woven Fabric Industry Revenue Share (%), by End-user Industry 2025 & 2033
- Figure 62: South America Non Woven Fabric Industry Volume Share (%), by End-user Industry 2025 & 2033
- Figure 63: South America Non Woven Fabric Industry Revenue (Million), by Country 2025 & 2033
- Figure 64: South America Non Woven Fabric Industry Volume (K Tons), by Country 2025 & 2033
- Figure 65: South America Non Woven Fabric Industry Revenue Share (%), by Country 2025 & 2033
- Figure 66: South America Non Woven Fabric Industry Volume Share (%), by Country 2025 & 2033
- Figure 67: Middle East and Africa Non Woven Fabric Industry Revenue (Million), by Technology 2025 & 2033
- Figure 68: Middle East and Africa Non Woven Fabric Industry Volume (K Tons), by Technology 2025 & 2033
- Figure 69: Middle East and Africa Non Woven Fabric Industry Revenue Share (%), by Technology 2025 & 2033
- Figure 70: Middle East and Africa Non Woven Fabric Industry Volume Share (%), by Technology 2025 & 2033
- Figure 71: Middle East and Africa Non Woven Fabric Industry Revenue (Million), by Material 2025 & 2033
- Figure 72: Middle East and Africa Non Woven Fabric Industry Volume (K Tons), by Material 2025 & 2033
- Figure 73: Middle East and Africa Non Woven Fabric Industry Revenue Share (%), by Material 2025 & 2033
- Figure 74: Middle East and Africa Non Woven Fabric Industry Volume Share (%), by Material 2025 & 2033
- Figure 75: Middle East and Africa Non Woven Fabric Industry Revenue (Million), by End-user Industry 2025 & 2033
- Figure 76: Middle East and Africa Non Woven Fabric Industry Volume (K Tons), by End-user Industry 2025 & 2033
- Figure 77: Middle East and Africa Non Woven Fabric Industry Revenue Share (%), by End-user Industry 2025 & 2033
- Figure 78: Middle East and Africa Non Woven Fabric Industry Volume Share (%), by End-user Industry 2025 & 2033
- Figure 79: Middle East and Africa Non Woven Fabric Industry Revenue (Million), by Country 2025 & 2033
- Figure 80: Middle East and Africa Non Woven Fabric Industry Volume (K Tons), by Country 2025 & 2033
- Figure 81: Middle East and Africa Non Woven Fabric Industry Revenue Share (%), by Country 2025 & 2033
- Figure 82: Middle East and Africa Non Woven Fabric Industry Volume Share (%), by Country 2025 & 2033
List of Tables
- Table 1: Global Non Woven Fabric Industry Revenue Million Forecast, by Technology 2020 & 2033
- Table 2: Global Non Woven Fabric Industry Volume K Tons Forecast, by Technology 2020 & 2033
- Table 3: Global Non Woven Fabric Industry Revenue Million Forecast, by Material 2020 & 2033
- Table 4: Global Non Woven Fabric Industry Volume K Tons Forecast, by Material 2020 & 2033
- Table 5: Global Non Woven Fabric Industry Revenue Million Forecast, by End-user Industry 2020 & 2033
- Table 6: Global Non Woven Fabric Industry Volume K Tons Forecast, by End-user Industry 2020 & 2033
- Table 7: Global Non Woven Fabric Industry Revenue Million Forecast, by Region 2020 & 2033
- Table 8: Global Non Woven Fabric Industry Volume K Tons Forecast, by Region 2020 & 2033
- Table 9: Global Non Woven Fabric Industry Revenue Million Forecast, by Technology 2020 & 2033
- Table 10: Global Non Woven Fabric Industry Volume K Tons Forecast, by Technology 2020 & 2033
- Table 11: Global Non Woven Fabric Industry Revenue Million Forecast, by Material 2020 & 2033
- Table 12: Global Non Woven Fabric Industry Volume K Tons Forecast, by Material 2020 & 2033
- Table 13: Global Non Woven Fabric Industry Revenue Million Forecast, by End-user Industry 2020 & 2033
- Table 14: Global Non Woven Fabric Industry Volume K Tons Forecast, by End-user Industry 2020 & 2033
- Table 15: Global Non Woven Fabric Industry Revenue Million Forecast, by Country 2020 & 2033
- Table 16: Global Non Woven Fabric Industry Volume K Tons Forecast, by Country 2020 & 2033
- Table 17: China Non Woven Fabric Industry Revenue (Million) Forecast, by Application 2020 & 2033
- Table 18: China Non Woven Fabric Industry Volume (K Tons) Forecast, by Application 2020 & 2033
- Table 19: India Non Woven Fabric Industry Revenue (Million) Forecast, by Application 2020 & 2033
- Table 20: India Non Woven Fabric Industry Volume (K Tons) Forecast, by Application 2020 & 2033
- Table 21: Japan Non Woven Fabric Industry Revenue (Million) Forecast, by Application 2020 & 2033
- Table 22: Japan Non Woven Fabric Industry Volume (K Tons) Forecast, by Application 2020 & 2033
- Table 23: South Korea Non Woven Fabric Industry Revenue (Million) Forecast, by Application 2020 & 2033
- Table 24: South Korea Non Woven Fabric Industry Volume (K Tons) Forecast, by Application 2020 & 2033
- Table 25: Malaysia Non Woven Fabric Industry Revenue (Million) Forecast, by Application 2020 & 2033
- Table 26: Malaysia Non Woven Fabric Industry Volume (K Tons) Forecast, by Application 2020 & 2033
- Table 27: Thailand Non Woven Fabric Industry Revenue (Million) Forecast, by Application 2020 & 2033
- Table 28: Thailand Non Woven Fabric Industry Volume (K Tons) Forecast, by Application 2020 & 2033
- Table 29: Indonesia Non Woven Fabric Industry Revenue (Million) Forecast, by Application 2020 & 2033
- Table 30: Indonesia Non Woven Fabric Industry Volume (K Tons) Forecast, by Application 2020 & 2033
- Table 31: Vietnam Non Woven Fabric Industry Revenue (Million) Forecast, by Application 2020 & 2033
- Table 32: Vietnam Non Woven Fabric Industry Volume (K Tons) Forecast, by Application 2020 & 2033
- Table 33: Rest of Asia Pacific Non Woven Fabric Industry Revenue (Million) Forecast, by Application 2020 & 2033
- Table 34: Rest of Asia Pacific Non Woven Fabric Industry Volume (K Tons) Forecast, by Application 2020 & 2033
- Table 35: Global Non Woven Fabric Industry Revenue Million Forecast, by Technology 2020 & 2033
- Table 36: Global Non Woven Fabric Industry Volume K Tons Forecast, by Technology 2020 & 2033
- Table 37: Global Non Woven Fabric Industry Revenue Million Forecast, by Material 2020 & 2033
- Table 38: Global Non Woven Fabric Industry Volume K Tons Forecast, by Material 2020 & 2033
- Table 39: Global Non Woven Fabric Industry Revenue Million Forecast, by End-user Industry 2020 & 2033
- Table 40: Global Non Woven Fabric Industry Volume K Tons Forecast, by End-user Industry 2020 & 2033
- Table 41: Global Non Woven Fabric Industry Revenue Million Forecast, by Country 2020 & 2033
- Table 42: Global Non Woven Fabric Industry Volume K Tons Forecast, by Country 2020 & 2033
- Table 43: United States Non Woven Fabric Industry Revenue (Million) Forecast, by Application 2020 & 2033
- Table 44: United States Non Woven Fabric Industry Volume (K Tons) Forecast, by Application 2020 & 2033
- Table 45: Canada Non Woven Fabric Industry Revenue (Million) Forecast, by Application 2020 & 2033
- Table 46: Canada Non Woven Fabric Industry Volume (K Tons) Forecast, by Application 2020 & 2033
- Table 47: Mexico Non Woven Fabric Industry Revenue (Million) Forecast, by Application 2020 & 2033
- Table 48: Mexico Non Woven Fabric Industry Volume (K Tons) Forecast, by Application 2020 & 2033
- Table 49: Global Non Woven Fabric Industry Revenue Million Forecast, by Technology 2020 & 2033
- Table 50: Global Non Woven Fabric Industry Volume K Tons Forecast, by Technology 2020 & 2033
- Table 51: Global Non Woven Fabric Industry Revenue Million Forecast, by Material 2020 & 2033
- Table 52: Global Non Woven Fabric Industry Volume K Tons Forecast, by Material 2020 & 2033
- Table 53: Global Non Woven Fabric Industry Revenue Million Forecast, by End-user Industry 2020 & 2033
- Table 54: Global Non Woven Fabric Industry Volume K Tons Forecast, by End-user Industry 2020 & 2033
- Table 55: Global Non Woven Fabric Industry Revenue Million Forecast, by Country 2020 & 2033
- Table 56: Global Non Woven Fabric Industry Volume K Tons Forecast, by Country 2020 & 2033
- Table 57: Germany Non Woven Fabric Industry Revenue (Million) Forecast, by Application 2020 & 2033
- Table 58: Germany Non Woven Fabric Industry Volume (K Tons) Forecast, by Application 2020 & 2033
- Table 59: United Kingdom Non Woven Fabric Industry Revenue (Million) Forecast, by Application 2020 & 2033
- Table 60: United Kingdom Non Woven Fabric Industry Volume (K Tons) Forecast, by Application 2020 & 2033
- Table 61: France Non Woven Fabric Industry Revenue (Million) Forecast, by Application 2020 & 2033
- Table 62: France Non Woven Fabric Industry Volume (K Tons) Forecast, by Application 2020 & 2033
- Table 63: Italy Non Woven Fabric Industry Revenue (Million) Forecast, by Application 2020 & 2033
- Table 64: Italy Non Woven Fabric Industry Volume (K Tons) Forecast, by Application 2020 & 2033
- Table 65: Spain Non Woven Fabric Industry Revenue (Million) Forecast, by Application 2020 & 2033
- Table 66: Spain Non Woven Fabric Industry Volume (K Tons) Forecast, by Application 2020 & 2033
- Table 67: Turkey Non Woven Fabric Industry Revenue (Million) Forecast, by Application 2020 & 2033
- Table 68: Turkey Non Woven Fabric Industry Volume (K Tons) Forecast, by Application 2020 & 2033
- Table 69: Russia Non Woven Fabric Industry Revenue (Million) Forecast, by Application 2020 & 2033
- Table 70: Russia Non Woven Fabric Industry Volume (K Tons) Forecast, by Application 2020 & 2033
- Table 71: NORDIC Countries Non Woven Fabric Industry Revenue (Million) Forecast, by Application 2020 & 2033
- Table 72: NORDIC Countries Non Woven Fabric Industry Volume (K Tons) Forecast, by Application 2020 & 2033
- Table 73: Rest of Europe Non Woven Fabric Industry Revenue (Million) Forecast, by Application 2020 & 2033
- Table 74: Rest of Europe Non Woven Fabric Industry Volume (K Tons) Forecast, by Application 2020 & 2033
- Table 75: Global Non Woven Fabric Industry Revenue Million Forecast, by Technology 2020 & 2033
- Table 76: Global Non Woven Fabric Industry Volume K Tons Forecast, by Technology 2020 & 2033
- Table 77: Global Non Woven Fabric Industry Revenue Million Forecast, by Material 2020 & 2033
- Table 78: Global Non Woven Fabric Industry Volume K Tons Forecast, by Material 2020 & 2033
- Table 79: Global Non Woven Fabric Industry Revenue Million Forecast, by End-user Industry 2020 & 2033
- Table 80: Global Non Woven Fabric Industry Volume K Tons Forecast, by End-user Industry 2020 & 2033
- Table 81: Global Non Woven Fabric Industry Revenue Million Forecast, by Country 2020 & 2033
- Table 82: Global Non Woven Fabric Industry Volume K Tons Forecast, by Country 2020 & 2033
- Table 83: Brazil Non Woven Fabric Industry Revenue (Million) Forecast, by Application 2020 & 2033
- Table 84: Brazil Non Woven Fabric Industry Volume (K Tons) Forecast, by Application 2020 & 2033
- Table 85: Argentina Non Woven Fabric Industry Revenue (Million) Forecast, by Application 2020 & 2033
- Table 86: Argentina Non Woven Fabric Industry Volume (K Tons) Forecast, by Application 2020 & 2033
- Table 87: Colombia Non Woven Fabric Industry Revenue (Million) Forecast, by Application 2020 & 2033
- Table 88: Colombia Non Woven Fabric Industry Volume (K Tons) Forecast, by Application 2020 & 2033
- Table 89: Rest of South America Non Woven Fabric Industry Revenue (Million) Forecast, by Application 2020 & 2033
- Table 90: Rest of South America Non Woven Fabric Industry Volume (K Tons) Forecast, by Application 2020 & 2033
- Table 91: Global Non Woven Fabric Industry Revenue Million Forecast, by Technology 2020 & 2033
- Table 92: Global Non Woven Fabric Industry Volume K Tons Forecast, by Technology 2020 & 2033
- Table 93: Global Non Woven Fabric Industry Revenue Million Forecast, by Material 2020 & 2033
- Table 94: Global Non Woven Fabric Industry Volume K Tons Forecast, by Material 2020 & 2033
- Table 95: Global Non Woven Fabric Industry Revenue Million Forecast, by End-user Industry 2020 & 2033
- Table 96: Global Non Woven Fabric Industry Volume K Tons Forecast, by End-user Industry 2020 & 2033
- Table 97: Global Non Woven Fabric Industry Revenue Million Forecast, by Country 2020 & 2033
- Table 98: Global Non Woven Fabric Industry Volume K Tons Forecast, by Country 2020 & 2033
- Table 99: Saudi Arabia Non Woven Fabric Industry Revenue (Million) Forecast, by Application 2020 & 2033
- Table 100: Saudi Arabia Non Woven Fabric Industry Volume (K Tons) Forecast, by Application 2020 & 2033
- Table 101: Nigeria Non Woven Fabric Industry Revenue (Million) Forecast, by Application 2020 & 2033
- Table 102: Nigeria Non Woven Fabric Industry Volume (K Tons) Forecast, by Application 2020 & 2033
- Table 103: Qatar Non Woven Fabric Industry Revenue (Million) Forecast, by Application 2020 & 2033
- Table 104: Qatar Non Woven Fabric Industry Volume (K Tons) Forecast, by Application 2020 & 2033
- Table 105: Egypt Non Woven Fabric Industry Revenue (Million) Forecast, by Application 2020 & 2033
- Table 106: Egypt Non Woven Fabric Industry Volume (K Tons) Forecast, by Application 2020 & 2033
- Table 107: United Arab Emirates Non Woven Fabric Industry Revenue (Million) Forecast, by Application 2020 & 2033
- Table 108: United Arab Emirates Non Woven Fabric Industry Volume (K Tons) Forecast, by Application 2020 & 2033
- Table 109: South Africa Non Woven Fabric Industry Revenue (Million) Forecast, by Application 2020 & 2033
- Table 110: South Africa Non Woven Fabric Industry Volume (K Tons) Forecast, by Application 2020 & 2033
- Table 111: Rest of Middle East and Africa Non Woven Fabric Industry Revenue (Million) Forecast, by Application 2020 & 2033
- Table 112: Rest of Middle East and Africa Non Woven Fabric Industry Volume (K Tons) Forecast, by Application 2020 & 2033
Frequently Asked Questions
1. What is the projected Compound Annual Growth Rate (CAGR) of the Non Woven Fabric Industry?
The projected CAGR is approximately 6.11%.
2. Which companies are prominent players in the Non Woven Fabric Industry?
Key companies in the market include Autotech Nonwovens Pvt Ltd, KCWW (Kimberly-Clark Corporation), Toray Industries Inc, Freudenberg Performance Materials, Cygnus Group, TWE Group*List Not Exhaustive, PFNonwovens Czech SRO, Eximius Incorporation, Glatfelter, DuPont, Ahlstrom-Munksj, Fitesa, Johns Manville, Paramount Tech Fab Industries, Berry Global Inc.
3. What are the main segments of the Non Woven Fabric Industry?
The market segments include Technology, Material, End-user Industry.
4. Can you provide details about the market size?
The market size is estimated to be USD 57.42 Million as of 2022.
5. What are some drivers contributing to market growth?
Increasing Application in the Healthcare Industry; Growing Demand for Electric Vehicles; Other Drivers.
6. What are the notable trends driving market growth?
Increasing Demand from the Healthcare Industry.
7. Are there any restraints impacting market growth?
Low Durability and Strength of Fabric; Other Restraints.
8. Can you provide examples of recent developments in the market?
August 2022: Willacoochee Industrial Fabrics, Inc. (WINFAB), one of the leading manufacturers of geosynthetic and erosion control products in the United States, announced its investment into a new state-of-the-art nonwoven geotextile manufacturing production line in Nashville, GA. The production line was anticipated to begin operation by the second quarter of 2023.
9. What pricing options are available for accessing the report?
Pricing options include single-user, multi-user, and enterprise licenses priced at USD 4750, USD 5250, and USD 8750 respectively.
10. Is the market size provided in terms of value or volume?
The market size is provided in terms of value, measured in Million and volume, measured in K Tons.
11. Are there any specific market keywords associated with the report?
Yes, the market keyword associated with the report is "Non Woven Fabric Industry," which aids in identifying and referencing the specific market segment covered.
12. How do I determine which pricing option suits my needs best?
The pricing options vary based on user requirements and access needs. Individual users may opt for single-user licenses, while businesses requiring broader access may choose multi-user or enterprise licenses for cost-effective access to the report.
13. Are there any additional resources or data provided in the Non Woven Fabric Industry report?
While the report offers comprehensive insights, it's advisable to review the specific contents or supplementary materials provided to ascertain if additional resources or data are available.
14. How can I stay updated on further developments or reports in the Non Woven Fabric Industry?
To stay informed about further developments, trends, and reports in the Non Woven Fabric Industry, consider subscribing to industry newsletters, following relevant companies and organizations, or regularly checking reputable industry news sources and publications.
Methodology
Step 1 - Identification of Relevant Samples Size from Population Database


Step 2 - Approaches for Defining Global Market Size (Value, Volume* & Price*)

Note*: In applicable scenarios
Step 3 - Data Sources
Primary Research
- Web Analytics
- Survey Reports
- Research Institute
- Latest Research Reports
- Opinion Leaders
Secondary Research
- Annual Reports
- White Paper
- Latest Press Release
- Industry Association
- Paid Database
- Investor Presentations

Step 4 - Data Triangulation
Involves using different sources of information in order to increase the validity of a study
These sources are likely to be stakeholders in a program - participants, other researchers, program staff, other community members, and so on.
Then we put all data in single framework & apply various statistical tools to find out the dynamic on the market.
During the analysis stage, feedback from the stakeholder groups would be compared to determine areas of agreement as well as areas of divergence