

Key Insights
The Non-Halogenated Flame Retardants (NHFR) market is experiencing significant expansion, propelled by stringent regulations targeting halogenated flame retardants due to environmental and health concerns. The market, projected to reach $10.59 billion by 2025, is forecast to grow at a Compound Annual Growth Rate (CAGR) of 12.02% through 2033. This growth is attributed to escalating fire safety demands across key sectors including electronics, construction, and transportation, alongside the increasing adoption of sustainable and eco-friendly materials. Organic NHFRs are gaining prominence for their superior performance and environmental advantages over inorganic alternatives. Within the organic category, phosphorus-based compounds are a dominant segment, valued for their efficacy and broad applicability. The Asia-Pacific region, led by China and India, is a primary growth engine, driven by rapid industrialization and urbanization. Challenges include the higher cost of NHFRs compared to halogenated options and ongoing research to enhance their performance in specialized applications. Intense competition characterizes the market, with companies prioritizing innovation, strategic alliances, and global expansion.
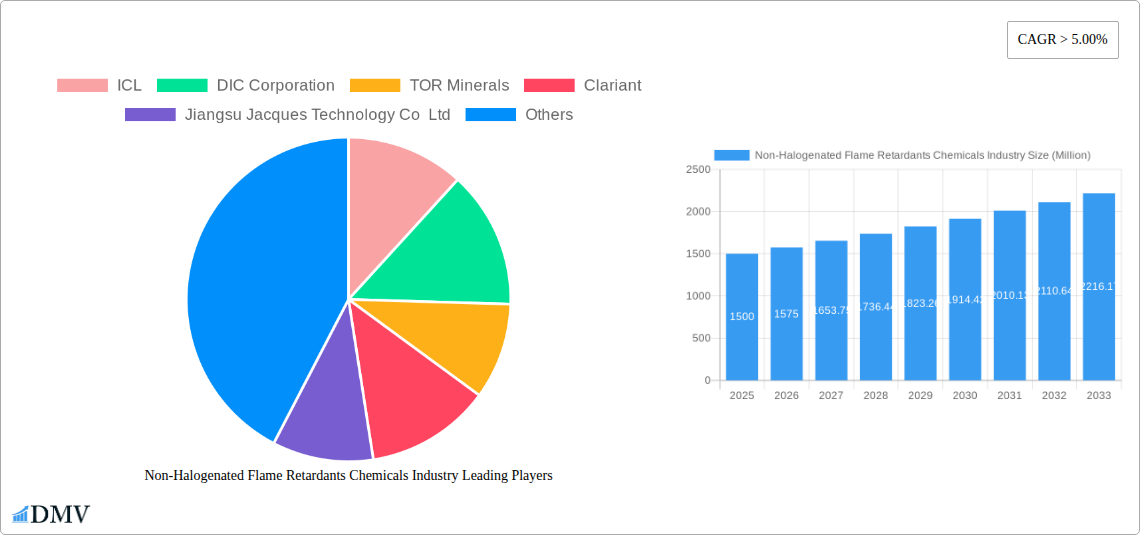
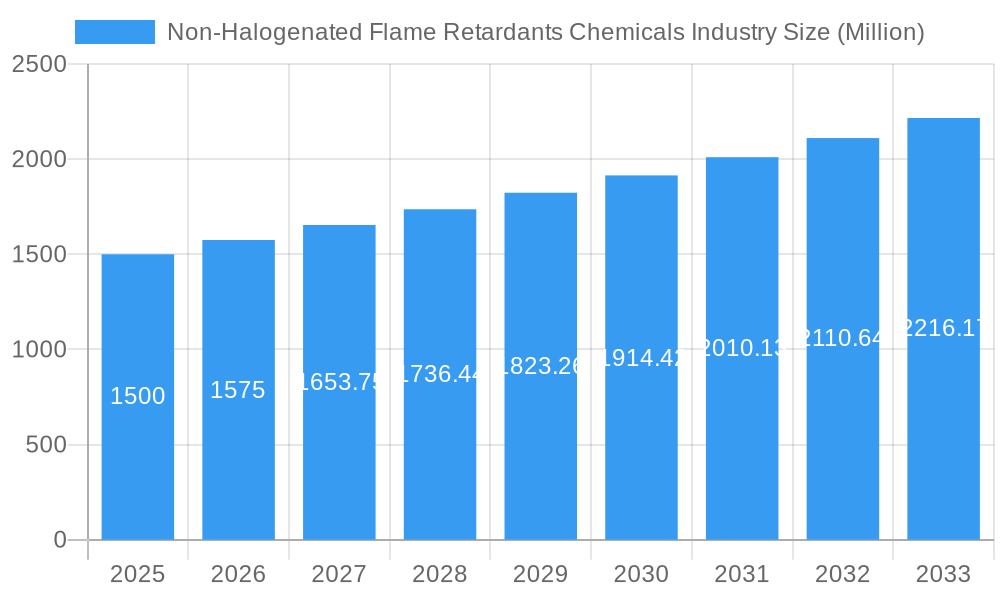
Non-Halogenated Flame Retardants Chemicals Industry Market Size (In Billion)
Market segmentation highlights key opportunities within the NHFR landscape. The inorganic segment, while established, retains importance in specific niche applications. Among organic types, phosphorus and nitrogen compounds are leading growth, with ongoing exploration of alternative materials. The electrical and electronics sector is the largest end-user, followed by buildings and construction, and transportation, each presenting distinct requirements and solutions. North America and Europe currently represent the largest markets, owing to stringent safety regulations and heightened awareness. However, Asia-Pacific is anticipated for substantial growth, offering lucrative prospects for manufacturers focused on cost-effective solutions and the region's burgeoning industrial base. The upcoming forecast period will emphasize material science advancements to improve NHFR performance and versatility, alongside initiatives to reduce costs and enhance processing efficiency.
Non-Halogenated Flame Retardants Chemicals Industry Company Market Share
Non-Halogenated Flame Retardants Chemicals Industry Market Report: 2019-2033
This comprehensive report provides an in-depth analysis of the Non-Halogenated Flame Retardants Chemicals industry, offering valuable insights for stakeholders seeking to navigate this dynamic market. Covering the period from 2019 to 2033, with a base year of 2025 and a forecast period from 2025 to 2033, this report delivers a complete overview of market trends, competitive landscapes, and future growth prospects. The market is expected to reach xx Million by 2033, growing at a CAGR of xx% during the forecast period.
Non-Halogenated Flame Retardants Chemicals Industry Market Composition & Trends
This section evaluates the current market dynamics of the Non-Halogenated Flame Retardants Chemicals industry, focusing on market concentration, innovation, regulations, substitutes, end-users, and mergers & acquisitions (M&A). The market is characterized by a moderately concentrated structure, with key players like ICL, Clariant, and BASF SE holding significant market shares. However, the presence of numerous smaller players, particularly in regional markets, ensures competition. Innovation in this sector is driven by stringent regulations aimed at phasing out harmful halogenated compounds and a growing need for eco-friendly alternatives. The regulatory landscape varies globally, with some regions adopting stricter rules than others, influencing market growth and product development. Substitute materials, such as mineral fillers and intumescent coatings, pose a competitive threat, while the industry's success is heavily reliant on diverse end-user sectors. M&A activities have played a crucial role in market consolidation, with deal values reaching xx Million in recent years.
- Market Share Distribution (2024): ICL (xx%), Clariant (xx%), BASF SE (xx%), Others (xx%)
- Recent M&A Activity: Acquisition of [Company A] by [Company B] for xx Million (2023).
Non-Halogenated Flame Retardants Chemicals Industry Industry Evolution
The Non-Halogenated Flame Retardants Chemicals industry has witnessed significant evolution over the past decade, driven by technological advancements, changing consumer preferences, and stricter environmental regulations. The global market experienced a substantial surge between 2019 and 2024, fueled by rising demand from the electrical and electronics, building and construction, and transportation sectors. This growth reflects the increasing adoption of non-halogenated flame retardants as safer and more environmentally friendly alternatives to their halogenated counterparts. Technological advancements, such as the development of novel phosphorus-based and nitrogen-based flame retardants with improved performance characteristics, further enhanced market growth. Consumer demand for safer and sustainable products has also played a pivotal role, pushing manufacturers to innovate and develop environmentally responsible solutions. The market is anticipated to continue its upward trajectory, driven by factors like urbanization, industrialization, and the growing awareness of fire safety. The CAGR for the period 2025-2033 is estimated at xx%, indicating robust and sustained growth.
Leading Regions, Countries, or Segments in Non-Halogenated Flame Retardants Chemicals Industry
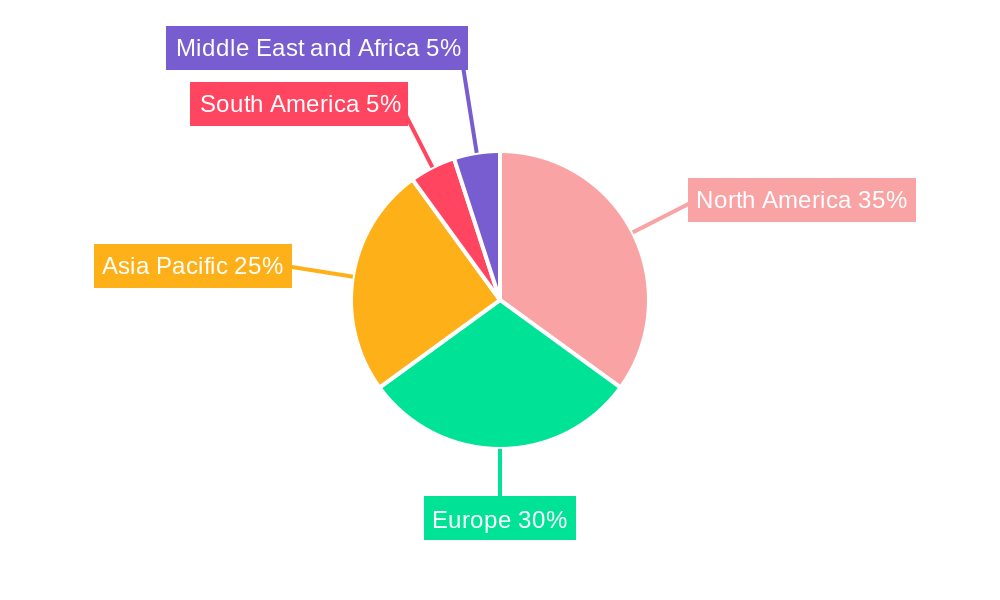
The Non-Halogenated Flame Retardants Chemicals market exhibits regional variations in growth and dominance. The Asia-Pacific region, particularly China and India, currently holds a leading position, driven by rapid industrialization, infrastructure development, and increasing demand from electronics manufacturing. Europe and North America also show significant market presence, though growth rates might be slightly lower than in Asia-Pacific.
- Dominant Region: Asia-Pacific
- Key Drivers (Asia-Pacific):
- Rapid industrialization and urbanization.
- Significant investments in infrastructure projects.
- Stringent environmental regulations promoting the adoption of safer alternatives.
- Growing electronics manufacturing sector.
- Dominant Segment (by Type): Inorganic flame retardants currently hold the largest market share due to their cost-effectiveness and wide applicability. However, organic flame retardants are projected to witness faster growth during the forecast period driven by their superior performance characteristics.
- Dominant End-User Industry: The Electrical and Electronics sector leads the demand for non-halogenated flame retardants, followed by the building and construction industry.
Non-Halogenated Flame Retardants Chemicals Industry Product Innovations
Recent years have witnessed the introduction of innovative non-halogenated flame retardants with enhanced performance characteristics and broader applicability. These include novel phosphorus-based and nitrogen-based compounds exhibiting improved thermal stability, reduced toxicity, and enhanced flame retardancy. The focus is on developing environmentally friendly and high-performance materials that meet increasingly stringent regulatory requirements and cater to the diverse needs of various end-user industries. These advancements translate to enhanced fire safety and reduced environmental impact.
Propelling Factors for Non-Halogenated Flame Retardants Chemicals Industry Growth
The growth of the Non-Halogenated Flame Retardants Chemicals market is driven by several factors: rising demand from diverse end-user industries such as electronics and construction; stringent environmental regulations phasing out hazardous halogenated alternatives; increasing awareness of fire safety; and continuous technological advancements leading to improved product performance and cost-effectiveness. Government initiatives promoting sustainable materials also play a vital role.
Obstacles in the Non-Halogenated Flame Retardants Chemicals Industry Market
Several challenges hinder the growth of this market. Fluctuations in raw material prices and supply chain disruptions can impact production costs and market stability. Intense competition among established players and emerging companies puts pressure on pricing and profitability. Stricter environmental regulations, while driving demand for non-halogenated alternatives, also impose significant compliance costs on manufacturers.
Future Opportunities in Non-Halogenated Flame Retardants Chemicals Industry
Future opportunities lie in developing high-performance, eco-friendly flame retardants tailored to specific end-user applications. Expanding into emerging markets with stringent fire safety standards, and exploring innovative applications in areas like renewable energy and electric vehicles are promising avenues for growth.
Major Players in the Non-Halogenated Flame Retardants Chemicals Industry Ecosystem
- ICL
- DIC Corporation
- TOR Minerals
- Clariant
- Jiangsu Jacques Technology Co Ltd
- MPI Chemie BV
- Italmatch Chemicals SpA
- LANXESS
- Nippon Carbide Industries Co Inc (Sanwa Chemical Industry Co Ltd)
- BASF SE
- Rin Kagaku Kogyo Co Ltd
- Shandong Brother Sci &Tech Co Ltd
- Nabaltec AG
- Thor
- Eti Maden
- Apexical Inc
- NYACOL Nano Technologies Inc
- Huber Engineered Materials
- Daihachi Chemical Industry Co Ltd
Key Developments in Non-Halogenated Flame Retardants Chemicals Industry Industry
- Jan 2023: Clariant launched a new range of phosphorus-based flame retardants.
- May 2022: ICL acquired a smaller flame retardant manufacturer, expanding its market share.
- Oct 2021: New regulations on flame retardants came into effect in the EU.
- (Add more specific developments with dates as they become available)
Strategic Non-Halogenated Flame Retardants Chemicals Industry Market Forecast
The Non-Halogenated Flame Retardants Chemicals market is poised for sustained growth, driven by factors like increasing demand from key end-user sectors, stringent environmental regulations, and technological advancements. The market is expected to witness considerable expansion during the forecast period, offering significant opportunities for existing and new players. Strategic partnerships, product diversification, and focus on sustainable solutions will be crucial for success in this competitive landscape.
Non-Halogenated Flame Retardants Chemicals Industry Segmentation
-
1. Type
-
1.1. Inorganic
- 1.1.1. Aluminum Hydroxide
- 1.1.2. Magnesium Hydroxide
- 1.1.3. Boron Compounds
- 1.2. Phosphorus
- 1.3. Nitrogen
- 1.4. Other Types
-
1.1. Inorganic
-
2. End-user Industry
- 2.1. Electrical and Electronics
- 2.2. Buildings and Construction
- 2.3. Transportation
- 2.4. Textiles and Furniture
Non-Halogenated Flame Retardants Chemicals Industry Segmentation By Geography
-
1. Asia Pacific
- 1.1. China
- 1.2. India
- 1.3. Japan
- 1.4. South Korea
- 1.5. Rest of Asia Pacific
-
2. North America
- 2.1. United States
- 2.2. Canada
- 2.3. Mexico
-
3. Europe
- 3.1. Germany
- 3.2. United Kingdom
- 3.3. Italy
- 3.4. France
- 3.5. Rest of Europe
-
4. South America
- 4.1. Brazil
- 4.2. Argentina
- 4.3. Rest of South America
-
5. Middle East and Africa
- 5.1. Saudi Arabia
- 5.2. South Africa
- 5.3. Rest of Middle East and Africa
Non-Halogenated Flame Retardants Chemicals Industry Regional Market Share
Geographic Coverage of Non-Halogenated Flame Retardants Chemicals Industry
Non-Halogenated Flame Retardants Chemicals Industry REPORT HIGHLIGHTS
| Aspects | Details |
|---|---|
| Study Period | 2020-2034 |
| Base Year | 2025 |
| Estimated Year | 2026 |
| Forecast Period | 2026-2034 |
| Historical Period | 2020-2025 |
| Growth Rate | CAGR of 12.02% from 2020-2034 |
| Segmentation |
|
Table of Contents
- 1. Introduction
- 1.1. Research Scope
- 1.2. Market Segmentation
- 1.3. Research Objective
- 1.4. Definitions and Assumptions
- 2. Executive Summary
- 2.1. Market Snapshot
- 3. Market Dynamics
- 3.1. Market Drivers
- 3.2. Market Restrains
- 3.3. Market Trends
- 3.4. Market Opportunities
- 4. Market Factor Analysis
- 4.1. Porters Five Forces
- 4.1.1. Bargaining Power of Suppliers
- 4.1.2. Bargaining Power of Buyers
- 4.1.3. Threat of New Entrants
- 4.1.4. Threat of Substitutes
- 4.1.5. Competitive Rivalry
- 4.2. PESTEL analysis
- 4.3. BCG Analysis
- 4.3.1. Stars (High Growth, High Market Share)
- 4.3.2. Cash Cows (Low Growth, High Market Share)
- 4.3.3. Question Mark (High Growth, Low Market Share)
- 4.3.4. Dogs (Low Growth, Low Market Share)
- 4.4. Ansoff Matrix Analysis
- 4.5. Supply Chain Analysis
- 4.6. Regulatory Landscape
- 4.7. Current Market Potential and Opportunity Assessment (TAM–SAM–SOM Framework)
- 4.8. DMV Analyst Note
- 4.1. Porters Five Forces
- 5. Market Analysis, Insights and Forecast 2021-2033
- 5.1. Market Analysis, Insights and Forecast - by Type
- 5.1.1. Inorganic
- 5.1.1.1. Aluminum Hydroxide
- 5.1.1.2. Magnesium Hydroxide
- 5.1.1.3. Boron Compounds
- 5.1.2. Phosphorus
- 5.1.3. Nitrogen
- 5.1.4. Other Types
- 5.1.1. Inorganic
- 5.2. Market Analysis, Insights and Forecast - by End-user Industry
- 5.2.1. Electrical and Electronics
- 5.2.2. Buildings and Construction
- 5.2.3. Transportation
- 5.2.4. Textiles and Furniture
- 5.3. Market Analysis, Insights and Forecast - by Region
- 5.3.1. Asia Pacific
- 5.3.2. North America
- 5.3.3. Europe
- 5.3.4. South America
- 5.3.5. Middle East and Africa
- 5.1. Market Analysis, Insights and Forecast - by Type
- 6. Global Non-Halogenated Flame Retardants Chemicals Industry Analysis, Insights and Forecast, 2021-2033
- 6.1. Market Analysis, Insights and Forecast - by Type
- 6.1.1. Inorganic
- 6.1.1.1. Aluminum Hydroxide
- 6.1.1.2. Magnesium Hydroxide
- 6.1.1.3. Boron Compounds
- 6.1.2. Phosphorus
- 6.1.3. Nitrogen
- 6.1.4. Other Types
- 6.1.1. Inorganic
- 6.2. Market Analysis, Insights and Forecast - by End-user Industry
- 6.2.1. Electrical and Electronics
- 6.2.2. Buildings and Construction
- 6.2.3. Transportation
- 6.2.4. Textiles and Furniture
- 6.1. Market Analysis, Insights and Forecast - by Type
- 7. Asia Pacific Non-Halogenated Flame Retardants Chemicals Industry Analysis, Insights and Forecast, 2020-2032
- 7.1. Market Analysis, Insights and Forecast - by Type
- 7.1.1. Inorganic
- 7.1.1.1. Aluminum Hydroxide
- 7.1.1.2. Magnesium Hydroxide
- 7.1.1.3. Boron Compounds
- 7.1.2. Phosphorus
- 7.1.3. Nitrogen
- 7.1.4. Other Types
- 7.1.1. Inorganic
- 7.2. Market Analysis, Insights and Forecast - by End-user Industry
- 7.2.1. Electrical and Electronics
- 7.2.2. Buildings and Construction
- 7.2.3. Transportation
- 7.2.4. Textiles and Furniture
- 7.1. Market Analysis, Insights and Forecast - by Type
- 8. North America Non-Halogenated Flame Retardants Chemicals Industry Analysis, Insights and Forecast, 2020-2032
- 8.1. Market Analysis, Insights and Forecast - by Type
- 8.1.1. Inorganic
- 8.1.1.1. Aluminum Hydroxide
- 8.1.1.2. Magnesium Hydroxide
- 8.1.1.3. Boron Compounds
- 8.1.2. Phosphorus
- 8.1.3. Nitrogen
- 8.1.4. Other Types
- 8.1.1. Inorganic
- 8.2. Market Analysis, Insights and Forecast - by End-user Industry
- 8.2.1. Electrical and Electronics
- 8.2.2. Buildings and Construction
- 8.2.3. Transportation
- 8.2.4. Textiles and Furniture
- 8.1. Market Analysis, Insights and Forecast - by Type
- 9. Europe Non-Halogenated Flame Retardants Chemicals Industry Analysis, Insights and Forecast, 2020-2032
- 9.1. Market Analysis, Insights and Forecast - by Type
- 9.1.1. Inorganic
- 9.1.1.1. Aluminum Hydroxide
- 9.1.1.2. Magnesium Hydroxide
- 9.1.1.3. Boron Compounds
- 9.1.2. Phosphorus
- 9.1.3. Nitrogen
- 9.1.4. Other Types
- 9.1.1. Inorganic
- 9.2. Market Analysis, Insights and Forecast - by End-user Industry
- 9.2.1. Electrical and Electronics
- 9.2.2. Buildings and Construction
- 9.2.3. Transportation
- 9.2.4. Textiles and Furniture
- 9.1. Market Analysis, Insights and Forecast - by Type
- 10. South America Non-Halogenated Flame Retardants Chemicals Industry Analysis, Insights and Forecast, 2020-2032
- 10.1. Market Analysis, Insights and Forecast - by Type
- 10.1.1. Inorganic
- 10.1.1.1. Aluminum Hydroxide
- 10.1.1.2. Magnesium Hydroxide
- 10.1.1.3. Boron Compounds
- 10.1.2. Phosphorus
- 10.1.3. Nitrogen
- 10.1.4. Other Types
- 10.1.1. Inorganic
- 10.2. Market Analysis, Insights and Forecast - by End-user Industry
- 10.2.1. Electrical and Electronics
- 10.2.2. Buildings and Construction
- 10.2.3. Transportation
- 10.2.4. Textiles and Furniture
- 10.1. Market Analysis, Insights and Forecast - by Type
- 11. Middle East and Africa Non-Halogenated Flame Retardants Chemicals Industry Analysis, Insights and Forecast, 2020-2032
- 11.1. Market Analysis, Insights and Forecast - by Type
- 11.1.1. Inorganic
- 11.1.1.1. Aluminum Hydroxide
- 11.1.1.2. Magnesium Hydroxide
- 11.1.1.3. Boron Compounds
- 11.1.2. Phosphorus
- 11.1.3. Nitrogen
- 11.1.4. Other Types
- 11.1.1. Inorganic
- 11.2. Market Analysis, Insights and Forecast - by End-user Industry
- 11.2.1. Electrical and Electronics
- 11.2.2. Buildings and Construction
- 11.2.3. Transportation
- 11.2.4. Textiles and Furniture
- 11.1. Market Analysis, Insights and Forecast - by Type
- 12. Competitive Analysis
- 12.1. Company Profiles
- 12.1.1 ICL
- 12.1.1.1. Company Overview
- 12.1.1.2. Products
- 12.1.1.3. Company Financials
- 12.1.1.4. SWOT Analysis
- 12.1.2 DIC Corporation
- 12.1.2.1. Company Overview
- 12.1.2.2. Products
- 12.1.2.3. Company Financials
- 12.1.2.4. SWOT Analysis
- 12.1.3 TOR Minerals
- 12.1.3.1. Company Overview
- 12.1.3.2. Products
- 12.1.3.3. Company Financials
- 12.1.3.4. SWOT Analysis
- 12.1.4 Clariant
- 12.1.4.1. Company Overview
- 12.1.4.2. Products
- 12.1.4.3. Company Financials
- 12.1.4.4. SWOT Analysis
- 12.1.5 Jiangsu Jacques Technology Co Ltd
- 12.1.5.1. Company Overview
- 12.1.5.2. Products
- 12.1.5.3. Company Financials
- 12.1.5.4. SWOT Analysis
- 12.1.6 MPI Chemie BV
- 12.1.6.1. Company Overview
- 12.1.6.2. Products
- 12.1.6.3. Company Financials
- 12.1.6.4. SWOT Analysis
- 12.1.7 Italmatch Chemicals SpA
- 12.1.7.1. Company Overview
- 12.1.7.2. Products
- 12.1.7.3. Company Financials
- 12.1.7.4. SWOT Analysis
- 12.1.8 LANXESS
- 12.1.8.1. Company Overview
- 12.1.8.2. Products
- 12.1.8.3. Company Financials
- 12.1.8.4. SWOT Analysis
- 12.1.9 Nippon Carbide Indestries Co Inc (Sanwa Chemical Industry Co Ltd)
- 12.1.9.1. Company Overview
- 12.1.9.2. Products
- 12.1.9.3. Company Financials
- 12.1.9.4. SWOT Analysis
- 12.1.10 BASF SE
- 12.1.10.1. Company Overview
- 12.1.10.2. Products
- 12.1.10.3. Company Financials
- 12.1.10.4. SWOT Analysis
- 12.1.11 Rin Kagaku Kogyo Co Ltd
- 12.1.11.1. Company Overview
- 12.1.11.2. Products
- 12.1.11.3. Company Financials
- 12.1.11.4. SWOT Analysis
- 12.1.12 Shandong Brother Sci &Tech Co Ltd
- 12.1.12.1. Company Overview
- 12.1.12.2. Products
- 12.1.12.3. Company Financials
- 12.1.12.4. SWOT Analysis
- 12.1.13 Nabaltec AG
- 12.1.13.1. Company Overview
- 12.1.13.2. Products
- 12.1.13.3. Company Financials
- 12.1.13.4. SWOT Analysis
- 12.1.14 Thor
- 12.1.14.1. Company Overview
- 12.1.14.2. Products
- 12.1.14.3. Company Financials
- 12.1.14.4. SWOT Analysis
- 12.1.15 Eti Maden
- 12.1.15.1. Company Overview
- 12.1.15.2. Products
- 12.1.15.3. Company Financials
- 12.1.15.4. SWOT Analysis
- 12.1.16 Apexical Inc
- 12.1.16.1. Company Overview
- 12.1.16.2. Products
- 12.1.16.3. Company Financials
- 12.1.16.4. SWOT Analysis
- 12.1.17 NYACOL Nano Technologies Inc
- 12.1.17.1. Company Overview
- 12.1.17.2. Products
- 12.1.17.3. Company Financials
- 12.1.17.4. SWOT Analysis
- 12.1.18 Huber Engineered Materials
- 12.1.18.1. Company Overview
- 12.1.18.2. Products
- 12.1.18.3. Company Financials
- 12.1.18.4. SWOT Analysis
- 12.1.19 Daihachi Chemical Industry Co Ltd
- 12.1.19.1. Company Overview
- 12.1.19.2. Products
- 12.1.19.3. Company Financials
- 12.1.19.4. SWOT Analysis
- 12.1.1 ICL
- 12.2. Market Entropy
- 12.2.1 Company's Key Areas Served
- 12.2.2 Recent Developments
- 12.3. Company Market Share Analysis 2025
- 12.3.1 Top 5 Companies Market Share Analysis
- 12.3.2 Top 3 Companies Market Share Analysis
- 12.4. List of Potential Customers
- 13. Research Methodology
List of Figures
- Figure 1: Global Non-Halogenated Flame Retardants Chemicals Industry Revenue Breakdown (billion, %) by Region 2025 & 2033
- Figure 2: Global Non-Halogenated Flame Retardants Chemicals Industry Volume Breakdown (K Tons, %) by Region 2025 & 2033
- Figure 3: Asia Pacific Non-Halogenated Flame Retardants Chemicals Industry Revenue (billion), by Type 2025 & 2033
- Figure 4: Asia Pacific Non-Halogenated Flame Retardants Chemicals Industry Volume (K Tons), by Type 2025 & 2033
- Figure 5: Asia Pacific Non-Halogenated Flame Retardants Chemicals Industry Revenue Share (%), by Type 2025 & 2033
- Figure 6: Asia Pacific Non-Halogenated Flame Retardants Chemicals Industry Volume Share (%), by Type 2025 & 2033
- Figure 7: Asia Pacific Non-Halogenated Flame Retardants Chemicals Industry Revenue (billion), by End-user Industry 2025 & 2033
- Figure 8: Asia Pacific Non-Halogenated Flame Retardants Chemicals Industry Volume (K Tons), by End-user Industry 2025 & 2033
- Figure 9: Asia Pacific Non-Halogenated Flame Retardants Chemicals Industry Revenue Share (%), by End-user Industry 2025 & 2033
- Figure 10: Asia Pacific Non-Halogenated Flame Retardants Chemicals Industry Volume Share (%), by End-user Industry 2025 & 2033
- Figure 11: Asia Pacific Non-Halogenated Flame Retardants Chemicals Industry Revenue (billion), by Country 2025 & 2033
- Figure 12: Asia Pacific Non-Halogenated Flame Retardants Chemicals Industry Volume (K Tons), by Country 2025 & 2033
- Figure 13: Asia Pacific Non-Halogenated Flame Retardants Chemicals Industry Revenue Share (%), by Country 2025 & 2033
- Figure 14: Asia Pacific Non-Halogenated Flame Retardants Chemicals Industry Volume Share (%), by Country 2025 & 2033
- Figure 15: North America Non-Halogenated Flame Retardants Chemicals Industry Revenue (billion), by Type 2025 & 2033
- Figure 16: North America Non-Halogenated Flame Retardants Chemicals Industry Volume (K Tons), by Type 2025 & 2033
- Figure 17: North America Non-Halogenated Flame Retardants Chemicals Industry Revenue Share (%), by Type 2025 & 2033
- Figure 18: North America Non-Halogenated Flame Retardants Chemicals Industry Volume Share (%), by Type 2025 & 2033
- Figure 19: North America Non-Halogenated Flame Retardants Chemicals Industry Revenue (billion), by End-user Industry 2025 & 2033
- Figure 20: North America Non-Halogenated Flame Retardants Chemicals Industry Volume (K Tons), by End-user Industry 2025 & 2033
- Figure 21: North America Non-Halogenated Flame Retardants Chemicals Industry Revenue Share (%), by End-user Industry 2025 & 2033
- Figure 22: North America Non-Halogenated Flame Retardants Chemicals Industry Volume Share (%), by End-user Industry 2025 & 2033
- Figure 23: North America Non-Halogenated Flame Retardants Chemicals Industry Revenue (billion), by Country 2025 & 2033
- Figure 24: North America Non-Halogenated Flame Retardants Chemicals Industry Volume (K Tons), by Country 2025 & 2033
- Figure 25: North America Non-Halogenated Flame Retardants Chemicals Industry Revenue Share (%), by Country 2025 & 2033
- Figure 26: North America Non-Halogenated Flame Retardants Chemicals Industry Volume Share (%), by Country 2025 & 2033
- Figure 27: Europe Non-Halogenated Flame Retardants Chemicals Industry Revenue (billion), by Type 2025 & 2033
- Figure 28: Europe Non-Halogenated Flame Retardants Chemicals Industry Volume (K Tons), by Type 2025 & 2033
- Figure 29: Europe Non-Halogenated Flame Retardants Chemicals Industry Revenue Share (%), by Type 2025 & 2033
- Figure 30: Europe Non-Halogenated Flame Retardants Chemicals Industry Volume Share (%), by Type 2025 & 2033
- Figure 31: Europe Non-Halogenated Flame Retardants Chemicals Industry Revenue (billion), by End-user Industry 2025 & 2033
- Figure 32: Europe Non-Halogenated Flame Retardants Chemicals Industry Volume (K Tons), by End-user Industry 2025 & 2033
- Figure 33: Europe Non-Halogenated Flame Retardants Chemicals Industry Revenue Share (%), by End-user Industry 2025 & 2033
- Figure 34: Europe Non-Halogenated Flame Retardants Chemicals Industry Volume Share (%), by End-user Industry 2025 & 2033
- Figure 35: Europe Non-Halogenated Flame Retardants Chemicals Industry Revenue (billion), by Country 2025 & 2033
- Figure 36: Europe Non-Halogenated Flame Retardants Chemicals Industry Volume (K Tons), by Country 2025 & 2033
- Figure 37: Europe Non-Halogenated Flame Retardants Chemicals Industry Revenue Share (%), by Country 2025 & 2033
- Figure 38: Europe Non-Halogenated Flame Retardants Chemicals Industry Volume Share (%), by Country 2025 & 2033
- Figure 39: South America Non-Halogenated Flame Retardants Chemicals Industry Revenue (billion), by Type 2025 & 2033
- Figure 40: South America Non-Halogenated Flame Retardants Chemicals Industry Volume (K Tons), by Type 2025 & 2033
- Figure 41: South America Non-Halogenated Flame Retardants Chemicals Industry Revenue Share (%), by Type 2025 & 2033
- Figure 42: South America Non-Halogenated Flame Retardants Chemicals Industry Volume Share (%), by Type 2025 & 2033
- Figure 43: South America Non-Halogenated Flame Retardants Chemicals Industry Revenue (billion), by End-user Industry 2025 & 2033
- Figure 44: South America Non-Halogenated Flame Retardants Chemicals Industry Volume (K Tons), by End-user Industry 2025 & 2033
- Figure 45: South America Non-Halogenated Flame Retardants Chemicals Industry Revenue Share (%), by End-user Industry 2025 & 2033
- Figure 46: South America Non-Halogenated Flame Retardants Chemicals Industry Volume Share (%), by End-user Industry 2025 & 2033
- Figure 47: South America Non-Halogenated Flame Retardants Chemicals Industry Revenue (billion), by Country 2025 & 2033
- Figure 48: South America Non-Halogenated Flame Retardants Chemicals Industry Volume (K Tons), by Country 2025 & 2033
- Figure 49: South America Non-Halogenated Flame Retardants Chemicals Industry Revenue Share (%), by Country 2025 & 2033
- Figure 50: South America Non-Halogenated Flame Retardants Chemicals Industry Volume Share (%), by Country 2025 & 2033
- Figure 51: Middle East and Africa Non-Halogenated Flame Retardants Chemicals Industry Revenue (billion), by Type 2025 & 2033
- Figure 52: Middle East and Africa Non-Halogenated Flame Retardants Chemicals Industry Volume (K Tons), by Type 2025 & 2033
- Figure 53: Middle East and Africa Non-Halogenated Flame Retardants Chemicals Industry Revenue Share (%), by Type 2025 & 2033
- Figure 54: Middle East and Africa Non-Halogenated Flame Retardants Chemicals Industry Volume Share (%), by Type 2025 & 2033
- Figure 55: Middle East and Africa Non-Halogenated Flame Retardants Chemicals Industry Revenue (billion), by End-user Industry 2025 & 2033
- Figure 56: Middle East and Africa Non-Halogenated Flame Retardants Chemicals Industry Volume (K Tons), by End-user Industry 2025 & 2033
- Figure 57: Middle East and Africa Non-Halogenated Flame Retardants Chemicals Industry Revenue Share (%), by End-user Industry 2025 & 2033
- Figure 58: Middle East and Africa Non-Halogenated Flame Retardants Chemicals Industry Volume Share (%), by End-user Industry 2025 & 2033
- Figure 59: Middle East and Africa Non-Halogenated Flame Retardants Chemicals Industry Revenue (billion), by Country 2025 & 2033
- Figure 60: Middle East and Africa Non-Halogenated Flame Retardants Chemicals Industry Volume (K Tons), by Country 2025 & 2033
- Figure 61: Middle East and Africa Non-Halogenated Flame Retardants Chemicals Industry Revenue Share (%), by Country 2025 & 2033
- Figure 62: Middle East and Africa Non-Halogenated Flame Retardants Chemicals Industry Volume Share (%), by Country 2025 & 2033
List of Tables
- Table 1: Global Non-Halogenated Flame Retardants Chemicals Industry Revenue billion Forecast, by Type 2020 & 2033
- Table 2: Global Non-Halogenated Flame Retardants Chemicals Industry Volume K Tons Forecast, by Type 2020 & 2033
- Table 3: Global Non-Halogenated Flame Retardants Chemicals Industry Revenue billion Forecast, by End-user Industry 2020 & 2033
- Table 4: Global Non-Halogenated Flame Retardants Chemicals Industry Volume K Tons Forecast, by End-user Industry 2020 & 2033
- Table 5: Global Non-Halogenated Flame Retardants Chemicals Industry Revenue billion Forecast, by Region 2020 & 2033
- Table 6: Global Non-Halogenated Flame Retardants Chemicals Industry Volume K Tons Forecast, by Region 2020 & 2033
- Table 7: Global Non-Halogenated Flame Retardants Chemicals Industry Revenue billion Forecast, by Type 2020 & 2033
- Table 8: Global Non-Halogenated Flame Retardants Chemicals Industry Volume K Tons Forecast, by Type 2020 & 2033
- Table 9: Global Non-Halogenated Flame Retardants Chemicals Industry Revenue billion Forecast, by End-user Industry 2020 & 2033
- Table 10: Global Non-Halogenated Flame Retardants Chemicals Industry Volume K Tons Forecast, by End-user Industry 2020 & 2033
- Table 11: Global Non-Halogenated Flame Retardants Chemicals Industry Revenue billion Forecast, by Country 2020 & 2033
- Table 12: Global Non-Halogenated Flame Retardants Chemicals Industry Volume K Tons Forecast, by Country 2020 & 2033
- Table 13: China Non-Halogenated Flame Retardants Chemicals Industry Revenue (billion) Forecast, by Application 2020 & 2033
- Table 14: China Non-Halogenated Flame Retardants Chemicals Industry Volume (K Tons) Forecast, by Application 2020 & 2033
- Table 15: India Non-Halogenated Flame Retardants Chemicals Industry Revenue (billion) Forecast, by Application 2020 & 2033
- Table 16: India Non-Halogenated Flame Retardants Chemicals Industry Volume (K Tons) Forecast, by Application 2020 & 2033
- Table 17: Japan Non-Halogenated Flame Retardants Chemicals Industry Revenue (billion) Forecast, by Application 2020 & 2033
- Table 18: Japan Non-Halogenated Flame Retardants Chemicals Industry Volume (K Tons) Forecast, by Application 2020 & 2033
- Table 19: South Korea Non-Halogenated Flame Retardants Chemicals Industry Revenue (billion) Forecast, by Application 2020 & 2033
- Table 20: South Korea Non-Halogenated Flame Retardants Chemicals Industry Volume (K Tons) Forecast, by Application 2020 & 2033
- Table 21: Rest of Asia Pacific Non-Halogenated Flame Retardants Chemicals Industry Revenue (billion) Forecast, by Application 2020 & 2033
- Table 22: Rest of Asia Pacific Non-Halogenated Flame Retardants Chemicals Industry Volume (K Tons) Forecast, by Application 2020 & 2033
- Table 23: Global Non-Halogenated Flame Retardants Chemicals Industry Revenue billion Forecast, by Type 2020 & 2033
- Table 24: Global Non-Halogenated Flame Retardants Chemicals Industry Volume K Tons Forecast, by Type 2020 & 2033
- Table 25: Global Non-Halogenated Flame Retardants Chemicals Industry Revenue billion Forecast, by End-user Industry 2020 & 2033
- Table 26: Global Non-Halogenated Flame Retardants Chemicals Industry Volume K Tons Forecast, by End-user Industry 2020 & 2033
- Table 27: Global Non-Halogenated Flame Retardants Chemicals Industry Revenue billion Forecast, by Country 2020 & 2033
- Table 28: Global Non-Halogenated Flame Retardants Chemicals Industry Volume K Tons Forecast, by Country 2020 & 2033
- Table 29: United States Non-Halogenated Flame Retardants Chemicals Industry Revenue (billion) Forecast, by Application 2020 & 2033
- Table 30: United States Non-Halogenated Flame Retardants Chemicals Industry Volume (K Tons) Forecast, by Application 2020 & 2033
- Table 31: Canada Non-Halogenated Flame Retardants Chemicals Industry Revenue (billion) Forecast, by Application 2020 & 2033
- Table 32: Canada Non-Halogenated Flame Retardants Chemicals Industry Volume (K Tons) Forecast, by Application 2020 & 2033
- Table 33: Mexico Non-Halogenated Flame Retardants Chemicals Industry Revenue (billion) Forecast, by Application 2020 & 2033
- Table 34: Mexico Non-Halogenated Flame Retardants Chemicals Industry Volume (K Tons) Forecast, by Application 2020 & 2033
- Table 35: Global Non-Halogenated Flame Retardants Chemicals Industry Revenue billion Forecast, by Type 2020 & 2033
- Table 36: Global Non-Halogenated Flame Retardants Chemicals Industry Volume K Tons Forecast, by Type 2020 & 2033
- Table 37: Global Non-Halogenated Flame Retardants Chemicals Industry Revenue billion Forecast, by End-user Industry 2020 & 2033
- Table 38: Global Non-Halogenated Flame Retardants Chemicals Industry Volume K Tons Forecast, by End-user Industry 2020 & 2033
- Table 39: Global Non-Halogenated Flame Retardants Chemicals Industry Revenue billion Forecast, by Country 2020 & 2033
- Table 40: Global Non-Halogenated Flame Retardants Chemicals Industry Volume K Tons Forecast, by Country 2020 & 2033
- Table 41: Germany Non-Halogenated Flame Retardants Chemicals Industry Revenue (billion) Forecast, by Application 2020 & 2033
- Table 42: Germany Non-Halogenated Flame Retardants Chemicals Industry Volume (K Tons) Forecast, by Application 2020 & 2033
- Table 43: United Kingdom Non-Halogenated Flame Retardants Chemicals Industry Revenue (billion) Forecast, by Application 2020 & 2033
- Table 44: United Kingdom Non-Halogenated Flame Retardants Chemicals Industry Volume (K Tons) Forecast, by Application 2020 & 2033
- Table 45: Italy Non-Halogenated Flame Retardants Chemicals Industry Revenue (billion) Forecast, by Application 2020 & 2033
- Table 46: Italy Non-Halogenated Flame Retardants Chemicals Industry Volume (K Tons) Forecast, by Application 2020 & 2033
- Table 47: France Non-Halogenated Flame Retardants Chemicals Industry Revenue (billion) Forecast, by Application 2020 & 2033
- Table 48: France Non-Halogenated Flame Retardants Chemicals Industry Volume (K Tons) Forecast, by Application 2020 & 2033
- Table 49: Rest of Europe Non-Halogenated Flame Retardants Chemicals Industry Revenue (billion) Forecast, by Application 2020 & 2033
- Table 50: Rest of Europe Non-Halogenated Flame Retardants Chemicals Industry Volume (K Tons) Forecast, by Application 2020 & 2033
- Table 51: Global Non-Halogenated Flame Retardants Chemicals Industry Revenue billion Forecast, by Type 2020 & 2033
- Table 52: Global Non-Halogenated Flame Retardants Chemicals Industry Volume K Tons Forecast, by Type 2020 & 2033
- Table 53: Global Non-Halogenated Flame Retardants Chemicals Industry Revenue billion Forecast, by End-user Industry 2020 & 2033
- Table 54: Global Non-Halogenated Flame Retardants Chemicals Industry Volume K Tons Forecast, by End-user Industry 2020 & 2033
- Table 55: Global Non-Halogenated Flame Retardants Chemicals Industry Revenue billion Forecast, by Country 2020 & 2033
- Table 56: Global Non-Halogenated Flame Retardants Chemicals Industry Volume K Tons Forecast, by Country 2020 & 2033
- Table 57: Brazil Non-Halogenated Flame Retardants Chemicals Industry Revenue (billion) Forecast, by Application 2020 & 2033
- Table 58: Brazil Non-Halogenated Flame Retardants Chemicals Industry Volume (K Tons) Forecast, by Application 2020 & 2033
- Table 59: Argentina Non-Halogenated Flame Retardants Chemicals Industry Revenue (billion) Forecast, by Application 2020 & 2033
- Table 60: Argentina Non-Halogenated Flame Retardants Chemicals Industry Volume (K Tons) Forecast, by Application 2020 & 2033
- Table 61: Rest of South America Non-Halogenated Flame Retardants Chemicals Industry Revenue (billion) Forecast, by Application 2020 & 2033
- Table 62: Rest of South America Non-Halogenated Flame Retardants Chemicals Industry Volume (K Tons) Forecast, by Application 2020 & 2033
- Table 63: Global Non-Halogenated Flame Retardants Chemicals Industry Revenue billion Forecast, by Type 2020 & 2033
- Table 64: Global Non-Halogenated Flame Retardants Chemicals Industry Volume K Tons Forecast, by Type 2020 & 2033
- Table 65: Global Non-Halogenated Flame Retardants Chemicals Industry Revenue billion Forecast, by End-user Industry 2020 & 2033
- Table 66: Global Non-Halogenated Flame Retardants Chemicals Industry Volume K Tons Forecast, by End-user Industry 2020 & 2033
- Table 67: Global Non-Halogenated Flame Retardants Chemicals Industry Revenue billion Forecast, by Country 2020 & 2033
- Table 68: Global Non-Halogenated Flame Retardants Chemicals Industry Volume K Tons Forecast, by Country 2020 & 2033
- Table 69: Saudi Arabia Non-Halogenated Flame Retardants Chemicals Industry Revenue (billion) Forecast, by Application 2020 & 2033
- Table 70: Saudi Arabia Non-Halogenated Flame Retardants Chemicals Industry Volume (K Tons) Forecast, by Application 2020 & 2033
- Table 71: South Africa Non-Halogenated Flame Retardants Chemicals Industry Revenue (billion) Forecast, by Application 2020 & 2033
- Table 72: South Africa Non-Halogenated Flame Retardants Chemicals Industry Volume (K Tons) Forecast, by Application 2020 & 2033
- Table 73: Rest of Middle East and Africa Non-Halogenated Flame Retardants Chemicals Industry Revenue (billion) Forecast, by Application 2020 & 2033
- Table 74: Rest of Middle East and Africa Non-Halogenated Flame Retardants Chemicals Industry Volume (K Tons) Forecast, by Application 2020 & 2033
Frequently Asked Questions
1. What is the projected Compound Annual Growth Rate (CAGR) of the Non-Halogenated Flame Retardants Chemicals Industry?
The projected CAGR is approximately 12.02%.
2. Which companies are prominent players in the Non-Halogenated Flame Retardants Chemicals Industry?
Key companies in the market include ICL, DIC Corporation, TOR Minerals, Clariant, Jiangsu Jacques Technology Co Ltd, MPI Chemie BV, Italmatch Chemicals SpA, LANXESS, Nippon Carbide Indestries Co Inc (Sanwa Chemical Industry Co Ltd), BASF SE, Rin Kagaku Kogyo Co Ltd, Shandong Brother Sci &Tech Co Ltd, Nabaltec AG, Thor, Eti Maden, Apexical Inc, NYACOL Nano Technologies Inc, Huber Engineered Materials, Daihachi Chemical Industry Co Ltd.
3. What are the main segments of the Non-Halogenated Flame Retardants Chemicals Industry?
The market segments include Type, End-user Industry.
4. Can you provide details about the market size?
The market size is estimated to be USD 10.59 billion as of 2022.
5. What are some drivers contributing to market growth?
; Environmental and Health Concerns Regarding Brominated and Other Flame Retardants; Increasing Infrastructure Activities in Asia-Pacific; Rising Consumer Electrical and Electronic Goods Manufacturing.
6. What are the notable trends driving market growth?
Increasing Demand from the Buildings and Construction Industry.
7. Are there any restraints impacting market growth?
; Non-suitability of Hydroxides to High Temperature Applications.
8. Can you provide examples of recent developments in the market?
N/A
9. What pricing options are available for accessing the report?
Pricing options include single-user, multi-user, and enterprise licenses priced at USD 4750, USD 5250, and USD 8750 respectively.
10. Is the market size provided in terms of value or volume?
The market size is provided in terms of value, measured in billion and volume, measured in K Tons.
11. Are there any specific market keywords associated with the report?
Yes, the market keyword associated with the report is "Non-Halogenated Flame Retardants Chemicals Industry," which aids in identifying and referencing the specific market segment covered.
12. How do I determine which pricing option suits my needs best?
The pricing options vary based on user requirements and access needs. Individual users may opt for single-user licenses, while businesses requiring broader access may choose multi-user or enterprise licenses for cost-effective access to the report.
13. Are there any additional resources or data provided in the Non-Halogenated Flame Retardants Chemicals Industry report?
While the report offers comprehensive insights, it's advisable to review the specific contents or supplementary materials provided to ascertain if additional resources or data are available.
14. How can I stay updated on further developments or reports in the Non-Halogenated Flame Retardants Chemicals Industry?
To stay informed about further developments, trends, and reports in the Non-Halogenated Flame Retardants Chemicals Industry, consider subscribing to industry newsletters, following relevant companies and organizations, or regularly checking reputable industry news sources and publications.
Methodology
Step 1 - Identification of Relevant Samples Size from Population Database


Step 2 - Approaches for Defining Global Market Size (Value, Volume* & Price*)

Note*: In applicable scenarios
Step 3 - Data Sources
Primary Research
- Web Analytics
- Survey Reports
- Research Institute
- Latest Research Reports
- Opinion Leaders
Secondary Research
- Annual Reports
- White Paper
- Latest Press Release
- Industry Association
- Paid Database
- Investor Presentations

Step 4 - Data Triangulation
Involves using different sources of information in order to increase the validity of a study
These sources are likely to be stakeholders in a program - participants, other researchers, program staff, other community members, and so on.
Then we put all data in single framework & apply various statistical tools to find out the dynamic on the market.
During the analysis stage, feedback from the stakeholder groups would be compared to determine areas of agreement as well as areas of divergence