

Key Insights
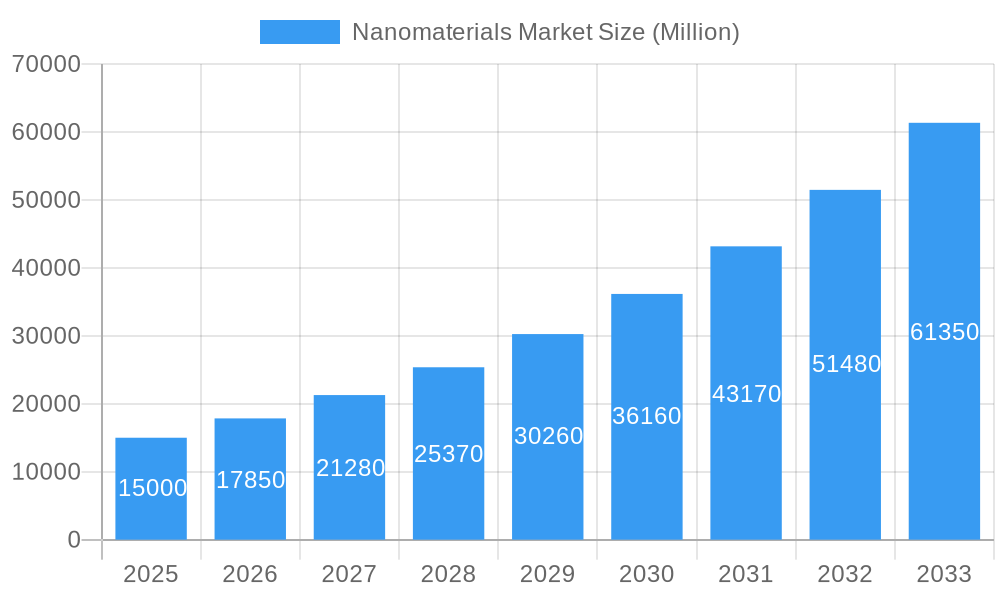
The nanomaterials market is experiencing robust growth, projected to reach a substantial size within the forecast period (2025-2033). The impressive Compound Annual Growth Rate (CAGR) exceeding 19% signifies significant investor interest and expanding applications across diverse sectors. Key drivers fueling this expansion include the increasing demand for advanced materials with enhanced properties in electronics, construction, energy, and healthcare. The rising adoption of nanotechnology in various industries, coupled with ongoing research and development efforts to create innovative nanomaterials with tailored functionalities, are further accelerating market growth. Significant advancements in nanomaterial synthesis and characterization techniques are enabling the production of high-quality, cost-effective materials, leading to wider adoption across various applications. Specific application areas like drug delivery systems, high-strength composites, and advanced electronic components are witnessing particularly high growth. The market segmentation reveals a diverse landscape, encompassing various product types (nanoparticles, nanometals, nanofibers, nanotubes, etc.), end-user industries, and structural types. This diversity suggests opportunities for specialized players focusing on specific niches. While challenges exist regarding regulatory hurdles and potential environmental concerns, the overall positive outlook is driven by the inherent advantages of nanomaterials in improving performance, efficiency, and sustainability across multiple industries.

Nanomaterials Market Market Size (In Billion)
The Asia-Pacific region, particularly China and India, is expected to dominate the market due to significant manufacturing capabilities and burgeoning technological advancements. North America and Europe will also contribute substantially, owing to robust R&D activities and early adoption of innovative nanomaterials in high-tech industries. Competition is intense, with numerous established players like BASF SE, Cabot Corporation, and Nano-C alongside emerging companies actively involved in developing and supplying a wide range of nanomaterials. The competitive landscape is characterized by collaborations, strategic partnerships, and continuous innovation in material synthesis and application development. Future growth will likely be shaped by advancements in nanomanufacturing, further exploration of novel nanomaterials, and the emergence of new applications in sectors such as renewable energy and sustainable infrastructure. Addressing regulatory uncertainties and ensuring safe handling of nanomaterials will be crucial for maintaining the market's positive trajectory.
Nanomaterials Market Company Market Share
Nanomaterials Market: A Comprehensive Report (2019-2033)
This insightful report provides a detailed analysis of the global nanomaterials market, encompassing its current state, future trajectory, and key players. The study period covers 2019-2033, with 2025 serving as the base and estimated year. The market is segmented by product type (nanoparticles, nanofibers, nanotubes, etc.), end-user industry (construction, electronics, healthcare, etc.), and structure type. This comprehensive report projects a market value of xx Million by 2033, driven by technological advancements and increasing demand across diverse sectors. This report is invaluable for investors, manufacturers, researchers, and anyone seeking to understand and capitalize on the immense potential of the nanomaterials market.
Nanomaterials Market Composition & Trends
The nanomaterials market is characterized by moderate concentration, with several major players holding significant market share. The market share distribution is dynamic, with ongoing mergers and acquisitions (M&A) reshaping the competitive landscape. In 2024, the top five companies accounted for approximately xx% of the global market. Significant M&A activity has been witnessed, with deal values exceeding xx Million in recent years, primarily driven by strategic expansions and technological acquisitions.
- Market Concentration: Moderately concentrated, with top 5 players holding approximately xx% market share in 2024.
- Innovation Catalysts: Government funding for nanotechnology research, increasing demand for advanced materials, and technological breakthroughs in synthesis and characterization techniques.
- Regulatory Landscape: Evolving regulations concerning safety and environmental impact of nanomaterials are influencing market dynamics and driving innovation in safer production methods.
- Substitute Products: Traditional materials often compete with nanomaterials, particularly in established sectors. However, the unique properties of nanomaterials are leading to their adoption in applications where substitutes are unsuitable.
- End-User Profiles: Diverse, ranging from large multinational corporations to small and medium-sized enterprises (SMEs) across diverse sectors.
- M&A Activity: Significant activity, driven by expansion into new markets, technology acquisition, and diversification strategies. Deal values exceeded xx Million in the period 2021-2024.
Nanomaterials Market Industry Evolution
The nanomaterials market has experienced substantial growth since 2019, fueled by increasing demand from various sectors. Technological advancements in synthesis, characterization, and functionalization of nanomaterials have unlocked new applications and improved performance in existing ones. Growth rates have varied across segments, with the electronics and healthcare sectors showing particularly strong adoption. The market witnessed a Compound Annual Growth Rate (CAGR) of xx% during the historical period (2019-2024) and is projected to grow at a CAGR of xx% during the forecast period (2025-2033). This growth reflects a paradigm shift in material science, with nanomaterials becoming increasingly important for creating high-performance products. Consumer demand for smaller, faster, and more efficient devices and systems is a major driver, pushing manufacturers to incorporate advanced nanomaterials.
Leading Regions, Countries, or Segments in Nanomaterials Market
The Asia-Pacific region currently dominates the nanomaterials market, driven by robust economic growth, substantial investments in R&D, and a large manufacturing base. Within the region, China and Japan stand out as leading countries.
- Key Drivers: Strong government support, significant private investment, and expanding manufacturing capacities.
- Dominance Factors: High demand from electronics and automotive sectors, access to raw materials, and a favorable regulatory environment.
Amongst product types, the demand for nanoparticles is considerable; among end-user industries, the electronics sector is a major consumer. The construction industry is exhibiting strong growth potential for nanomaterials applications due to increasing demand for high-performance building materials, and personal care industries are leveraging nanotechnology for better efficacy and improved delivery mechanisms.
Nanomaterials Market Product Innovations
Recent years have witnessed significant advancements in nanomaterial synthesis and functionalization techniques, leading to the development of novel materials with enhanced properties. This includes improved control over particle size, shape, and surface chemistry, allowing for tailored functionalities for specific applications. For instance, the launch of novel nanoscale electrolytes for lithium-ion batteries represents a significant leap in energy storage technology.
Propelling Factors for Nanomaterials Market Growth
Several factors propel the growth of the nanomaterials market. Technological advancements enable the creation of materials with superior strength, conductivity, and other properties. Economically, the increasing demand for high-performance materials across various industries fuels adoption. Favorable government policies and regulations, including research funding and tax incentives, further encourage innovation and market expansion.
Obstacles in the Nanomaterials Market Market
Despite the substantial potential, several challenges hinder the growth of the nanomaterials market. Regulatory uncertainties surrounding the safety and environmental impact of nanomaterials create hurdles for commercialization. Supply chain disruptions and the relatively high cost of production of some nanomaterials constrain widespread adoption. Competitive pressures from traditional materials and the complexities of scaling up production are additional obstacles.
Future Opportunities in Nanomaterials Market
Future opportunities abound in the nanomaterials market. Emerging applications in fields like renewable energy, advanced medicine, and flexible electronics are unlocking significant potential. Development of novel nanomaterials with unique properties, particularly for sustainable applications, represents a key growth avenue. Further breakthroughs in synthesis and characterization techniques will contribute significantly to market growth.
Major Players in the Nanomaterials Market Ecosystem
- ZYVEX TECHNOLOGIES
- Jiangsu Cnano Technology Co Ltd
- ACS Material
- Raymor Industries Inc
- American Elements
- Cabot Corporation
- Nanophase Technologies Corporation
- BASF SE
- Nanocyl SA
- Arkema Group
- LG Chem
- Nano-C
- Chengdu Organic Chemicals Co Ltd (Timesnano)
- CHASM Advanced Materials Inc
- SHOWA DENKO K K
- OCSiAl
Key Developments in Nanomaterials Market Industry
- November 2022: American Elements launched a novel nanoscale electrolyte material for lithium-ion batteries.
- March 2021: Cabot Corporation announced the launch of the ENERMAX 6 carbon nanotube (CNT) series, its most conductive multi-walled CNT product.
Strategic Nanomaterials Market Market Forecast
The nanomaterials market is poised for substantial growth in the coming years, driven by continued technological advancements and growing demand from diverse sectors. Emerging applications and the development of sustainable nanomaterials will further drive market expansion. The market is expected to reach xx Million by 2033, presenting significant opportunities for investors and businesses.
Nanomaterials Market Segmentation
-
1. Product Type
-
1.1. Nanoparticles
-
1.1.1. Nanometals
- 1.1.1.1. Gold
- 1.1.1.2. Silver
- 1.1.1.3. Platinum
- 1.1.1.4. Titanium
- 1.1.1.5. Aluminium
-
1.1.2. Nonmetal Oxides
- 1.1.2.1. Alumina
- 1.1.2.2. Iron Oxide
- 1.1.2.3. Titanium Oxide
- 1.1.2.4. Silica
- 1.1.2.5. Zinc Oxide
-
1.1.3. Complex Oxides
- 1.1.3.1. Calcium Phosphate
- 1.1.3.2. Rare Earth Metal Oxides
- 1.1.3.3. Lithium Titanate
- 1.1.3.4. Silica Hydride
-
1.1.1. Nanometals
- 1.2. Nanofibers
- 1.3. Nanotubes
- 1.4. Nanoclays
- 1.5. Nanowires
-
1.1. Nanoparticles
-
2. Structure Type
-
2.1. Non-polymer Organic Nanomaterials
- 2.1.1. Carbon Black
- 2.1.2. Carbon Nanotubes
- 2.1.3. Aptamers
- 2.1.4. Small Molecule OLED
- 2.1.5. Activated Carbon
- 2.1.6. Carbon Nanotubes Composites
-
2.2. Polymeric Nanomaterials
- 2.2.1. Coatings and Adhesives
- 2.2.2. Transfection Reagents
- 2.2.3. Diagnostics Reagents
- 2.2.4. Drug Delivery Vehicle
- 2.2.5. Fabric Treatments
- 2.2.6. Optical Coatings
- 2.2.7. Nano-porous Filtration Membrane
- 2.2.8. Di-electric Films
- 2.2.9. OLED Films
-
2.1. Non-polymer Organic Nanomaterials
-
3. End-user Industry
- 3.1. Construction
- 3.2. Electronics
- 3.3. Energy
- 3.4. Healthcare
- 3.5. Personal Care
- 3.6. Rubber
- 3.7. Other End-user Industries
Nanomaterials Market Segmentation By Geography
-
1. Asia Pacific
- 1.1. China
- 1.2. India
- 1.3. Japan
- 1.4. South Korea
- 1.5. ASEAN Countries
- 1.6. Rest of Asia Pacific
-
2. North America
- 2.1. United States
- 2.2. Canada
- 2.3. Mexico
-
3. Europe
- 3.1. Germany
- 3.2. United Kingdom
- 3.3. Italy
- 3.4. France
- 3.5. Rest of Europe
-
4. South America
- 4.1. Brazil
- 4.2. Argentina
- 4.3. Rest of South America
-
5. Middle East and Africa
- 5.1. Saudi Arabia
- 5.2. South Africa
- 5.3. Rest of Middle East and Africa
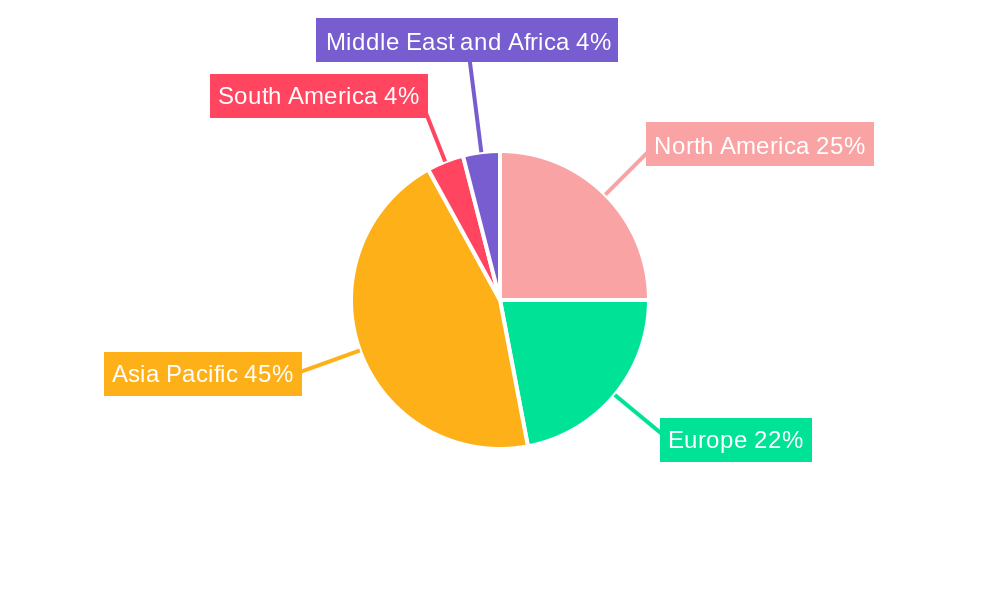
Nanomaterials Market Regional Market Share
Geographic Coverage of Nanomaterials Market
Nanomaterials Market REPORT HIGHLIGHTS
| Aspects | Details |
|---|---|
| Study Period | 2020-2034 |
| Base Year | 2025 |
| Estimated Year | 2026 |
| Forecast Period | 2026-2034 |
| Historical Period | 2020-2025 |
| Growth Rate | CAGR of 15.4% from 2020-2034 |
| Segmentation |
|
Table of Contents
- 1. Introduction
- 1.1. Research Scope
- 1.2. Market Segmentation
- 1.3. Research Objective
- 1.4. Definitions and Assumptions
- 2. Executive Summary
- 2.1. Market Snapshot
- 3. Market Dynamics
- 3.1. Market Drivers
- 3.2. Market Restrains
- 3.3. Market Trends
- 3.4. Market Opportunities
- 4. Market Factor Analysis
- 4.1. Porters Five Forces
- 4.1.1. Bargaining Power of Suppliers
- 4.1.2. Bargaining Power of Buyers
- 4.1.3. Threat of New Entrants
- 4.1.4. Threat of Substitutes
- 4.1.5. Competitive Rivalry
- 4.2. PESTEL analysis
- 4.3. BCG Analysis
- 4.3.1. Stars (High Growth, High Market Share)
- 4.3.2. Cash Cows (Low Growth, High Market Share)
- 4.3.3. Question Mark (High Growth, Low Market Share)
- 4.3.4. Dogs (Low Growth, Low Market Share)
- 4.4. Ansoff Matrix Analysis
- 4.5. Supply Chain Analysis
- 4.6. Regulatory Landscape
- 4.7. Current Market Potential and Opportunity Assessment (TAM–SAM–SOM Framework)
- 4.8. DMV Analyst Note
- 4.1. Porters Five Forces
- 5. Market Analysis, Insights and Forecast 2021-2033
- 5.1. Market Analysis, Insights and Forecast - by Product Type
- 5.1.1. Nanoparticles
- 5.1.1.1. Nanometals
- 5.1.1.1.1. Gold
- 5.1.1.1.2. Silver
- 5.1.1.1.3. Platinum
- 5.1.1.1.4. Titanium
- 5.1.1.1.5. Aluminium
- 5.1.1.2. Nonmetal Oxides
- 5.1.1.2.1. Alumina
- 5.1.1.2.2. Iron Oxide
- 5.1.1.2.3. Titanium Oxide
- 5.1.1.2.4. Silica
- 5.1.1.2.5. Zinc Oxide
- 5.1.1.3. Complex Oxides
- 5.1.1.3.1. Calcium Phosphate
- 5.1.1.3.2. Rare Earth Metal Oxides
- 5.1.1.3.3. Lithium Titanate
- 5.1.1.3.4. Silica Hydride
- 5.1.1.1. Nanometals
- 5.1.2. Nanofibers
- 5.1.3. Nanotubes
- 5.1.4. Nanoclays
- 5.1.5. Nanowires
- 5.1.1. Nanoparticles
- 5.2. Market Analysis, Insights and Forecast - by Structure Type
- 5.2.1. Non-polymer Organic Nanomaterials
- 5.2.1.1. Carbon Black
- 5.2.1.2. Carbon Nanotubes
- 5.2.1.3. Aptamers
- 5.2.1.4. Small Molecule OLED
- 5.2.1.5. Activated Carbon
- 5.2.1.6. Carbon Nanotubes Composites
- 5.2.2. Polymeric Nanomaterials
- 5.2.2.1. Coatings and Adhesives
- 5.2.2.2. Transfection Reagents
- 5.2.2.3. Diagnostics Reagents
- 5.2.2.4. Drug Delivery Vehicle
- 5.2.2.5. Fabric Treatments
- 5.2.2.6. Optical Coatings
- 5.2.2.7. Nano-porous Filtration Membrane
- 5.2.2.8. Di-electric Films
- 5.2.2.9. OLED Films
- 5.2.1. Non-polymer Organic Nanomaterials
- 5.3. Market Analysis, Insights and Forecast - by End-user Industry
- 5.3.1. Construction
- 5.3.2. Electronics
- 5.3.3. Energy
- 5.3.4. Healthcare
- 5.3.5. Personal Care
- 5.3.6. Rubber
- 5.3.7. Other End-user Industries
- 5.4. Market Analysis, Insights and Forecast - by Region
- 5.4.1. Asia Pacific
- 5.4.2. North America
- 5.4.3. Europe
- 5.4.4. South America
- 5.4.5. Middle East and Africa
- 5.1. Market Analysis, Insights and Forecast - by Product Type
- 6. Global Nanomaterials Market Analysis, Insights and Forecast, 2021-2033
- 6.1. Market Analysis, Insights and Forecast - by Product Type
- 6.1.1. Nanoparticles
- 6.1.1.1. Nanometals
- 6.1.1.1.1. Gold
- 6.1.1.1.2. Silver
- 6.1.1.1.3. Platinum
- 6.1.1.1.4. Titanium
- 6.1.1.1.5. Aluminium
- 6.1.1.2. Nonmetal Oxides
- 6.1.1.2.1. Alumina
- 6.1.1.2.2. Iron Oxide
- 6.1.1.2.3. Titanium Oxide
- 6.1.1.2.4. Silica
- 6.1.1.2.5. Zinc Oxide
- 6.1.1.3. Complex Oxides
- 6.1.1.3.1. Calcium Phosphate
- 6.1.1.3.2. Rare Earth Metal Oxides
- 6.1.1.3.3. Lithium Titanate
- 6.1.1.3.4. Silica Hydride
- 6.1.1.1. Nanometals
- 6.1.2. Nanofibers
- 6.1.3. Nanotubes
- 6.1.4. Nanoclays
- 6.1.5. Nanowires
- 6.1.1. Nanoparticles
- 6.2. Market Analysis, Insights and Forecast - by Structure Type
- 6.2.1. Non-polymer Organic Nanomaterials
- 6.2.1.1. Carbon Black
- 6.2.1.2. Carbon Nanotubes
- 6.2.1.3. Aptamers
- 6.2.1.4. Small Molecule OLED
- 6.2.1.5. Activated Carbon
- 6.2.1.6. Carbon Nanotubes Composites
- 6.2.2. Polymeric Nanomaterials
- 6.2.2.1. Coatings and Adhesives
- 6.2.2.2. Transfection Reagents
- 6.2.2.3. Diagnostics Reagents
- 6.2.2.4. Drug Delivery Vehicle
- 6.2.2.5. Fabric Treatments
- 6.2.2.6. Optical Coatings
- 6.2.2.7. Nano-porous Filtration Membrane
- 6.2.2.8. Di-electric Films
- 6.2.2.9. OLED Films
- 6.2.1. Non-polymer Organic Nanomaterials
- 6.3. Market Analysis, Insights and Forecast - by End-user Industry
- 6.3.1. Construction
- 6.3.2. Electronics
- 6.3.3. Energy
- 6.3.4. Healthcare
- 6.3.5. Personal Care
- 6.3.6. Rubber
- 6.3.7. Other End-user Industries
- 6.1. Market Analysis, Insights and Forecast - by Product Type
- 7. Asia Pacific Nanomaterials Market Analysis, Insights and Forecast, 2020-2032
- 7.1. Market Analysis, Insights and Forecast - by Product Type
- 7.1.1. Nanoparticles
- 7.1.1.1. Nanometals
- 7.1.1.1.1. Gold
- 7.1.1.1.2. Silver
- 7.1.1.1.3. Platinum
- 7.1.1.1.4. Titanium
- 7.1.1.1.5. Aluminium
- 7.1.1.2. Nonmetal Oxides
- 7.1.1.2.1. Alumina
- 7.1.1.2.2. Iron Oxide
- 7.1.1.2.3. Titanium Oxide
- 7.1.1.2.4. Silica
- 7.1.1.2.5. Zinc Oxide
- 7.1.1.3. Complex Oxides
- 7.1.1.3.1. Calcium Phosphate
- 7.1.1.3.2. Rare Earth Metal Oxides
- 7.1.1.3.3. Lithium Titanate
- 7.1.1.3.4. Silica Hydride
- 7.1.1.1. Nanometals
- 7.1.2. Nanofibers
- 7.1.3. Nanotubes
- 7.1.4. Nanoclays
- 7.1.5. Nanowires
- 7.1.1. Nanoparticles
- 7.2. Market Analysis, Insights and Forecast - by Structure Type
- 7.2.1. Non-polymer Organic Nanomaterials
- 7.2.1.1. Carbon Black
- 7.2.1.2. Carbon Nanotubes
- 7.2.1.3. Aptamers
- 7.2.1.4. Small Molecule OLED
- 7.2.1.5. Activated Carbon
- 7.2.1.6. Carbon Nanotubes Composites
- 7.2.2. Polymeric Nanomaterials
- 7.2.2.1. Coatings and Adhesives
- 7.2.2.2. Transfection Reagents
- 7.2.2.3. Diagnostics Reagents
- 7.2.2.4. Drug Delivery Vehicle
- 7.2.2.5. Fabric Treatments
- 7.2.2.6. Optical Coatings
- 7.2.2.7. Nano-porous Filtration Membrane
- 7.2.2.8. Di-electric Films
- 7.2.2.9. OLED Films
- 7.2.1. Non-polymer Organic Nanomaterials
- 7.3. Market Analysis, Insights and Forecast - by End-user Industry
- 7.3.1. Construction
- 7.3.2. Electronics
- 7.3.3. Energy
- 7.3.4. Healthcare
- 7.3.5. Personal Care
- 7.3.6. Rubber
- 7.3.7. Other End-user Industries
- 7.1. Market Analysis, Insights and Forecast - by Product Type
- 8. North America Nanomaterials Market Analysis, Insights and Forecast, 2020-2032
- 8.1. Market Analysis, Insights and Forecast - by Product Type
- 8.1.1. Nanoparticles
- 8.1.1.1. Nanometals
- 8.1.1.1.1. Gold
- 8.1.1.1.2. Silver
- 8.1.1.1.3. Platinum
- 8.1.1.1.4. Titanium
- 8.1.1.1.5. Aluminium
- 8.1.1.2. Nonmetal Oxides
- 8.1.1.2.1. Alumina
- 8.1.1.2.2. Iron Oxide
- 8.1.1.2.3. Titanium Oxide
- 8.1.1.2.4. Silica
- 8.1.1.2.5. Zinc Oxide
- 8.1.1.3. Complex Oxides
- 8.1.1.3.1. Calcium Phosphate
- 8.1.1.3.2. Rare Earth Metal Oxides
- 8.1.1.3.3. Lithium Titanate
- 8.1.1.3.4. Silica Hydride
- 8.1.1.1. Nanometals
- 8.1.2. Nanofibers
- 8.1.3. Nanotubes
- 8.1.4. Nanoclays
- 8.1.5. Nanowires
- 8.1.1. Nanoparticles
- 8.2. Market Analysis, Insights and Forecast - by Structure Type
- 8.2.1. Non-polymer Organic Nanomaterials
- 8.2.1.1. Carbon Black
- 8.2.1.2. Carbon Nanotubes
- 8.2.1.3. Aptamers
- 8.2.1.4. Small Molecule OLED
- 8.2.1.5. Activated Carbon
- 8.2.1.6. Carbon Nanotubes Composites
- 8.2.2. Polymeric Nanomaterials
- 8.2.2.1. Coatings and Adhesives
- 8.2.2.2. Transfection Reagents
- 8.2.2.3. Diagnostics Reagents
- 8.2.2.4. Drug Delivery Vehicle
- 8.2.2.5. Fabric Treatments
- 8.2.2.6. Optical Coatings
- 8.2.2.7. Nano-porous Filtration Membrane
- 8.2.2.8. Di-electric Films
- 8.2.2.9. OLED Films
- 8.2.1. Non-polymer Organic Nanomaterials
- 8.3. Market Analysis, Insights and Forecast - by End-user Industry
- 8.3.1. Construction
- 8.3.2. Electronics
- 8.3.3. Energy
- 8.3.4. Healthcare
- 8.3.5. Personal Care
- 8.3.6. Rubber
- 8.3.7. Other End-user Industries
- 8.1. Market Analysis, Insights and Forecast - by Product Type
- 9. Europe Nanomaterials Market Analysis, Insights and Forecast, 2020-2032
- 9.1. Market Analysis, Insights and Forecast - by Product Type
- 9.1.1. Nanoparticles
- 9.1.1.1. Nanometals
- 9.1.1.1.1. Gold
- 9.1.1.1.2. Silver
- 9.1.1.1.3. Platinum
- 9.1.1.1.4. Titanium
- 9.1.1.1.5. Aluminium
- 9.1.1.2. Nonmetal Oxides
- 9.1.1.2.1. Alumina
- 9.1.1.2.2. Iron Oxide
- 9.1.1.2.3. Titanium Oxide
- 9.1.1.2.4. Silica
- 9.1.1.2.5. Zinc Oxide
- 9.1.1.3. Complex Oxides
- 9.1.1.3.1. Calcium Phosphate
- 9.1.1.3.2. Rare Earth Metal Oxides
- 9.1.1.3.3. Lithium Titanate
- 9.1.1.3.4. Silica Hydride
- 9.1.1.1. Nanometals
- 9.1.2. Nanofibers
- 9.1.3. Nanotubes
- 9.1.4. Nanoclays
- 9.1.5. Nanowires
- 9.1.1. Nanoparticles
- 9.2. Market Analysis, Insights and Forecast - by Structure Type
- 9.2.1. Non-polymer Organic Nanomaterials
- 9.2.1.1. Carbon Black
- 9.2.1.2. Carbon Nanotubes
- 9.2.1.3. Aptamers
- 9.2.1.4. Small Molecule OLED
- 9.2.1.5. Activated Carbon
- 9.2.1.6. Carbon Nanotubes Composites
- 9.2.2. Polymeric Nanomaterials
- 9.2.2.1. Coatings and Adhesives
- 9.2.2.2. Transfection Reagents
- 9.2.2.3. Diagnostics Reagents
- 9.2.2.4. Drug Delivery Vehicle
- 9.2.2.5. Fabric Treatments
- 9.2.2.6. Optical Coatings
- 9.2.2.7. Nano-porous Filtration Membrane
- 9.2.2.8. Di-electric Films
- 9.2.2.9. OLED Films
- 9.2.1. Non-polymer Organic Nanomaterials
- 9.3. Market Analysis, Insights and Forecast - by End-user Industry
- 9.3.1. Construction
- 9.3.2. Electronics
- 9.3.3. Energy
- 9.3.4. Healthcare
- 9.3.5. Personal Care
- 9.3.6. Rubber
- 9.3.7. Other End-user Industries
- 9.1. Market Analysis, Insights and Forecast - by Product Type
- 10. South America Nanomaterials Market Analysis, Insights and Forecast, 2020-2032
- 10.1. Market Analysis, Insights and Forecast - by Product Type
- 10.1.1. Nanoparticles
- 10.1.1.1. Nanometals
- 10.1.1.1.1. Gold
- 10.1.1.1.2. Silver
- 10.1.1.1.3. Platinum
- 10.1.1.1.4. Titanium
- 10.1.1.1.5. Aluminium
- 10.1.1.2. Nonmetal Oxides
- 10.1.1.2.1. Alumina
- 10.1.1.2.2. Iron Oxide
- 10.1.1.2.3. Titanium Oxide
- 10.1.1.2.4. Silica
- 10.1.1.2.5. Zinc Oxide
- 10.1.1.3. Complex Oxides
- 10.1.1.3.1. Calcium Phosphate
- 10.1.1.3.2. Rare Earth Metal Oxides
- 10.1.1.3.3. Lithium Titanate
- 10.1.1.3.4. Silica Hydride
- 10.1.1.1. Nanometals
- 10.1.2. Nanofibers
- 10.1.3. Nanotubes
- 10.1.4. Nanoclays
- 10.1.5. Nanowires
- 10.1.1. Nanoparticles
- 10.2. Market Analysis, Insights and Forecast - by Structure Type
- 10.2.1. Non-polymer Organic Nanomaterials
- 10.2.1.1. Carbon Black
- 10.2.1.2. Carbon Nanotubes
- 10.2.1.3. Aptamers
- 10.2.1.4. Small Molecule OLED
- 10.2.1.5. Activated Carbon
- 10.2.1.6. Carbon Nanotubes Composites
- 10.2.2. Polymeric Nanomaterials
- 10.2.2.1. Coatings and Adhesives
- 10.2.2.2. Transfection Reagents
- 10.2.2.3. Diagnostics Reagents
- 10.2.2.4. Drug Delivery Vehicle
- 10.2.2.5. Fabric Treatments
- 10.2.2.6. Optical Coatings
- 10.2.2.7. Nano-porous Filtration Membrane
- 10.2.2.8. Di-electric Films
- 10.2.2.9. OLED Films
- 10.2.1. Non-polymer Organic Nanomaterials
- 10.3. Market Analysis, Insights and Forecast - by End-user Industry
- 10.3.1. Construction
- 10.3.2. Electronics
- 10.3.3. Energy
- 10.3.4. Healthcare
- 10.3.5. Personal Care
- 10.3.6. Rubber
- 10.3.7. Other End-user Industries
- 10.1. Market Analysis, Insights and Forecast - by Product Type
- 11. Middle East and Africa Nanomaterials Market Analysis, Insights and Forecast, 2020-2032
- 11.1. Market Analysis, Insights and Forecast - by Product Type
- 11.1.1. Nanoparticles
- 11.1.1.1. Nanometals
- 11.1.1.1.1. Gold
- 11.1.1.1.2. Silver
- 11.1.1.1.3. Platinum
- 11.1.1.1.4. Titanium
- 11.1.1.1.5. Aluminium
- 11.1.1.2. Nonmetal Oxides
- 11.1.1.2.1. Alumina
- 11.1.1.2.2. Iron Oxide
- 11.1.1.2.3. Titanium Oxide
- 11.1.1.2.4. Silica
- 11.1.1.2.5. Zinc Oxide
- 11.1.1.3. Complex Oxides
- 11.1.1.3.1. Calcium Phosphate
- 11.1.1.3.2. Rare Earth Metal Oxides
- 11.1.1.3.3. Lithium Titanate
- 11.1.1.3.4. Silica Hydride
- 11.1.1.1. Nanometals
- 11.1.2. Nanofibers
- 11.1.3. Nanotubes
- 11.1.4. Nanoclays
- 11.1.5. Nanowires
- 11.1.1. Nanoparticles
- 11.2. Market Analysis, Insights and Forecast - by Structure Type
- 11.2.1. Non-polymer Organic Nanomaterials
- 11.2.1.1. Carbon Black
- 11.2.1.2. Carbon Nanotubes
- 11.2.1.3. Aptamers
- 11.2.1.4. Small Molecule OLED
- 11.2.1.5. Activated Carbon
- 11.2.1.6. Carbon Nanotubes Composites
- 11.2.2. Polymeric Nanomaterials
- 11.2.2.1. Coatings and Adhesives
- 11.2.2.2. Transfection Reagents
- 11.2.2.3. Diagnostics Reagents
- 11.2.2.4. Drug Delivery Vehicle
- 11.2.2.5. Fabric Treatments
- 11.2.2.6. Optical Coatings
- 11.2.2.7. Nano-porous Filtration Membrane
- 11.2.2.8. Di-electric Films
- 11.2.2.9. OLED Films
- 11.2.1. Non-polymer Organic Nanomaterials
- 11.3. Market Analysis, Insights and Forecast - by End-user Industry
- 11.3.1. Construction
- 11.3.2. Electronics
- 11.3.3. Energy
- 11.3.4. Healthcare
- 11.3.5. Personal Care
- 11.3.6. Rubber
- 11.3.7. Other End-user Industries
- 11.1. Market Analysis, Insights and Forecast - by Product Type
- 12. Competitive Analysis
- 12.1. Company Profiles
- 12.1.1 ZYVEX TECHNOLOGIES*List Not Exhaustive
- 12.1.1.1. Company Overview
- 12.1.1.2. Products
- 12.1.1.3. Company Financials
- 12.1.1.4. SWOT Analysis
- 12.1.2 Jiangsu Cnano Technology Co Ltd
- 12.1.2.1. Company Overview
- 12.1.2.2. Products
- 12.1.2.3. Company Financials
- 12.1.2.4. SWOT Analysis
- 12.1.3 ACS Material
- 12.1.3.1. Company Overview
- 12.1.3.2. Products
- 12.1.3.3. Company Financials
- 12.1.3.4. SWOT Analysis
- 12.1.4 Raymor Industries Inc
- 12.1.4.1. Company Overview
- 12.1.4.2. Products
- 12.1.4.3. Company Financials
- 12.1.4.4. SWOT Analysis
- 12.1.5 American Elements
- 12.1.5.1. Company Overview
- 12.1.5.2. Products
- 12.1.5.3. Company Financials
- 12.1.5.4. SWOT Analysis
- 12.1.6 Cabot Corporation
- 12.1.6.1. Company Overview
- 12.1.6.2. Products
- 12.1.6.3. Company Financials
- 12.1.6.4. SWOT Analysis
- 12.1.7 Nanophase Technologies Corporation
- 12.1.7.1. Company Overview
- 12.1.7.2. Products
- 12.1.7.3. Company Financials
- 12.1.7.4. SWOT Analysis
- 12.1.8 BASF SE
- 12.1.8.1. Company Overview
- 12.1.8.2. Products
- 12.1.8.3. Company Financials
- 12.1.8.4. SWOT Analysis
- 12.1.9 Nanocyl SA
- 12.1.9.1. Company Overview
- 12.1.9.2. Products
- 12.1.9.3. Company Financials
- 12.1.9.4. SWOT Analysis
- 12.1.10 Arkema Group
- 12.1.10.1. Company Overview
- 12.1.10.2. Products
- 12.1.10.3. Company Financials
- 12.1.10.4. SWOT Analysis
- 12.1.11 LG Chem
- 12.1.11.1. Company Overview
- 12.1.11.2. Products
- 12.1.11.3. Company Financials
- 12.1.11.4. SWOT Analysis
- 12.1.12 Nano-C
- 12.1.12.1. Company Overview
- 12.1.12.2. Products
- 12.1.12.3. Company Financials
- 12.1.12.4. SWOT Analysis
- 12.1.13 Chengdu Organic Chemicals Co Ltd (Timesnano)
- 12.1.13.1. Company Overview
- 12.1.13.2. Products
- 12.1.13.3. Company Financials
- 12.1.13.4. SWOT Analysis
- 12.1.14 CHASM Advanced Materials Inc
- 12.1.14.1. Company Overview
- 12.1.14.2. Products
- 12.1.14.3. Company Financials
- 12.1.14.4. SWOT Analysis
- 12.1.15 SHOWA DENKO K K
- 12.1.15.1. Company Overview
- 12.1.15.2. Products
- 12.1.15.3. Company Financials
- 12.1.15.4. SWOT Analysis
- 12.1.16 OCSiAl
- 12.1.16.1. Company Overview
- 12.1.16.2. Products
- 12.1.16.3. Company Financials
- 12.1.16.4. SWOT Analysis
- 12.1.1 ZYVEX TECHNOLOGIES*List Not Exhaustive
- 12.2. Market Entropy
- 12.2.1 Company's Key Areas Served
- 12.2.2 Recent Developments
- 12.3. Company Market Share Analysis 2025
- 12.3.1 Top 5 Companies Market Share Analysis
- 12.3.2 Top 3 Companies Market Share Analysis
- 12.4. List of Potential Customers
- 13. Research Methodology
List of Figures
- Figure 1: Global Nanomaterials Market Revenue Breakdown (billion, %) by Region 2025 & 2033
- Figure 2: Asia Pacific Nanomaterials Market Revenue (billion), by Product Type 2025 & 2033
- Figure 3: Asia Pacific Nanomaterials Market Revenue Share (%), by Product Type 2025 & 2033
- Figure 4: Asia Pacific Nanomaterials Market Revenue (billion), by Structure Type 2025 & 2033
- Figure 5: Asia Pacific Nanomaterials Market Revenue Share (%), by Structure Type 2025 & 2033
- Figure 6: Asia Pacific Nanomaterials Market Revenue (billion), by End-user Industry 2025 & 2033
- Figure 7: Asia Pacific Nanomaterials Market Revenue Share (%), by End-user Industry 2025 & 2033
- Figure 8: Asia Pacific Nanomaterials Market Revenue (billion), by Country 2025 & 2033
- Figure 9: Asia Pacific Nanomaterials Market Revenue Share (%), by Country 2025 & 2033
- Figure 10: North America Nanomaterials Market Revenue (billion), by Product Type 2025 & 2033
- Figure 11: North America Nanomaterials Market Revenue Share (%), by Product Type 2025 & 2033
- Figure 12: North America Nanomaterials Market Revenue (billion), by Structure Type 2025 & 2033
- Figure 13: North America Nanomaterials Market Revenue Share (%), by Structure Type 2025 & 2033
- Figure 14: North America Nanomaterials Market Revenue (billion), by End-user Industry 2025 & 2033
- Figure 15: North America Nanomaterials Market Revenue Share (%), by End-user Industry 2025 & 2033
- Figure 16: North America Nanomaterials Market Revenue (billion), by Country 2025 & 2033
- Figure 17: North America Nanomaterials Market Revenue Share (%), by Country 2025 & 2033
- Figure 18: Europe Nanomaterials Market Revenue (billion), by Product Type 2025 & 2033
- Figure 19: Europe Nanomaterials Market Revenue Share (%), by Product Type 2025 & 2033
- Figure 20: Europe Nanomaterials Market Revenue (billion), by Structure Type 2025 & 2033
- Figure 21: Europe Nanomaterials Market Revenue Share (%), by Structure Type 2025 & 2033
- Figure 22: Europe Nanomaterials Market Revenue (billion), by End-user Industry 2025 & 2033
- Figure 23: Europe Nanomaterials Market Revenue Share (%), by End-user Industry 2025 & 2033
- Figure 24: Europe Nanomaterials Market Revenue (billion), by Country 2025 & 2033
- Figure 25: Europe Nanomaterials Market Revenue Share (%), by Country 2025 & 2033
- Figure 26: South America Nanomaterials Market Revenue (billion), by Product Type 2025 & 2033
- Figure 27: South America Nanomaterials Market Revenue Share (%), by Product Type 2025 & 2033
- Figure 28: South America Nanomaterials Market Revenue (billion), by Structure Type 2025 & 2033
- Figure 29: South America Nanomaterials Market Revenue Share (%), by Structure Type 2025 & 2033
- Figure 30: South America Nanomaterials Market Revenue (billion), by End-user Industry 2025 & 2033
- Figure 31: South America Nanomaterials Market Revenue Share (%), by End-user Industry 2025 & 2033
- Figure 32: South America Nanomaterials Market Revenue (billion), by Country 2025 & 2033
- Figure 33: South America Nanomaterials Market Revenue Share (%), by Country 2025 & 2033
- Figure 34: Middle East and Africa Nanomaterials Market Revenue (billion), by Product Type 2025 & 2033
- Figure 35: Middle East and Africa Nanomaterials Market Revenue Share (%), by Product Type 2025 & 2033
- Figure 36: Middle East and Africa Nanomaterials Market Revenue (billion), by Structure Type 2025 & 2033
- Figure 37: Middle East and Africa Nanomaterials Market Revenue Share (%), by Structure Type 2025 & 2033
- Figure 38: Middle East and Africa Nanomaterials Market Revenue (billion), by End-user Industry 2025 & 2033
- Figure 39: Middle East and Africa Nanomaterials Market Revenue Share (%), by End-user Industry 2025 & 2033
- Figure 40: Middle East and Africa Nanomaterials Market Revenue (billion), by Country 2025 & 2033
- Figure 41: Middle East and Africa Nanomaterials Market Revenue Share (%), by Country 2025 & 2033
List of Tables
- Table 1: Global Nanomaterials Market Revenue billion Forecast, by Product Type 2020 & 2033
- Table 2: Global Nanomaterials Market Revenue billion Forecast, by Structure Type 2020 & 2033
- Table 3: Global Nanomaterials Market Revenue billion Forecast, by End-user Industry 2020 & 2033
- Table 4: Global Nanomaterials Market Revenue billion Forecast, by Region 2020 & 2033
- Table 5: Global Nanomaterials Market Revenue billion Forecast, by Product Type 2020 & 2033
- Table 6: Global Nanomaterials Market Revenue billion Forecast, by Structure Type 2020 & 2033
- Table 7: Global Nanomaterials Market Revenue billion Forecast, by End-user Industry 2020 & 2033
- Table 8: Global Nanomaterials Market Revenue billion Forecast, by Country 2020 & 2033
- Table 9: China Nanomaterials Market Revenue (billion) Forecast, by Application 2020 & 2033
- Table 10: India Nanomaterials Market Revenue (billion) Forecast, by Application 2020 & 2033
- Table 11: Japan Nanomaterials Market Revenue (billion) Forecast, by Application 2020 & 2033
- Table 12: South Korea Nanomaterials Market Revenue (billion) Forecast, by Application 2020 & 2033
- Table 13: ASEAN Countries Nanomaterials Market Revenue (billion) Forecast, by Application 2020 & 2033
- Table 14: Rest of Asia Pacific Nanomaterials Market Revenue (billion) Forecast, by Application 2020 & 2033
- Table 15: Global Nanomaterials Market Revenue billion Forecast, by Product Type 2020 & 2033
- Table 16: Global Nanomaterials Market Revenue billion Forecast, by Structure Type 2020 & 2033
- Table 17: Global Nanomaterials Market Revenue billion Forecast, by End-user Industry 2020 & 2033
- Table 18: Global Nanomaterials Market Revenue billion Forecast, by Country 2020 & 2033
- Table 19: United States Nanomaterials Market Revenue (billion) Forecast, by Application 2020 & 2033
- Table 20: Canada Nanomaterials Market Revenue (billion) Forecast, by Application 2020 & 2033
- Table 21: Mexico Nanomaterials Market Revenue (billion) Forecast, by Application 2020 & 2033
- Table 22: Global Nanomaterials Market Revenue billion Forecast, by Product Type 2020 & 2033
- Table 23: Global Nanomaterials Market Revenue billion Forecast, by Structure Type 2020 & 2033
- Table 24: Global Nanomaterials Market Revenue billion Forecast, by End-user Industry 2020 & 2033
- Table 25: Global Nanomaterials Market Revenue billion Forecast, by Country 2020 & 2033
- Table 26: Germany Nanomaterials Market Revenue (billion) Forecast, by Application 2020 & 2033
- Table 27: United Kingdom Nanomaterials Market Revenue (billion) Forecast, by Application 2020 & 2033
- Table 28: Italy Nanomaterials Market Revenue (billion) Forecast, by Application 2020 & 2033
- Table 29: France Nanomaterials Market Revenue (billion) Forecast, by Application 2020 & 2033
- Table 30: Rest of Europe Nanomaterials Market Revenue (billion) Forecast, by Application 2020 & 2033
- Table 31: Global Nanomaterials Market Revenue billion Forecast, by Product Type 2020 & 2033
- Table 32: Global Nanomaterials Market Revenue billion Forecast, by Structure Type 2020 & 2033
- Table 33: Global Nanomaterials Market Revenue billion Forecast, by End-user Industry 2020 & 2033
- Table 34: Global Nanomaterials Market Revenue billion Forecast, by Country 2020 & 2033
- Table 35: Brazil Nanomaterials Market Revenue (billion) Forecast, by Application 2020 & 2033
- Table 36: Argentina Nanomaterials Market Revenue (billion) Forecast, by Application 2020 & 2033
- Table 37: Rest of South America Nanomaterials Market Revenue (billion) Forecast, by Application 2020 & 2033
- Table 38: Global Nanomaterials Market Revenue billion Forecast, by Product Type 2020 & 2033
- Table 39: Global Nanomaterials Market Revenue billion Forecast, by Structure Type 2020 & 2033
- Table 40: Global Nanomaterials Market Revenue billion Forecast, by End-user Industry 2020 & 2033
- Table 41: Global Nanomaterials Market Revenue billion Forecast, by Country 2020 & 2033
- Table 42: Saudi Arabia Nanomaterials Market Revenue (billion) Forecast, by Application 2020 & 2033
- Table 43: South Africa Nanomaterials Market Revenue (billion) Forecast, by Application 2020 & 2033
- Table 44: Rest of Middle East and Africa Nanomaterials Market Revenue (billion) Forecast, by Application 2020 & 2033
Frequently Asked Questions
1. What is the projected Compound Annual Growth Rate (CAGR) of the Nanomaterials Market?
The projected CAGR is approximately 15.4%.
2. Which companies are prominent players in the Nanomaterials Market?
Key companies in the market include ZYVEX TECHNOLOGIES*List Not Exhaustive, Jiangsu Cnano Technology Co Ltd, ACS Material, Raymor Industries Inc, American Elements, Cabot Corporation, Nanophase Technologies Corporation, BASF SE, Nanocyl SA, Arkema Group, LG Chem, Nano-C, Chengdu Organic Chemicals Co Ltd (Timesnano), CHASM Advanced Materials Inc, SHOWA DENKO K K, OCSiAl.
3. What are the main segments of the Nanomaterials Market?
The market segments include Product Type, Structure Type, End-user Industry.
4. Can you provide details about the market size?
The market size is estimated to be USD 16.3 billion as of 2022.
5. What are some drivers contributing to market growth?
Growing Usage of Nanomedicines in the Healthcare Industry; Increasing Usage of Nanomaterials in Water Treatment Applications.
6. What are the notable trends driving market growth?
The Electrical and Electronics Segment to Dominate the Market.
7. Are there any restraints impacting market growth?
Higher Costs of Technology.
8. Can you provide examples of recent developments in the market?
In November 2022, American Elements launched a novel nanoscale electrolyte material that will be used in lithium-ion batteries. The electrolyte is an energy-dense and ceramic compound of lithium, lanthanum, and zirconium oxide nanoparticles.
9. What pricing options are available for accessing the report?
Pricing options include single-user, multi-user, and enterprise licenses priced at USD 4750, USD 5250, and USD 8750 respectively.
10. Is the market size provided in terms of value or volume?
The market size is provided in terms of value, measured in billion.
11. Are there any specific market keywords associated with the report?
Yes, the market keyword associated with the report is "Nanomaterials Market," which aids in identifying and referencing the specific market segment covered.
12. How do I determine which pricing option suits my needs best?
The pricing options vary based on user requirements and access needs. Individual users may opt for single-user licenses, while businesses requiring broader access may choose multi-user or enterprise licenses for cost-effective access to the report.
13. Are there any additional resources or data provided in the Nanomaterials Market report?
While the report offers comprehensive insights, it's advisable to review the specific contents or supplementary materials provided to ascertain if additional resources or data are available.
14. How can I stay updated on further developments or reports in the Nanomaterials Market?
To stay informed about further developments, trends, and reports in the Nanomaterials Market, consider subscribing to industry newsletters, following relevant companies and organizations, or regularly checking reputable industry news sources and publications.
Methodology
Step 1 - Identification of Relevant Samples Size from Population Database


Step 2 - Approaches for Defining Global Market Size (Value, Volume* & Price*)

Note*: In applicable scenarios
Step 3 - Data Sources
Primary Research
- Web Analytics
- Survey Reports
- Research Institute
- Latest Research Reports
- Opinion Leaders
Secondary Research
- Annual Reports
- White Paper
- Latest Press Release
- Industry Association
- Paid Database
- Investor Presentations

Step 4 - Data Triangulation
Involves using different sources of information in order to increase the validity of a study
These sources are likely to be stakeholders in a program - participants, other researchers, program staff, other community members, and so on.
Then we put all data in single framework & apply various statistical tools to find out the dynamic on the market.
During the analysis stage, feedback from the stakeholder groups would be compared to determine areas of agreement as well as areas of divergence