

Key Insights
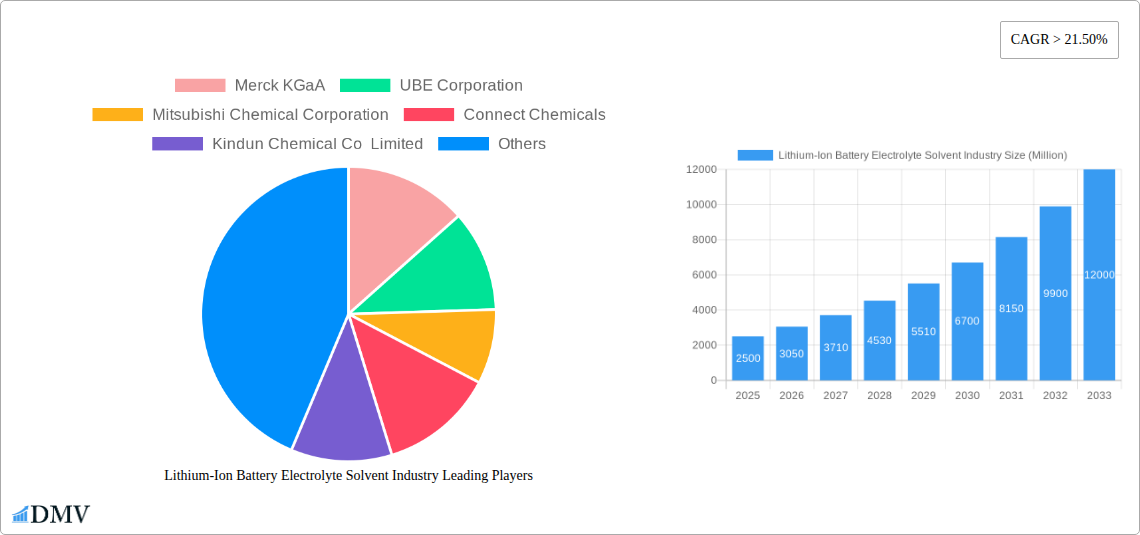
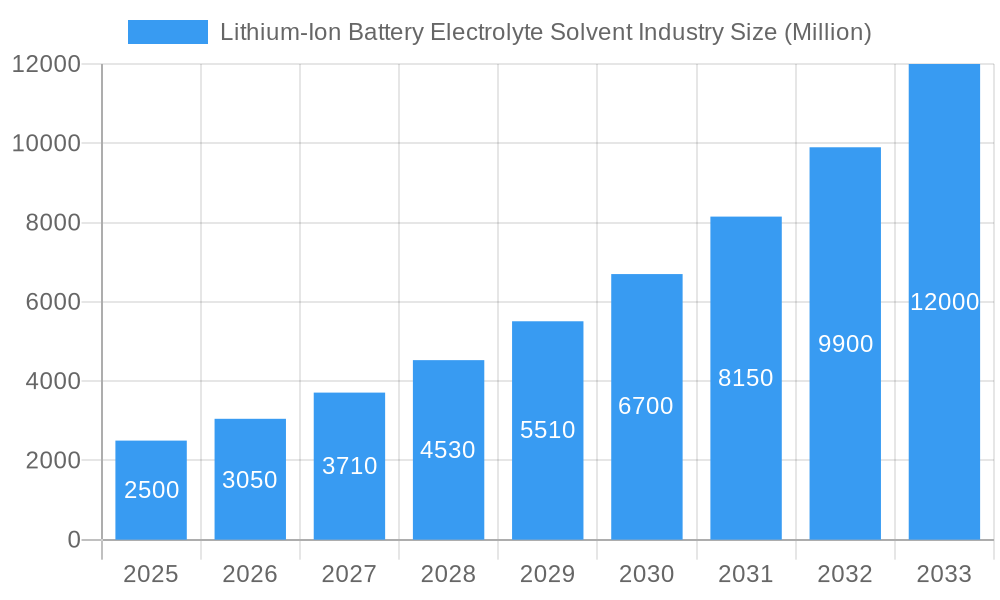
The global Lithium-ion Battery Electrolyte Solvent market is poised for significant expansion, propelled by surging demand from the electric vehicle (EV), energy storage system (ESS), and portable electronics sectors. The market was valued at $8.369 billion in the base year 2025 and is projected to grow at a Compound Annual Growth Rate (CAGR) of 12.83% during the forecast period (2025-2033). Key growth catalysts include the global decarbonization imperative, substantial investments in renewable energy infrastructure, and ongoing advancements in battery technology, resulting in higher energy density and extended battery life. The primary solvent types utilized are Ethylene Carbonate (EC), Diethyl Carbonate (DEC), Dimethyl Carbonate (DMC), and Propylene Carbonate (PC), each tailored to specific battery chemistries and performance requirements. Market segmentation by application highlights robust growth in EV and ESS, surpassing the mature consumer electronics segment. Geographically, the Asia-Pacific region, led by China, commands a dominant market share due to its advanced manufacturing capabilities and high demand for EVs and energy storage solutions. The competitive environment is characterized by intense rivalry, with leading companies like Merck KGaA, UBE Corporation, and BASF SE heavily investing in research and development to enhance product offerings and broaden their market presence. However, persistent challenges include volatile raw material prices and environmental considerations associated with solvent production and disposal.
Lithium-Ion Battery Electrolyte Solvent Industry Market Size (In Billion)
The market's strong growth trajectory is underpinned by several factors. Continuous technological innovations in battery chemistry are enabling the development of more efficient and safer electrolyte formulations, directly stimulating demand for specialized solvents. Government policies promoting EV adoption and renewable energy sources further bolster market expansion. Moreover, heightened global awareness of climate change and the urgent need for sustainable energy solutions are driving increased R&D investment and manufacturing capacity within the industry. While growth is anticipated across all regions, Asia-Pacific is expected to maintain its leadership due to early adoption of EV technologies and its extensive manufacturing infrastructure. The competitive landscape is likely to witness further consolidation through strategic mergers and acquisitions as companies pursue economies of scale and portfolio diversification.
Lithium-Ion Battery Electrolyte Solvent Industry Company Market Share
Lithium-Ion Battery Electrolyte Solvent Industry: A Comprehensive Market Report (2019-2033)
This insightful report provides a comprehensive analysis of the Lithium-Ion Battery Electrolyte Solvent industry, offering valuable market intelligence for stakeholders. Covering the period 2019-2033, with a focus on 2025, this report delves into market dynamics, competitive landscapes, and future growth prospects. The report incorporates detailed segmentation by application (Power Backups/UPS, Mobile, Laptops, Consumer Electronics, Electric Mobility/Vehicles, Energy Storage Systems, Other Applications) and solvent type (Ethylene Carbonate (EC), Diethyl Carbonate (DEC), Dimethyl Carbonate (DMC), Ethyl Methyl Carbonate (EMC), Propylene Carbonate (PC), Other Solvent Types), offering a granular understanding of this crucial industry. The market is projected to reach xx Million by 2033, exhibiting robust growth driven by the burgeoning electric vehicle and energy storage sectors.
Lithium-Ion Battery Electrolyte Solvent Industry Market Composition & Trends
This section analyzes the market concentration, pinpointing key players and their market share distribution. We examine innovation catalysts driving advancements in solvent technology, the regulatory landscape impacting production and usage, substitute product analysis, comprehensive end-user profiles, and a detailed review of recent mergers and acquisitions (M&A) activity, including deal values. The highly competitive nature of the market is highlighted, with leading players continuously investing in R&D to improve battery performance and lifespan.
- Market Concentration: The market exhibits a moderately concentrated structure with top 10 players holding approximately xx% of the market share in 2024.
- Innovation Catalysts: Focus on high-performance solvents, improved safety profiles, and cost reduction strategies are key drivers of innovation.
- Regulatory Landscape: Stringent environmental regulations and safety standards are shaping industry practices.
- Substitute Products: Limited viable substitutes currently exist, solidifying the dominant position of lithium-ion battery electrolyte solvents.
- End-User Profiles: Detailed analysis of end-user segments and their specific solvent requirements.
- M&A Activities: Analysis of recent M&A activity, with deal values totaling approximately xx Million in the past five years. Examples include strategic acquisitions aimed at expanding production capacity and geographical reach.
Lithium-Ion Battery Electrolyte Solvent Industry Evolution
This section meticulously tracks the evolution of the Lithium-Ion Battery Electrolyte Solvent industry from 2019 to 2033. We explore the market's growth trajectory, dissecting historical growth rates (xx% CAGR from 2019-2024) and projecting future growth based on current trends and anticipated technological advancements. The analysis encompasses the influence of evolving consumer demands for higher energy density, longer lifespan, and enhanced safety in batteries. The increasing adoption of electric vehicles and energy storage systems serves as a primary growth catalyst. Technological advancements in solvent formulations, manufacturing processes, and recycling technologies are comprehensively analyzed. The report provides detailed insight into the shift towards sustainable and environmentally friendly solvent solutions.
Leading Regions, Countries, or Segments in Lithium-Ion Battery Electrolyte Solvent Industry
This section identifies the leading regions, countries, and segments within the industry. The analysis is broken down by both application and solvent type, highlighting factors driving dominance in each area.
Dominant Segments:
- Application: Electric Mobility/Vehicles is the fastest-growing segment, driven by the global transition to electric transportation. Energy Storage Systems represents a substantial market segment with significant growth potential.
- Solvent Type: Ethylene Carbonate (EC) and Dimethyl Carbonate (DMC) currently hold the largest market share due to their established performance characteristics. However, the demand for alternative solvents with improved safety and performance is growing.
Key Drivers:
- Investment Trends: Significant investments in new production capacity, particularly in Asia and North America, are bolstering market growth.
- Regulatory Support: Government incentives and policies promoting electric vehicle adoption and renewable energy storage are driving demand.
The dominance of specific regions is attributed to factors such as established manufacturing bases, supportive government policies, and proximity to major end-users.
Lithium-Ion Battery Electrolyte Solvent Industry Product Innovations
Recent innovations focus on enhancing solvent performance, including improved thermal stability, wider electrochemical windows, and reduced flammability. These advancements contribute to the development of higher energy density and safer lithium-ion batteries. The integration of advanced materials and novel manufacturing processes have also enabled the development of more efficient and cost-effective solvent production methods. The industry is actively researching and developing next-generation solvents with superior properties.
Propelling Factors for Lithium-Ion Battery Electrolyte Solvent Industry Growth
The industry’s growth is driven by several interconnected factors. The burgeoning electric vehicle market is a significant driver, demanding large quantities of high-performance battery electrolytes. Furthermore, the increasing adoption of renewable energy sources, such as solar and wind power, is fueling the demand for energy storage solutions, further boosting the demand for electrolyte solvents. Government policies supporting the transition to sustainable energy and electric mobility also provide substantial impetus. Technological advancements leading to improved battery performance and safety contribute to market expansion.
Obstacles in the Lithium-Ion Battery Electrolyte Solvent Industry Market
Despite promising growth prospects, the industry faces challenges. Supply chain disruptions caused by geopolitical factors and raw material price fluctuations pose significant risks. Stringent environmental regulations and safety standards can increase production costs. Intense competition among established players and emerging entrants also puts pressure on profit margins. The volatility of raw material prices, such as lithium and other precursors, impacts production costs and profitability.
Future Opportunities in Lithium-Ion Battery Electrolyte Solvent Industry
Future growth lies in several areas. The expansion into new markets, such as grid-scale energy storage and other emerging applications, presents significant opportunities. Technological innovation, including the development of solid-state batteries and advanced solvent formulations, will reshape the market. Meeting the increasing demand for sustainable and environmentally friendly solutions will be crucial for future success. The exploration of novel solvent chemistries with enhanced performance characteristics presents a significant opportunity.
Major Players in the Lithium-Ion Battery Electrolyte Solvent Industry Ecosystem
- Merck KGaA
- UBE Corporation
- Mitsubishi Chemical Corporation
- Connect Chemicals
- Kindun Chemical Co Limited
- OUCC
- Lotte Chemical
- Dongwha Electrolyte
- BASF SE
- Huntsman International LLC
- Sankyo Chemical Co Ltd
- Zhengzhou Meiya Chemical Products Co Ltd
- Shenzhen Capchem Technology Co Ltd (CAPCHEM)
- Lixing Chemical
Key Developments in Lithium-Ion Battery Electrolyte Solvent Industry Industry
- July 2022: UBE Corporation initiated feasibility studies for a new DMC and EMC production plant in Louisiana, USA, with a planned capacity of 100,000 metric tons/year of DMC and 40,000 metric tons/year of EMC. This expansion signifies a major investment in the North American market.
- February 2022: Lotte Chemical invested ~USD 502 Million in expanding its high-purity organic solvent production capacity, specifically targeting ethylene carbonate and dimethyl carbonate for lithium-ion batteries. This investment highlights the growing demand for these key solvents.
Strategic Lithium-Ion Battery Electrolyte Solvent Industry Market Forecast
The Lithium-Ion Battery Electrolyte Solvent market is poised for substantial growth, driven by the increasing adoption of electric vehicles and energy storage systems. Continuous technological advancements, coupled with supportive government policies, will further accelerate market expansion. The focus on sustainability and the development of eco-friendly solvents will shape future industry trends. The market is expected to experience robust growth throughout the forecast period (2025-2033), with substantial opportunities for market participants.
Lithium-Ion Battery Electrolyte Solvent Industry Segmentation
-
1. Solvent Type
- 1.1. Ethylene Carbonate (EC)
- 1.2. Diethyl Carbonate (DEC)
- 1.3. Dimethyl Carbonate (DMC)
- 1.4. Ethyl Methyl Carbonate (EMC)
- 1.5. Propylene Carbonate (PC)
- 1.6. Other Solvent Types
-
2. Application
- 2.1. Power Backups/UPS
- 2.2. Mobile,
- 2.3. Electric Mobility/Vehicles
- 2.4. Energy Storage Systems
- 2.5. Other Applications
Lithium-Ion Battery Electrolyte Solvent Industry Segmentation By Geography
-
1. Asia Pacific
- 1.1. China
- 1.2. India
- 1.3. Japan
- 1.4. South Korea
- 1.5. ASEAN Countries
- 1.6. Rest of Asia Pacific
-
2. North America
- 2.1. United States
- 2.2. Canada
- 2.3. Mexico
-
3. Europe
- 3.1. Germany
- 3.2. France
- 3.3. United Kingdom
- 3.4. Italy
- 3.5. Rest of Europe
-
4. South America
- 4.1. Brazil
- 4.2. Argentina
- 4.3. Rest of South America
-
5. Middle East and Africa
- 5.1. Saudi Arabia
- 5.2. South Africa
- 5.3. Rest of Middle East and Africa
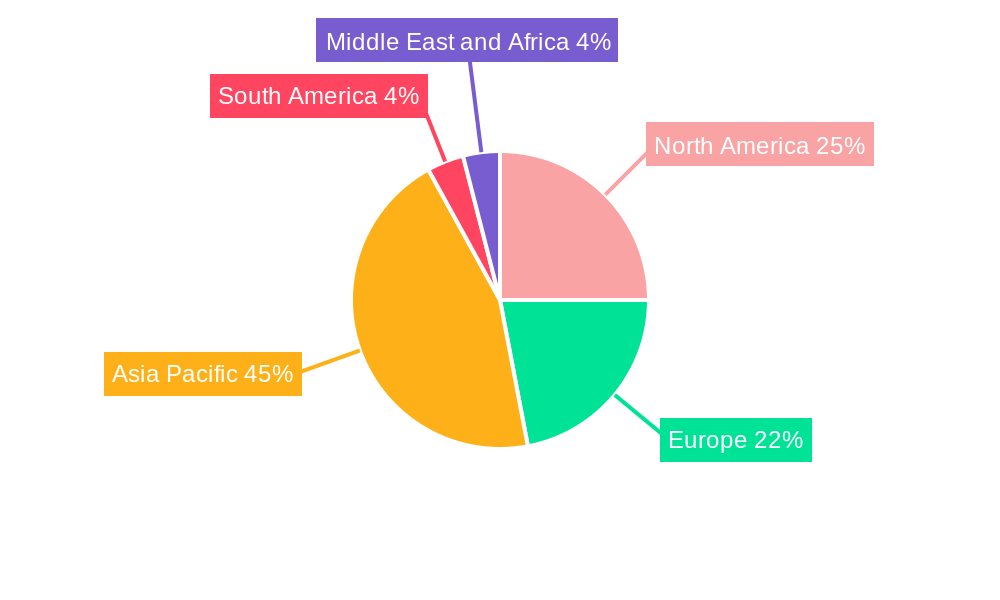
Lithium-Ion Battery Electrolyte Solvent Industry Regional Market Share
Geographic Coverage of Lithium-Ion Battery Electrolyte Solvent Industry
Lithium-Ion Battery Electrolyte Solvent Industry REPORT HIGHLIGHTS
| Aspects | Details |
|---|---|
| Study Period | 2020-2034 |
| Base Year | 2025 |
| Estimated Year | 2026 |
| Forecast Period | 2026-2034 |
| Historical Period | 2020-2025 |
| Growth Rate | CAGR of 12.83% from 2020-2034 |
| Segmentation |
|
Table of Contents
- 1. Introduction
- 1.1. Research Scope
- 1.2. Market Segmentation
- 1.3. Research Objective
- 1.4. Definitions and Assumptions
- 2. Executive Summary
- 2.1. Market Snapshot
- 3. Market Dynamics
- 3.1. Market Drivers
- 3.2. Market Restrains
- 3.3. Market Trends
- 3.4. Market Opportunities
- 4. Market Factor Analysis
- 4.1. Porters Five Forces
- 4.1.1. Bargaining Power of Suppliers
- 4.1.2. Bargaining Power of Buyers
- 4.1.3. Threat of New Entrants
- 4.1.4. Threat of Substitutes
- 4.1.5. Competitive Rivalry
- 4.2. PESTEL analysis
- 4.3. BCG Analysis
- 4.3.1. Stars (High Growth, High Market Share)
- 4.3.2. Cash Cows (Low Growth, High Market Share)
- 4.3.3. Question Mark (High Growth, Low Market Share)
- 4.3.4. Dogs (Low Growth, Low Market Share)
- 4.4. Ansoff Matrix Analysis
- 4.5. Supply Chain Analysis
- 4.6. Regulatory Landscape
- 4.7. Current Market Potential and Opportunity Assessment (TAM–SAM–SOM Framework)
- 4.8. DMV Analyst Note
- 4.1. Porters Five Forces
- 5. Market Analysis, Insights and Forecast 2021-2033
- 5.1. Market Analysis, Insights and Forecast - by Solvent Type
- 5.1.1. Ethylene Carbonate (EC)
- 5.1.2. Diethyl Carbonate (DEC)
- 5.1.3. Dimethyl Carbonate (DMC)
- 5.1.4. Ethyl Methyl Carbonate (EMC)
- 5.1.5. Propylene Carbonate (PC)
- 5.1.6. Other Solvent Types
- 5.2. Market Analysis, Insights and Forecast - by Application
- 5.2.1. Power Backups/UPS
- 5.2.2. Mobile,
- 5.2.3. Electric Mobility/Vehicles
- 5.2.4. Energy Storage Systems
- 5.2.5. Other Applications
- 5.3. Market Analysis, Insights and Forecast - by Region
- 5.3.1. Asia Pacific
- 5.3.2. North America
- 5.3.3. Europe
- 5.3.4. South America
- 5.3.5. Middle East and Africa
- 5.1. Market Analysis, Insights and Forecast - by Solvent Type
- 6. Global Lithium-Ion Battery Electrolyte Solvent Industry Analysis, Insights and Forecast, 2021-2033
- 6.1. Market Analysis, Insights and Forecast - by Solvent Type
- 6.1.1. Ethylene Carbonate (EC)
- 6.1.2. Diethyl Carbonate (DEC)
- 6.1.3. Dimethyl Carbonate (DMC)
- 6.1.4. Ethyl Methyl Carbonate (EMC)
- 6.1.5. Propylene Carbonate (PC)
- 6.1.6. Other Solvent Types
- 6.2. Market Analysis, Insights and Forecast - by Application
- 6.2.1. Power Backups/UPS
- 6.2.2. Mobile,
- 6.2.3. Electric Mobility/Vehicles
- 6.2.4. Energy Storage Systems
- 6.2.5. Other Applications
- 6.1. Market Analysis, Insights and Forecast - by Solvent Type
- 7. Asia Pacific Lithium-Ion Battery Electrolyte Solvent Industry Analysis, Insights and Forecast, 2020-2032
- 7.1. Market Analysis, Insights and Forecast - by Solvent Type
- 7.1.1. Ethylene Carbonate (EC)
- 7.1.2. Diethyl Carbonate (DEC)
- 7.1.3. Dimethyl Carbonate (DMC)
- 7.1.4. Ethyl Methyl Carbonate (EMC)
- 7.1.5. Propylene Carbonate (PC)
- 7.1.6. Other Solvent Types
- 7.2. Market Analysis, Insights and Forecast - by Application
- 7.2.1. Power Backups/UPS
- 7.2.2. Mobile,
- 7.2.3. Electric Mobility/Vehicles
- 7.2.4. Energy Storage Systems
- 7.2.5. Other Applications
- 7.1. Market Analysis, Insights and Forecast - by Solvent Type
- 8. North America Lithium-Ion Battery Electrolyte Solvent Industry Analysis, Insights and Forecast, 2020-2032
- 8.1. Market Analysis, Insights and Forecast - by Solvent Type
- 8.1.1. Ethylene Carbonate (EC)
- 8.1.2. Diethyl Carbonate (DEC)
- 8.1.3. Dimethyl Carbonate (DMC)
- 8.1.4. Ethyl Methyl Carbonate (EMC)
- 8.1.5. Propylene Carbonate (PC)
- 8.1.6. Other Solvent Types
- 8.2. Market Analysis, Insights and Forecast - by Application
- 8.2.1. Power Backups/UPS
- 8.2.2. Mobile,
- 8.2.3. Electric Mobility/Vehicles
- 8.2.4. Energy Storage Systems
- 8.2.5. Other Applications
- 8.1. Market Analysis, Insights and Forecast - by Solvent Type
- 9. Europe Lithium-Ion Battery Electrolyte Solvent Industry Analysis, Insights and Forecast, 2020-2032
- 9.1. Market Analysis, Insights and Forecast - by Solvent Type
- 9.1.1. Ethylene Carbonate (EC)
- 9.1.2. Diethyl Carbonate (DEC)
- 9.1.3. Dimethyl Carbonate (DMC)
- 9.1.4. Ethyl Methyl Carbonate (EMC)
- 9.1.5. Propylene Carbonate (PC)
- 9.1.6. Other Solvent Types
- 9.2. Market Analysis, Insights and Forecast - by Application
- 9.2.1. Power Backups/UPS
- 9.2.2. Mobile,
- 9.2.3. Electric Mobility/Vehicles
- 9.2.4. Energy Storage Systems
- 9.2.5. Other Applications
- 9.1. Market Analysis, Insights and Forecast - by Solvent Type
- 10. South America Lithium-Ion Battery Electrolyte Solvent Industry Analysis, Insights and Forecast, 2020-2032
- 10.1. Market Analysis, Insights and Forecast - by Solvent Type
- 10.1.1. Ethylene Carbonate (EC)
- 10.1.2. Diethyl Carbonate (DEC)
- 10.1.3. Dimethyl Carbonate (DMC)
- 10.1.4. Ethyl Methyl Carbonate (EMC)
- 10.1.5. Propylene Carbonate (PC)
- 10.1.6. Other Solvent Types
- 10.2. Market Analysis, Insights and Forecast - by Application
- 10.2.1. Power Backups/UPS
- 10.2.2. Mobile,
- 10.2.3. Electric Mobility/Vehicles
- 10.2.4. Energy Storage Systems
- 10.2.5. Other Applications
- 10.1. Market Analysis, Insights and Forecast - by Solvent Type
- 11. Middle East and Africa Lithium-Ion Battery Electrolyte Solvent Industry Analysis, Insights and Forecast, 2020-2032
- 11.1. Market Analysis, Insights and Forecast - by Solvent Type
- 11.1.1. Ethylene Carbonate (EC)
- 11.1.2. Diethyl Carbonate (DEC)
- 11.1.3. Dimethyl Carbonate (DMC)
- 11.1.4. Ethyl Methyl Carbonate (EMC)
- 11.1.5. Propylene Carbonate (PC)
- 11.1.6. Other Solvent Types
- 11.2. Market Analysis, Insights and Forecast - by Application
- 11.2.1. Power Backups/UPS
- 11.2.2. Mobile,
- 11.2.3. Electric Mobility/Vehicles
- 11.2.4. Energy Storage Systems
- 11.2.5. Other Applications
- 11.1. Market Analysis, Insights and Forecast - by Solvent Type
- 12. Competitive Analysis
- 12.1. Company Profiles
- 12.1.1 Merck KGaA
- 12.1.1.1. Company Overview
- 12.1.1.2. Products
- 12.1.1.3. Company Financials
- 12.1.1.4. SWOT Analysis
- 12.1.2 UBE Corporation
- 12.1.2.1. Company Overview
- 12.1.2.2. Products
- 12.1.2.3. Company Financials
- 12.1.2.4. SWOT Analysis
- 12.1.3 Mitsubishi Chemical Corporation
- 12.1.3.1. Company Overview
- 12.1.3.2. Products
- 12.1.3.3. Company Financials
- 12.1.3.4. SWOT Analysis
- 12.1.4 Connect Chemicals
- 12.1.4.1. Company Overview
- 12.1.4.2. Products
- 12.1.4.3. Company Financials
- 12.1.4.4. SWOT Analysis
- 12.1.5 Kindun Chemical Co Limited
- 12.1.5.1. Company Overview
- 12.1.5.2. Products
- 12.1.5.3. Company Financials
- 12.1.5.4. SWOT Analysis
- 12.1.6 OUCC
- 12.1.6.1. Company Overview
- 12.1.6.2. Products
- 12.1.6.3. Company Financials
- 12.1.6.4. SWOT Analysis
- 12.1.7 Lotte Chemical
- 12.1.7.1. Company Overview
- 12.1.7.2. Products
- 12.1.7.3. Company Financials
- 12.1.7.4. SWOT Analysis
- 12.1.8 Dongwha Electrolyte
- 12.1.8.1. Company Overview
- 12.1.8.2. Products
- 12.1.8.3. Company Financials
- 12.1.8.4. SWOT Analysis
- 12.1.9 BASF SE
- 12.1.9.1. Company Overview
- 12.1.9.2. Products
- 12.1.9.3. Company Financials
- 12.1.9.4. SWOT Analysis
- 12.1.10 Huntsman International LLC
- 12.1.10.1. Company Overview
- 12.1.10.2. Products
- 12.1.10.3. Company Financials
- 12.1.10.4. SWOT Analysis
- 12.1.11 Sankyo Chemical Co Ltd
- 12.1.11.1. Company Overview
- 12.1.11.2. Products
- 12.1.11.3. Company Financials
- 12.1.11.4. SWOT Analysis
- 12.1.12 Zhengzhou Meiya Chemical Products Co Ltd
- 12.1.12.1. Company Overview
- 12.1.12.2. Products
- 12.1.12.3. Company Financials
- 12.1.12.4. SWOT Analysis
- 12.1.13 Shenzhen Capchem Technology Co Ltd (CAPCHEM)
- 12.1.13.1. Company Overview
- 12.1.13.2. Products
- 12.1.13.3. Company Financials
- 12.1.13.4. SWOT Analysis
- 12.1.14 Lixing Chemical
- 12.1.14.1. Company Overview
- 12.1.14.2. Products
- 12.1.14.3. Company Financials
- 12.1.14.4. SWOT Analysis
- 12.1.1 Merck KGaA
- 12.2. Market Entropy
- 12.2.1 Company's Key Areas Served
- 12.2.2 Recent Developments
- 12.3. Company Market Share Analysis 2025
- 12.3.1 Top 5 Companies Market Share Analysis
- 12.3.2 Top 3 Companies Market Share Analysis
- 12.4. List of Potential Customers
- 13. Research Methodology
List of Figures
- Figure 1: Global Lithium-Ion Battery Electrolyte Solvent Industry Revenue Breakdown (billion, %) by Region 2025 & 2033
- Figure 2: Global Lithium-Ion Battery Electrolyte Solvent Industry Volume Breakdown (liter, %) by Region 2025 & 2033
- Figure 3: Asia Pacific Lithium-Ion Battery Electrolyte Solvent Industry Revenue (billion), by Solvent Type 2025 & 2033
- Figure 4: Asia Pacific Lithium-Ion Battery Electrolyte Solvent Industry Volume (liter), by Solvent Type 2025 & 2033
- Figure 5: Asia Pacific Lithium-Ion Battery Electrolyte Solvent Industry Revenue Share (%), by Solvent Type 2025 & 2033
- Figure 6: Asia Pacific Lithium-Ion Battery Electrolyte Solvent Industry Volume Share (%), by Solvent Type 2025 & 2033
- Figure 7: Asia Pacific Lithium-Ion Battery Electrolyte Solvent Industry Revenue (billion), by Application 2025 & 2033
- Figure 8: Asia Pacific Lithium-Ion Battery Electrolyte Solvent Industry Volume (liter), by Application 2025 & 2033
- Figure 9: Asia Pacific Lithium-Ion Battery Electrolyte Solvent Industry Revenue Share (%), by Application 2025 & 2033
- Figure 10: Asia Pacific Lithium-Ion Battery Electrolyte Solvent Industry Volume Share (%), by Application 2025 & 2033
- Figure 11: Asia Pacific Lithium-Ion Battery Electrolyte Solvent Industry Revenue (billion), by Country 2025 & 2033
- Figure 12: Asia Pacific Lithium-Ion Battery Electrolyte Solvent Industry Volume (liter), by Country 2025 & 2033
- Figure 13: Asia Pacific Lithium-Ion Battery Electrolyte Solvent Industry Revenue Share (%), by Country 2025 & 2033
- Figure 14: Asia Pacific Lithium-Ion Battery Electrolyte Solvent Industry Volume Share (%), by Country 2025 & 2033
- Figure 15: North America Lithium-Ion Battery Electrolyte Solvent Industry Revenue (billion), by Solvent Type 2025 & 2033
- Figure 16: North America Lithium-Ion Battery Electrolyte Solvent Industry Volume (liter), by Solvent Type 2025 & 2033
- Figure 17: North America Lithium-Ion Battery Electrolyte Solvent Industry Revenue Share (%), by Solvent Type 2025 & 2033
- Figure 18: North America Lithium-Ion Battery Electrolyte Solvent Industry Volume Share (%), by Solvent Type 2025 & 2033
- Figure 19: North America Lithium-Ion Battery Electrolyte Solvent Industry Revenue (billion), by Application 2025 & 2033
- Figure 20: North America Lithium-Ion Battery Electrolyte Solvent Industry Volume (liter), by Application 2025 & 2033
- Figure 21: North America Lithium-Ion Battery Electrolyte Solvent Industry Revenue Share (%), by Application 2025 & 2033
- Figure 22: North America Lithium-Ion Battery Electrolyte Solvent Industry Volume Share (%), by Application 2025 & 2033
- Figure 23: North America Lithium-Ion Battery Electrolyte Solvent Industry Revenue (billion), by Country 2025 & 2033
- Figure 24: North America Lithium-Ion Battery Electrolyte Solvent Industry Volume (liter), by Country 2025 & 2033
- Figure 25: North America Lithium-Ion Battery Electrolyte Solvent Industry Revenue Share (%), by Country 2025 & 2033
- Figure 26: North America Lithium-Ion Battery Electrolyte Solvent Industry Volume Share (%), by Country 2025 & 2033
- Figure 27: Europe Lithium-Ion Battery Electrolyte Solvent Industry Revenue (billion), by Solvent Type 2025 & 2033
- Figure 28: Europe Lithium-Ion Battery Electrolyte Solvent Industry Volume (liter), by Solvent Type 2025 & 2033
- Figure 29: Europe Lithium-Ion Battery Electrolyte Solvent Industry Revenue Share (%), by Solvent Type 2025 & 2033
- Figure 30: Europe Lithium-Ion Battery Electrolyte Solvent Industry Volume Share (%), by Solvent Type 2025 & 2033
- Figure 31: Europe Lithium-Ion Battery Electrolyte Solvent Industry Revenue (billion), by Application 2025 & 2033
- Figure 32: Europe Lithium-Ion Battery Electrolyte Solvent Industry Volume (liter), by Application 2025 & 2033
- Figure 33: Europe Lithium-Ion Battery Electrolyte Solvent Industry Revenue Share (%), by Application 2025 & 2033
- Figure 34: Europe Lithium-Ion Battery Electrolyte Solvent Industry Volume Share (%), by Application 2025 & 2033
- Figure 35: Europe Lithium-Ion Battery Electrolyte Solvent Industry Revenue (billion), by Country 2025 & 2033
- Figure 36: Europe Lithium-Ion Battery Electrolyte Solvent Industry Volume (liter), by Country 2025 & 2033
- Figure 37: Europe Lithium-Ion Battery Electrolyte Solvent Industry Revenue Share (%), by Country 2025 & 2033
- Figure 38: Europe Lithium-Ion Battery Electrolyte Solvent Industry Volume Share (%), by Country 2025 & 2033
- Figure 39: South America Lithium-Ion Battery Electrolyte Solvent Industry Revenue (billion), by Solvent Type 2025 & 2033
- Figure 40: South America Lithium-Ion Battery Electrolyte Solvent Industry Volume (liter), by Solvent Type 2025 & 2033
- Figure 41: South America Lithium-Ion Battery Electrolyte Solvent Industry Revenue Share (%), by Solvent Type 2025 & 2033
- Figure 42: South America Lithium-Ion Battery Electrolyte Solvent Industry Volume Share (%), by Solvent Type 2025 & 2033
- Figure 43: South America Lithium-Ion Battery Electrolyte Solvent Industry Revenue (billion), by Application 2025 & 2033
- Figure 44: South America Lithium-Ion Battery Electrolyte Solvent Industry Volume (liter), by Application 2025 & 2033
- Figure 45: South America Lithium-Ion Battery Electrolyte Solvent Industry Revenue Share (%), by Application 2025 & 2033
- Figure 46: South America Lithium-Ion Battery Electrolyte Solvent Industry Volume Share (%), by Application 2025 & 2033
- Figure 47: South America Lithium-Ion Battery Electrolyte Solvent Industry Revenue (billion), by Country 2025 & 2033
- Figure 48: South America Lithium-Ion Battery Electrolyte Solvent Industry Volume (liter), by Country 2025 & 2033
- Figure 49: South America Lithium-Ion Battery Electrolyte Solvent Industry Revenue Share (%), by Country 2025 & 2033
- Figure 50: South America Lithium-Ion Battery Electrolyte Solvent Industry Volume Share (%), by Country 2025 & 2033
- Figure 51: Middle East and Africa Lithium-Ion Battery Electrolyte Solvent Industry Revenue (billion), by Solvent Type 2025 & 2033
- Figure 52: Middle East and Africa Lithium-Ion Battery Electrolyte Solvent Industry Volume (liter), by Solvent Type 2025 & 2033
- Figure 53: Middle East and Africa Lithium-Ion Battery Electrolyte Solvent Industry Revenue Share (%), by Solvent Type 2025 & 2033
- Figure 54: Middle East and Africa Lithium-Ion Battery Electrolyte Solvent Industry Volume Share (%), by Solvent Type 2025 & 2033
- Figure 55: Middle East and Africa Lithium-Ion Battery Electrolyte Solvent Industry Revenue (billion), by Application 2025 & 2033
- Figure 56: Middle East and Africa Lithium-Ion Battery Electrolyte Solvent Industry Volume (liter), by Application 2025 & 2033
- Figure 57: Middle East and Africa Lithium-Ion Battery Electrolyte Solvent Industry Revenue Share (%), by Application 2025 & 2033
- Figure 58: Middle East and Africa Lithium-Ion Battery Electrolyte Solvent Industry Volume Share (%), by Application 2025 & 2033
- Figure 59: Middle East and Africa Lithium-Ion Battery Electrolyte Solvent Industry Revenue (billion), by Country 2025 & 2033
- Figure 60: Middle East and Africa Lithium-Ion Battery Electrolyte Solvent Industry Volume (liter), by Country 2025 & 2033
- Figure 61: Middle East and Africa Lithium-Ion Battery Electrolyte Solvent Industry Revenue Share (%), by Country 2025 & 2033
- Figure 62: Middle East and Africa Lithium-Ion Battery Electrolyte Solvent Industry Volume Share (%), by Country 2025 & 2033
List of Tables
- Table 1: Global Lithium-Ion Battery Electrolyte Solvent Industry Revenue billion Forecast, by Solvent Type 2020 & 2033
- Table 2: Global Lithium-Ion Battery Electrolyte Solvent Industry Volume liter Forecast, by Solvent Type 2020 & 2033
- Table 3: Global Lithium-Ion Battery Electrolyte Solvent Industry Revenue billion Forecast, by Application 2020 & 2033
- Table 4: Global Lithium-Ion Battery Electrolyte Solvent Industry Volume liter Forecast, by Application 2020 & 2033
- Table 5: Global Lithium-Ion Battery Electrolyte Solvent Industry Revenue billion Forecast, by Region 2020 & 2033
- Table 6: Global Lithium-Ion Battery Electrolyte Solvent Industry Volume liter Forecast, by Region 2020 & 2033
- Table 7: Global Lithium-Ion Battery Electrolyte Solvent Industry Revenue billion Forecast, by Solvent Type 2020 & 2033
- Table 8: Global Lithium-Ion Battery Electrolyte Solvent Industry Volume liter Forecast, by Solvent Type 2020 & 2033
- Table 9: Global Lithium-Ion Battery Electrolyte Solvent Industry Revenue billion Forecast, by Application 2020 & 2033
- Table 10: Global Lithium-Ion Battery Electrolyte Solvent Industry Volume liter Forecast, by Application 2020 & 2033
- Table 11: Global Lithium-Ion Battery Electrolyte Solvent Industry Revenue billion Forecast, by Country 2020 & 2033
- Table 12: Global Lithium-Ion Battery Electrolyte Solvent Industry Volume liter Forecast, by Country 2020 & 2033
- Table 13: China Lithium-Ion Battery Electrolyte Solvent Industry Revenue (billion) Forecast, by Application 2020 & 2033
- Table 14: China Lithium-Ion Battery Electrolyte Solvent Industry Volume (liter) Forecast, by Application 2020 & 2033
- Table 15: India Lithium-Ion Battery Electrolyte Solvent Industry Revenue (billion) Forecast, by Application 2020 & 2033
- Table 16: India Lithium-Ion Battery Electrolyte Solvent Industry Volume (liter) Forecast, by Application 2020 & 2033
- Table 17: Japan Lithium-Ion Battery Electrolyte Solvent Industry Revenue (billion) Forecast, by Application 2020 & 2033
- Table 18: Japan Lithium-Ion Battery Electrolyte Solvent Industry Volume (liter) Forecast, by Application 2020 & 2033
- Table 19: South Korea Lithium-Ion Battery Electrolyte Solvent Industry Revenue (billion) Forecast, by Application 2020 & 2033
- Table 20: South Korea Lithium-Ion Battery Electrolyte Solvent Industry Volume (liter) Forecast, by Application 2020 & 2033
- Table 21: ASEAN Countries Lithium-Ion Battery Electrolyte Solvent Industry Revenue (billion) Forecast, by Application 2020 & 2033
- Table 22: ASEAN Countries Lithium-Ion Battery Electrolyte Solvent Industry Volume (liter) Forecast, by Application 2020 & 2033
- Table 23: Rest of Asia Pacific Lithium-Ion Battery Electrolyte Solvent Industry Revenue (billion) Forecast, by Application 2020 & 2033
- Table 24: Rest of Asia Pacific Lithium-Ion Battery Electrolyte Solvent Industry Volume (liter) Forecast, by Application 2020 & 2033
- Table 25: Global Lithium-Ion Battery Electrolyte Solvent Industry Revenue billion Forecast, by Solvent Type 2020 & 2033
- Table 26: Global Lithium-Ion Battery Electrolyte Solvent Industry Volume liter Forecast, by Solvent Type 2020 & 2033
- Table 27: Global Lithium-Ion Battery Electrolyte Solvent Industry Revenue billion Forecast, by Application 2020 & 2033
- Table 28: Global Lithium-Ion Battery Electrolyte Solvent Industry Volume liter Forecast, by Application 2020 & 2033
- Table 29: Global Lithium-Ion Battery Electrolyte Solvent Industry Revenue billion Forecast, by Country 2020 & 2033
- Table 30: Global Lithium-Ion Battery Electrolyte Solvent Industry Volume liter Forecast, by Country 2020 & 2033
- Table 31: United States Lithium-Ion Battery Electrolyte Solvent Industry Revenue (billion) Forecast, by Application 2020 & 2033
- Table 32: United States Lithium-Ion Battery Electrolyte Solvent Industry Volume (liter) Forecast, by Application 2020 & 2033
- Table 33: Canada Lithium-Ion Battery Electrolyte Solvent Industry Revenue (billion) Forecast, by Application 2020 & 2033
- Table 34: Canada Lithium-Ion Battery Electrolyte Solvent Industry Volume (liter) Forecast, by Application 2020 & 2033
- Table 35: Mexico Lithium-Ion Battery Electrolyte Solvent Industry Revenue (billion) Forecast, by Application 2020 & 2033
- Table 36: Mexico Lithium-Ion Battery Electrolyte Solvent Industry Volume (liter) Forecast, by Application 2020 & 2033
- Table 37: Global Lithium-Ion Battery Electrolyte Solvent Industry Revenue billion Forecast, by Solvent Type 2020 & 2033
- Table 38: Global Lithium-Ion Battery Electrolyte Solvent Industry Volume liter Forecast, by Solvent Type 2020 & 2033
- Table 39: Global Lithium-Ion Battery Electrolyte Solvent Industry Revenue billion Forecast, by Application 2020 & 2033
- Table 40: Global Lithium-Ion Battery Electrolyte Solvent Industry Volume liter Forecast, by Application 2020 & 2033
- Table 41: Global Lithium-Ion Battery Electrolyte Solvent Industry Revenue billion Forecast, by Country 2020 & 2033
- Table 42: Global Lithium-Ion Battery Electrolyte Solvent Industry Volume liter Forecast, by Country 2020 & 2033
- Table 43: Germany Lithium-Ion Battery Electrolyte Solvent Industry Revenue (billion) Forecast, by Application 2020 & 2033
- Table 44: Germany Lithium-Ion Battery Electrolyte Solvent Industry Volume (liter) Forecast, by Application 2020 & 2033
- Table 45: France Lithium-Ion Battery Electrolyte Solvent Industry Revenue (billion) Forecast, by Application 2020 & 2033
- Table 46: France Lithium-Ion Battery Electrolyte Solvent Industry Volume (liter) Forecast, by Application 2020 & 2033
- Table 47: United Kingdom Lithium-Ion Battery Electrolyte Solvent Industry Revenue (billion) Forecast, by Application 2020 & 2033
- Table 48: United Kingdom Lithium-Ion Battery Electrolyte Solvent Industry Volume (liter) Forecast, by Application 2020 & 2033
- Table 49: Italy Lithium-Ion Battery Electrolyte Solvent Industry Revenue (billion) Forecast, by Application 2020 & 2033
- Table 50: Italy Lithium-Ion Battery Electrolyte Solvent Industry Volume (liter) Forecast, by Application 2020 & 2033
- Table 51: Rest of Europe Lithium-Ion Battery Electrolyte Solvent Industry Revenue (billion) Forecast, by Application 2020 & 2033
- Table 52: Rest of Europe Lithium-Ion Battery Electrolyte Solvent Industry Volume (liter) Forecast, by Application 2020 & 2033
- Table 53: Global Lithium-Ion Battery Electrolyte Solvent Industry Revenue billion Forecast, by Solvent Type 2020 & 2033
- Table 54: Global Lithium-Ion Battery Electrolyte Solvent Industry Volume liter Forecast, by Solvent Type 2020 & 2033
- Table 55: Global Lithium-Ion Battery Electrolyte Solvent Industry Revenue billion Forecast, by Application 2020 & 2033
- Table 56: Global Lithium-Ion Battery Electrolyte Solvent Industry Volume liter Forecast, by Application 2020 & 2033
- Table 57: Global Lithium-Ion Battery Electrolyte Solvent Industry Revenue billion Forecast, by Country 2020 & 2033
- Table 58: Global Lithium-Ion Battery Electrolyte Solvent Industry Volume liter Forecast, by Country 2020 & 2033
- Table 59: Brazil Lithium-Ion Battery Electrolyte Solvent Industry Revenue (billion) Forecast, by Application 2020 & 2033
- Table 60: Brazil Lithium-Ion Battery Electrolyte Solvent Industry Volume (liter) Forecast, by Application 2020 & 2033
- Table 61: Argentina Lithium-Ion Battery Electrolyte Solvent Industry Revenue (billion) Forecast, by Application 2020 & 2033
- Table 62: Argentina Lithium-Ion Battery Electrolyte Solvent Industry Volume (liter) Forecast, by Application 2020 & 2033
- Table 63: Rest of South America Lithium-Ion Battery Electrolyte Solvent Industry Revenue (billion) Forecast, by Application 2020 & 2033
- Table 64: Rest of South America Lithium-Ion Battery Electrolyte Solvent Industry Volume (liter) Forecast, by Application 2020 & 2033
- Table 65: Global Lithium-Ion Battery Electrolyte Solvent Industry Revenue billion Forecast, by Solvent Type 2020 & 2033
- Table 66: Global Lithium-Ion Battery Electrolyte Solvent Industry Volume liter Forecast, by Solvent Type 2020 & 2033
- Table 67: Global Lithium-Ion Battery Electrolyte Solvent Industry Revenue billion Forecast, by Application 2020 & 2033
- Table 68: Global Lithium-Ion Battery Electrolyte Solvent Industry Volume liter Forecast, by Application 2020 & 2033
- Table 69: Global Lithium-Ion Battery Electrolyte Solvent Industry Revenue billion Forecast, by Country 2020 & 2033
- Table 70: Global Lithium-Ion Battery Electrolyte Solvent Industry Volume liter Forecast, by Country 2020 & 2033
- Table 71: Saudi Arabia Lithium-Ion Battery Electrolyte Solvent Industry Revenue (billion) Forecast, by Application 2020 & 2033
- Table 72: Saudi Arabia Lithium-Ion Battery Electrolyte Solvent Industry Volume (liter) Forecast, by Application 2020 & 2033
- Table 73: South Africa Lithium-Ion Battery Electrolyte Solvent Industry Revenue (billion) Forecast, by Application 2020 & 2033
- Table 74: South Africa Lithium-Ion Battery Electrolyte Solvent Industry Volume (liter) Forecast, by Application 2020 & 2033
- Table 75: Rest of Middle East and Africa Lithium-Ion Battery Electrolyte Solvent Industry Revenue (billion) Forecast, by Application 2020 & 2033
- Table 76: Rest of Middle East and Africa Lithium-Ion Battery Electrolyte Solvent Industry Volume (liter) Forecast, by Application 2020 & 2033
Frequently Asked Questions
1. What is the projected Compound Annual Growth Rate (CAGR) of the Lithium-Ion Battery Electrolyte Solvent Industry?
The projected CAGR is approximately 12.83%.
2. Which companies are prominent players in the Lithium-Ion Battery Electrolyte Solvent Industry?
Key companies in the market include Merck KGaA, UBE Corporation, Mitsubishi Chemical Corporation, Connect Chemicals, Kindun Chemical Co Limited, OUCC, Lotte Chemical, Dongwha Electrolyte, BASF SE, Huntsman International LLC, Sankyo Chemical Co Ltd, Zhengzhou Meiya Chemical Products Co Ltd, Shenzhen Capchem Technology Co Ltd (CAPCHEM), Lixing Chemical.
3. What are the main segments of the Lithium-Ion Battery Electrolyte Solvent Industry?
The market segments include Solvent Type, Application.
4. Can you provide details about the market size?
The market size is estimated to be USD 8.369 billion as of 2022.
5. What are some drivers contributing to market growth?
Increasing Demand from Electric Vehicle Manufacturers; Growing Demand from Smartphone Manufacturers.
6. What are the notable trends driving market growth?
Increasing demand from Electric Mobility/Vehicles Applications.
7. Are there any restraints impacting market growth?
Potential Hazards Caused by Using Impure Electrolyte Solvents; Other Restraints.
8. Can you provide examples of recent developments in the market?
In July 2022, UBE Corporation started the study for the feasibility of a construction site to produce Dimethyl Carbonate (DMC) and Ethyl Methyl Carbonate (EMC) in Louisiana, United States which are the principal component of the solvent for electrolytes in lithium-ion batteries. The company planned a production plant with a planned production capacity of 100,000 metric tons per year of DMC and 40,000 metric tons per year of EMC for which the company is planning a final investment decision by the first half of fiscal 2023, and operations to commence in the second half of fiscal 2025.
9. What pricing options are available for accessing the report?
Pricing options include single-user, multi-user, and enterprise licenses priced at USD 4750, USD 5250, and USD 8750 respectively.
10. Is the market size provided in terms of value or volume?
The market size is provided in terms of value, measured in billion and volume, measured in liter.
11. Are there any specific market keywords associated with the report?
Yes, the market keyword associated with the report is "Lithium-Ion Battery Electrolyte Solvent Industry," which aids in identifying and referencing the specific market segment covered.
12. How do I determine which pricing option suits my needs best?
The pricing options vary based on user requirements and access needs. Individual users may opt for single-user licenses, while businesses requiring broader access may choose multi-user or enterprise licenses for cost-effective access to the report.
13. Are there any additional resources or data provided in the Lithium-Ion Battery Electrolyte Solvent Industry report?
While the report offers comprehensive insights, it's advisable to review the specific contents or supplementary materials provided to ascertain if additional resources or data are available.
14. How can I stay updated on further developments or reports in the Lithium-Ion Battery Electrolyte Solvent Industry?
To stay informed about further developments, trends, and reports in the Lithium-Ion Battery Electrolyte Solvent Industry, consider subscribing to industry newsletters, following relevant companies and organizations, or regularly checking reputable industry news sources and publications.
Methodology
Step 1 - Identification of Relevant Samples Size from Population Database


Step 2 - Approaches for Defining Global Market Size (Value, Volume* & Price*)

Note*: In applicable scenarios
Step 3 - Data Sources
Primary Research
- Web Analytics
- Survey Reports
- Research Institute
- Latest Research Reports
- Opinion Leaders
Secondary Research
- Annual Reports
- White Paper
- Latest Press Release
- Industry Association
- Paid Database
- Investor Presentations

Step 4 - Data Triangulation
Involves using different sources of information in order to increase the validity of a study
These sources are likely to be stakeholders in a program - participants, other researchers, program staff, other community members, and so on.
Then we put all data in single framework & apply various statistical tools to find out the dynamic on the market.
During the analysis stage, feedback from the stakeholder groups would be compared to determine areas of agreement as well as areas of divergence