

Key Insights
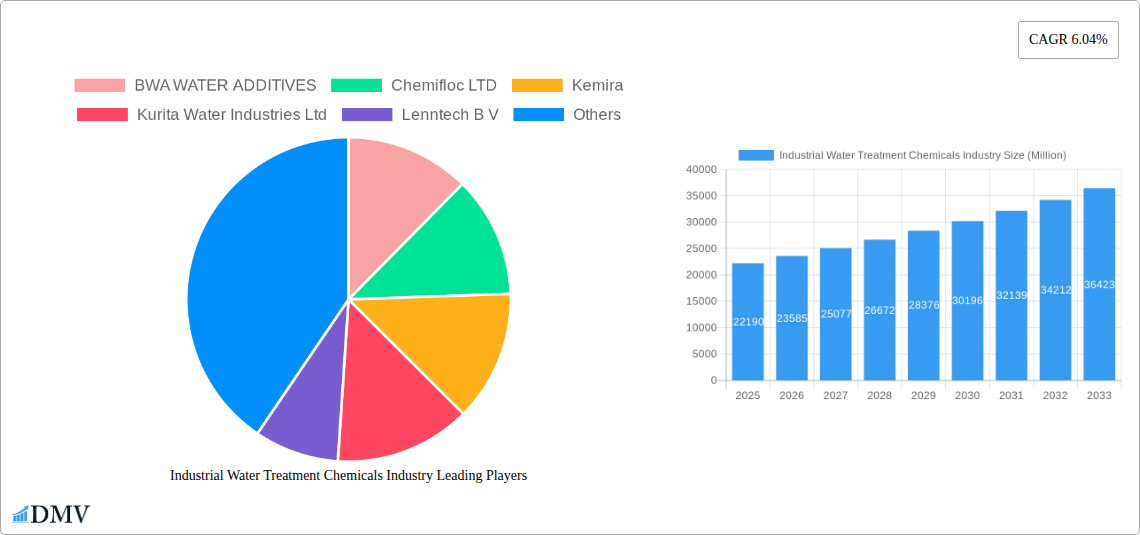
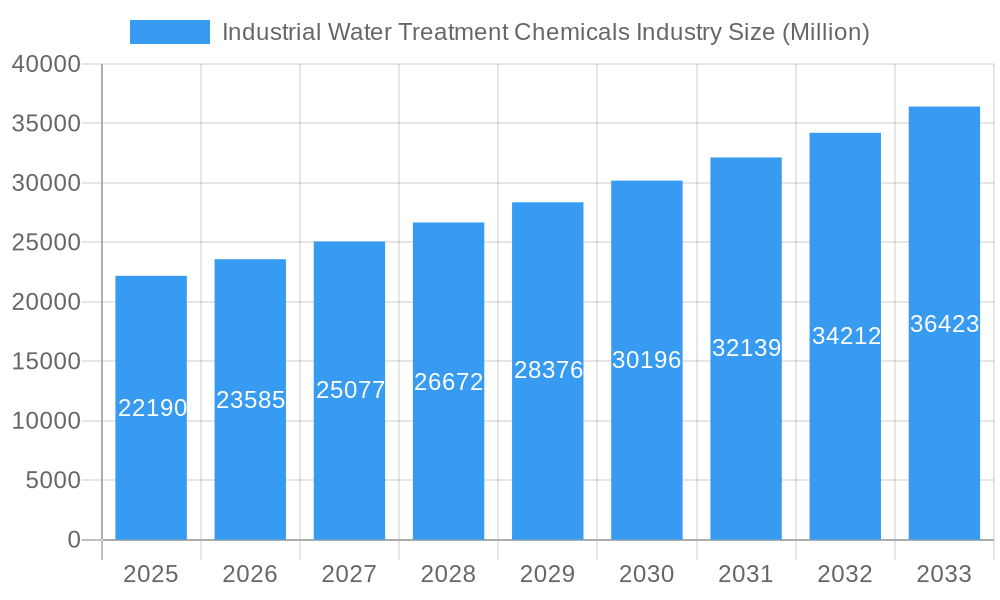
The global industrial water treatment chemicals market, valued at $22.19 billion in 2025, is projected to experience robust growth, exhibiting a Compound Annual Growth Rate (CAGR) of 6.04% from 2025 to 2033. This expansion is fueled by several key drivers. Stringent environmental regulations globally are mandating stricter water quality standards across various industries, prompting increased adoption of advanced water treatment technologies and chemicals. Furthermore, the rising demand for industrial water from sectors like manufacturing, energy, and food & beverage is significantly contributing to market growth. Technological advancements, such as the development of more efficient and eco-friendly water treatment chemicals, are also accelerating market expansion. Increased focus on water reuse and recycling initiatives, driven by water scarcity concerns in several regions, further boosts demand. Major players like BWA Water Additives, Chemifloc Ltd, Kemira, Kurita Water Industries Ltd, Lenntech B.V., Lonza, DuPont de Nemours Inc, Ecolab, SNF, Solenis, and SUEZ are actively shaping the market landscape through innovation and strategic acquisitions.
Industrial Water Treatment Chemicals Industry Market Size (In Billion)
However, the market faces certain restraints. Fluctuating raw material prices, especially for key chemical components, can impact production costs and profitability. The intense competition among established players and the emergence of new entrants can also lead to price pressure. Additionally, concerns regarding the environmental impact of certain chemicals used in water treatment are driving the need for sustainable alternatives, presenting both a challenge and an opportunity for innovation. Despite these challenges, the long-term outlook remains positive, driven by the growing need for efficient and sustainable water management solutions across various industrial sectors. The market is expected to witness further segmentation based on specific chemical types, application areas, and geographical regions, providing diverse opportunities for market players.
Industrial Water Treatment Chemicals Industry Company Market Share
Industrial Water Treatment Chemicals Market Report: 2019-2033
This comprehensive report provides an in-depth analysis of the Industrial Water Treatment Chemicals market, offering crucial insights for stakeholders seeking to navigate this dynamic landscape. With a study period spanning 2019-2033, a base year of 2025, and a forecast period of 2025-2033, this report leverages historical data (2019-2024) to project future market trends and opportunities. The market is valued at xx Million in 2025 and is expected to reach xx Million by 2033, exhibiting a CAGR of xx%.
Industrial Water Treatment Chemicals Industry Market Composition & Trends
This section dissects the intricate composition of the industrial water treatment chemicals market, examining market concentration, innovation drivers, regulatory frameworks, substitute products, end-user profiles, and the prevalent M&A activity. The market exhibits a moderately concentrated structure, with key players like Ecolab, SNF, and Kemira holding significant market share (xx%, xx%, and xx%, respectively, in 2025). However, a vibrant ecosystem of smaller, specialized players contributes significantly to innovation. Stringent environmental regulations across various geographies are crucial drivers, pushing innovation towards eco-friendly solutions. The substitution of traditional chemicals with more sustainable alternatives presents both challenges and opportunities. Major end-users include power generation, manufacturing, and oil & gas, with varying chemical requirements. The USD 4.6 Billion acquisition of Diversey by Solenis in March 2023, highlights the robust M&A activity, signifying market consolidation and expansion strategies. Other notable M&A deals in the recent past include the acquisition of Chem One by Shrieve Chemical Company in January 2023. The total value of M&A deals within the past 5 years exceeds xx Million.
- Market Concentration: Moderately concentrated, with top 3 players holding xx% market share (2025).
- Innovation Catalysts: Stringent environmental regulations, demand for sustainable solutions.
- Regulatory Landscape: Varied globally, impacting product formulation and approvals.
- Substitute Products: Increasing availability of bio-based and sustainable alternatives.
- End-User Profile: Power generation, manufacturing, oil & gas, and municipal sectors.
- M&A Activity: Significant consolidation, driven by expansion and technological acquisition.
Industrial Water Treatment Chemicals Industry Industry Evolution
The industrial water treatment chemicals market has witnessed consistent growth throughout the historical period (2019-2024), driven by rising industrialization, increasing water scarcity, and stringent environmental regulations. Technological advancements, such as the development of advanced oxidation processes (AOPs) and membrane filtration technologies, have revolutionized water treatment efficiency. These innovations have reduced treatment costs and improved water quality, bolstering market expansion. Consumer demand for sustainable and environmentally responsible water treatment solutions is also escalating, pushing manufacturers to develop eco-friendly alternatives to traditional chemicals. The market experienced a growth rate of xx% from 2019 to 2024, with an estimated xx% growth projected for 2025. Adoption rates of advanced treatment technologies are on the rise, with a xx% increase in usage since 2019. The shift towards sustainable solutions is further evident in the growing adoption of bio-based coagulants and flocculants.
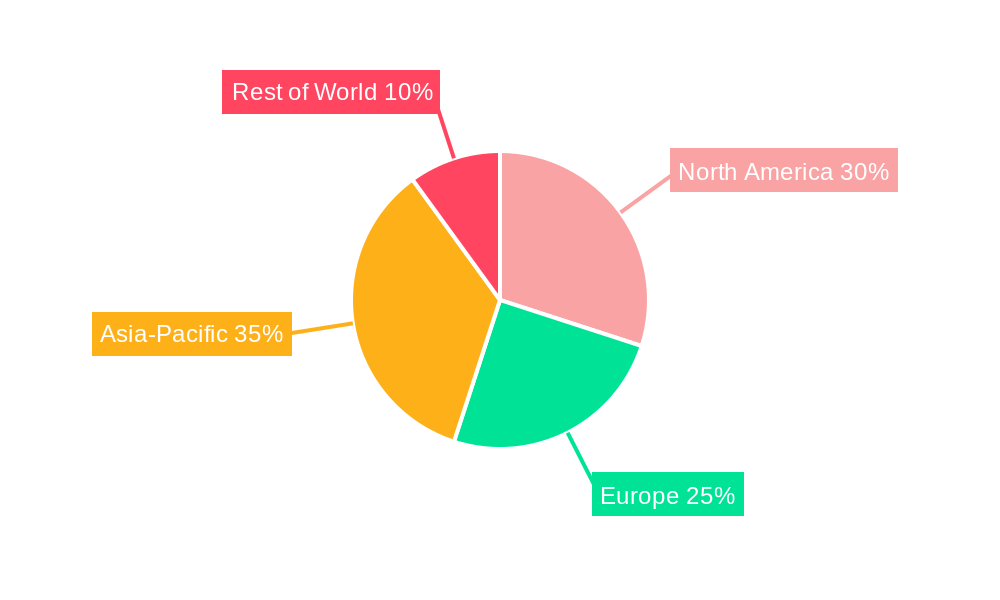
Leading Regions, Countries, or Segments in Industrial Water Treatment Chemicals Industry
North America currently dominates the industrial water treatment chemicals market, driven by robust industrial activity and stringent environmental regulations. Asia-Pacific shows substantial growth potential due to rapid industrialization and urbanization. Within North America, the United States holds the largest market share.
- Key Drivers for North America's Dominance:
- High industrial activity and stringent environmental regulations.
- Significant investments in water infrastructure projects.
- Early adoption of advanced water treatment technologies.
- Growth Potential in Asia-Pacific:
- Rapid industrialization and increasing urbanization.
- Growing demand for water treatment solutions in emerging economies.
- Government initiatives promoting water conservation and pollution control.
The power generation segment currently holds the largest market share due to the critical need for high-quality water in power plants. However, the manufacturing sector is projected to witness significant growth driven by increasing industrial production and the need for efficient water management.
Industrial Water Treatment Chemicals Industry Product Innovations
Recent product innovations focus on improving treatment efficiency, reducing environmental impact, and enhancing cost-effectiveness. This includes the development of advanced oxidation processes (AOPs) for the removal of recalcitrant pollutants, novel bio-based coagulants and flocculants that offer improved performance with reduced environmental footprint, and intelligent chemical dosing systems that optimize chemical usage and minimize waste. These innovations showcase a strong emphasis on sustainability and cost optimization within the industry.
Propelling Factors for Industrial Water Treatment Chemicals Industry Growth
Several factors propel the growth of the industrial water treatment chemicals market. Stringent environmental regulations mandate cleaner water discharge, driving demand for advanced treatment chemicals. The increasing scarcity of freshwater resources necessitates efficient water reuse and recycling, further boosting market expansion. Technological advancements, like AOPs and membrane filtration, offer improved treatment efficiency and cost savings, making them attractive investments for various sectors. The rising awareness of the risks associated with waterborne diseases also contributes significantly to growth, driving adoption in municipal water treatment.
Obstacles in the Industrial Water Treatment Chemicals Industry Market
The market faces challenges from fluctuating raw material prices, impacting production costs and profit margins. Supply chain disruptions can lead to delays in production and delivery. Intense competition from established and emerging players requires constant innovation and differentiation. Stricter environmental regulations may require substantial investments in research and development to meet compliance standards. These factors contribute to pricing pressures and market uncertainties.
Future Opportunities in Industrial Water Treatment Chemicals Industry
Emerging markets in developing economies present significant opportunities. Technological innovations, such as AI-driven process optimization and nanotechnology applications in water treatment, hold immense potential. The growing focus on sustainable and circular economy principles opens avenues for eco-friendly chemical formulations and water reuse technologies. These opportunities promise substantial growth for the market in the coming years.
Major Players in the Industrial Water Treatment Chemicals Industry Ecosystem
- BWA WATER ADDITIVES
- Chemifloc LTD
- Kemira
- Kurita Water Industries Ltd
- Lenntech B V
- Lonza
- DuPont de Nemours Inc
- Ecolab
- SNF
- Solenis
- SUEZ
Key Developments in Industrial Water Treatment Chemicals Industry Industry
- March 2023: Solenis acquired Diversey for USD 4.6 Billion, significantly expanding its market share and product portfolio in industrial water treatment.
- January 2023: Shrieve Chemical Company acquired Chem One, broadening its reach in the industrial chemicals distribution market, including water treatment chemicals.
Strategic Industrial Water Treatment Chemicals Industry Market Forecast
The industrial water treatment chemicals market is poised for robust growth, driven by factors like increasing industrialization, stricter environmental regulations, and technological advancements. The market's future prospects are bright, with opportunities stemming from sustainable solutions, innovative technologies, and expanding market penetration in emerging economies. The consistent demand for efficient and environmentally friendly water treatment solutions ensures sustained market expansion over the forecast period (2025-2033).
Industrial Water Treatment Chemicals Industry Segmentation
-
1. Product Type
- 1.1. Antifoams
- 1.2. Oxygen Scavengers
- 1.3. Corrosion Inhibitors
- 1.4. Biocides and Disinfactants
- 1.5. Oxidants
- 1.6. pH Conditioners
- 1.7. Sludge Conditioners
- 1.8. Scale inhibitors
- 1.9. Other Product Types
-
2. End-user Industry
- 2.1. Oil and Gas
- 2.2. Power
- 2.3. Paper
- 2.4. Metal and mining
- 2.5. Chemical
- 2.6. Other End-user Industries
Industrial Water Treatment Chemicals Industry Segmentation By Geography
-
1. North America
- 1.1. United States
- 1.2. Mexico
- 1.3. Canada
-
2. Europe
- 2.1. Germany
- 2.2. United Kingdom
- 2.3. France
- 2.4. Italy
- 2.5. Rest of Europe
-
3. Asia Pacific
- 3.1. China
- 3.2. India
- 3.3. Japan
- 3.4. South Korea
- 3.5. Rest of Asia Pacific
-
4. South America
- 4.1. Brazil
- 4.2. Argentina
- 4.3. Rest of South America
-
5. Middle East and Africa
- 5.1. Saudi Arabia
- 5.2. South Africa
- 5.3. United Arab Emirates
- 5.4. Rest of Middle East and Africa
Industrial Water Treatment Chemicals Industry Regional Market Share
Geographic Coverage of Industrial Water Treatment Chemicals Industry
Industrial Water Treatment Chemicals Industry REPORT HIGHLIGHTS
| Aspects | Details |
|---|---|
| Study Period | 2020-2034 |
| Base Year | 2025 |
| Estimated Year | 2026 |
| Forecast Period | 2026-2034 |
| Historical Period | 2020-2025 |
| Growth Rate | CAGR of 6.04% from 2020-2034 |
| Segmentation |
|
Table of Contents
- 1. Introduction
- 1.1. Research Scope
- 1.2. Market Segmentation
- 1.3. Research Objective
- 1.4. Definitions and Assumptions
- 2. Executive Summary
- 2.1. Market Snapshot
- 3. Market Dynamics
- 3.1. Market Drivers
- 3.2. Market Restrains
- 3.3. Market Trends
- 3.4. Market Opportunities
- 4. Market Factor Analysis
- 4.1. Porters Five Forces
- 4.1.1. Bargaining Power of Suppliers
- 4.1.2. Bargaining Power of Buyers
- 4.1.3. Threat of New Entrants
- 4.1.4. Threat of Substitutes
- 4.1.5. Competitive Rivalry
- 4.2. PESTEL analysis
- 4.3. BCG Analysis
- 4.3.1. Stars (High Growth, High Market Share)
- 4.3.2. Cash Cows (Low Growth, High Market Share)
- 4.3.3. Question Mark (High Growth, Low Market Share)
- 4.3.4. Dogs (Low Growth, Low Market Share)
- 4.4. Ansoff Matrix Analysis
- 4.5. Supply Chain Analysis
- 4.6. Regulatory Landscape
- 4.7. Current Market Potential and Opportunity Assessment (TAM–SAM–SOM Framework)
- 4.8. DMV Analyst Note
- 4.1. Porters Five Forces
- 5. Market Analysis, Insights and Forecast 2021-2033
- 5.1. Market Analysis, Insights and Forecast - by Product Type
- 5.1.1. Antifoams
- 5.1.2. Oxygen Scavengers
- 5.1.3. Corrosion Inhibitors
- 5.1.4. Biocides and Disinfactants
- 5.1.5. Oxidants
- 5.1.6. pH Conditioners
- 5.1.7. Sludge Conditioners
- 5.1.8. Scale inhibitors
- 5.1.9. Other Product Types
- 5.2. Market Analysis, Insights and Forecast - by End-user Industry
- 5.2.1. Oil and Gas
- 5.2.2. Power
- 5.2.3. Paper
- 5.2.4. Metal and mining
- 5.2.5. Chemical
- 5.2.6. Other End-user Industries
- 5.3. Market Analysis, Insights and Forecast - by Region
- 5.3.1. North America
- 5.3.2. Europe
- 5.3.3. Asia Pacific
- 5.3.4. South America
- 5.3.5. Middle East and Africa
- 5.1. Market Analysis, Insights and Forecast - by Product Type
- 6. Global Industrial Water Treatment Chemicals Industry Analysis, Insights and Forecast, 2021-2033
- 6.1. Market Analysis, Insights and Forecast - by Product Type
- 6.1.1. Antifoams
- 6.1.2. Oxygen Scavengers
- 6.1.3. Corrosion Inhibitors
- 6.1.4. Biocides and Disinfactants
- 6.1.5. Oxidants
- 6.1.6. pH Conditioners
- 6.1.7. Sludge Conditioners
- 6.1.8. Scale inhibitors
- 6.1.9. Other Product Types
- 6.2. Market Analysis, Insights and Forecast - by End-user Industry
- 6.2.1. Oil and Gas
- 6.2.2. Power
- 6.2.3. Paper
- 6.2.4. Metal and mining
- 6.2.5. Chemical
- 6.2.6. Other End-user Industries
- 6.1. Market Analysis, Insights and Forecast - by Product Type
- 7. North America Industrial Water Treatment Chemicals Industry Analysis, Insights and Forecast, 2020-2032
- 7.1. Market Analysis, Insights and Forecast - by Product Type
- 7.1.1. Antifoams
- 7.1.2. Oxygen Scavengers
- 7.1.3. Corrosion Inhibitors
- 7.1.4. Biocides and Disinfactants
- 7.1.5. Oxidants
- 7.1.6. pH Conditioners
- 7.1.7. Sludge Conditioners
- 7.1.8. Scale inhibitors
- 7.1.9. Other Product Types
- 7.2. Market Analysis, Insights and Forecast - by End-user Industry
- 7.2.1. Oil and Gas
- 7.2.2. Power
- 7.2.3. Paper
- 7.2.4. Metal and mining
- 7.2.5. Chemical
- 7.2.6. Other End-user Industries
- 7.1. Market Analysis, Insights and Forecast - by Product Type
- 8. Europe Industrial Water Treatment Chemicals Industry Analysis, Insights and Forecast, 2020-2032
- 8.1. Market Analysis, Insights and Forecast - by Product Type
- 8.1.1. Antifoams
- 8.1.2. Oxygen Scavengers
- 8.1.3. Corrosion Inhibitors
- 8.1.4. Biocides and Disinfactants
- 8.1.5. Oxidants
- 8.1.6. pH Conditioners
- 8.1.7. Sludge Conditioners
- 8.1.8. Scale inhibitors
- 8.1.9. Other Product Types
- 8.2. Market Analysis, Insights and Forecast - by End-user Industry
- 8.2.1. Oil and Gas
- 8.2.2. Power
- 8.2.3. Paper
- 8.2.4. Metal and mining
- 8.2.5. Chemical
- 8.2.6. Other End-user Industries
- 8.1. Market Analysis, Insights and Forecast - by Product Type
- 9. Asia Pacific Industrial Water Treatment Chemicals Industry Analysis, Insights and Forecast, 2020-2032
- 9.1. Market Analysis, Insights and Forecast - by Product Type
- 9.1.1. Antifoams
- 9.1.2. Oxygen Scavengers
- 9.1.3. Corrosion Inhibitors
- 9.1.4. Biocides and Disinfactants
- 9.1.5. Oxidants
- 9.1.6. pH Conditioners
- 9.1.7. Sludge Conditioners
- 9.1.8. Scale inhibitors
- 9.1.9. Other Product Types
- 9.2. Market Analysis, Insights and Forecast - by End-user Industry
- 9.2.1. Oil and Gas
- 9.2.2. Power
- 9.2.3. Paper
- 9.2.4. Metal and mining
- 9.2.5. Chemical
- 9.2.6. Other End-user Industries
- 9.1. Market Analysis, Insights and Forecast - by Product Type
- 10. South America Industrial Water Treatment Chemicals Industry Analysis, Insights and Forecast, 2020-2032
- 10.1. Market Analysis, Insights and Forecast - by Product Type
- 10.1.1. Antifoams
- 10.1.2. Oxygen Scavengers
- 10.1.3. Corrosion Inhibitors
- 10.1.4. Biocides and Disinfactants
- 10.1.5. Oxidants
- 10.1.6. pH Conditioners
- 10.1.7. Sludge Conditioners
- 10.1.8. Scale inhibitors
- 10.1.9. Other Product Types
- 10.2. Market Analysis, Insights and Forecast - by End-user Industry
- 10.2.1. Oil and Gas
- 10.2.2. Power
- 10.2.3. Paper
- 10.2.4. Metal and mining
- 10.2.5. Chemical
- 10.2.6. Other End-user Industries
- 10.1. Market Analysis, Insights and Forecast - by Product Type
- 11. Middle East and Africa Industrial Water Treatment Chemicals Industry Analysis, Insights and Forecast, 2020-2032
- 11.1. Market Analysis, Insights and Forecast - by Product Type
- 11.1.1. Antifoams
- 11.1.2. Oxygen Scavengers
- 11.1.3. Corrosion Inhibitors
- 11.1.4. Biocides and Disinfactants
- 11.1.5. Oxidants
- 11.1.6. pH Conditioners
- 11.1.7. Sludge Conditioners
- 11.1.8. Scale inhibitors
- 11.1.9. Other Product Types
- 11.2. Market Analysis, Insights and Forecast - by End-user Industry
- 11.2.1. Oil and Gas
- 11.2.2. Power
- 11.2.3. Paper
- 11.2.4. Metal and mining
- 11.2.5. Chemical
- 11.2.6. Other End-user Industries
- 11.1. Market Analysis, Insights and Forecast - by Product Type
- 12. Competitive Analysis
- 12.1. Company Profiles
- 12.1.1 BWA WATER ADDITIVES
- 12.1.1.1. Company Overview
- 12.1.1.2. Products
- 12.1.1.3. Company Financials
- 12.1.1.4. SWOT Analysis
- 12.1.2 Chemifloc LTD
- 12.1.2.1. Company Overview
- 12.1.2.2. Products
- 12.1.2.3. Company Financials
- 12.1.2.4. SWOT Analysis
- 12.1.3 Kemira
- 12.1.3.1. Company Overview
- 12.1.3.2. Products
- 12.1.3.3. Company Financials
- 12.1.3.4. SWOT Analysis
- 12.1.4 Kurita Water Industries Ltd
- 12.1.4.1. Company Overview
- 12.1.4.2. Products
- 12.1.4.3. Company Financials
- 12.1.4.4. SWOT Analysis
- 12.1.5 Lenntech B V
- 12.1.5.1. Company Overview
- 12.1.5.2. Products
- 12.1.5.3. Company Financials
- 12.1.5.4. SWOT Analysis
- 12.1.6 Lonza
- 12.1.6.1. Company Overview
- 12.1.6.2. Products
- 12.1.6.3. Company Financials
- 12.1.6.4. SWOT Analysis
- 12.1.7 DuPont de Nemours Inc
- 12.1.7.1. Company Overview
- 12.1.7.2. Products
- 12.1.7.3. Company Financials
- 12.1.7.4. SWOT Analysis
- 12.1.8 Ecolab
- 12.1.8.1. Company Overview
- 12.1.8.2. Products
- 12.1.8.3. Company Financials
- 12.1.8.4. SWOT Analysis
- 12.1.9 SNF
- 12.1.9.1. Company Overview
- 12.1.9.2. Products
- 12.1.9.3. Company Financials
- 12.1.9.4. SWOT Analysis
- 12.1.10 Solenis
- 12.1.10.1. Company Overview
- 12.1.10.2. Products
- 12.1.10.3. Company Financials
- 12.1.10.4. SWOT Analysis
- 12.1.11 SUEZ*List Not Exhaustive
- 12.1.11.1. Company Overview
- 12.1.11.2. Products
- 12.1.11.3. Company Financials
- 12.1.11.4. SWOT Analysis
- 12.1.1 BWA WATER ADDITIVES
- 12.2. Market Entropy
- 12.2.1 Company's Key Areas Served
- 12.2.2 Recent Developments
- 12.3. Company Market Share Analysis 2025
- 12.3.1 Top 5 Companies Market Share Analysis
- 12.3.2 Top 3 Companies Market Share Analysis
- 12.4. List of Potential Customers
- 13. Research Methodology
List of Figures
- Figure 1: Global Industrial Water Treatment Chemicals Industry Revenue Breakdown (Million, %) by Region 2025 & 2033
- Figure 2: Global Industrial Water Treatment Chemicals Industry Volume Breakdown (Billion, %) by Region 2025 & 2033
- Figure 3: North America Industrial Water Treatment Chemicals Industry Revenue (Million), by Product Type 2025 & 2033
- Figure 4: North America Industrial Water Treatment Chemicals Industry Volume (Billion), by Product Type 2025 & 2033
- Figure 5: North America Industrial Water Treatment Chemicals Industry Revenue Share (%), by Product Type 2025 & 2033
- Figure 6: North America Industrial Water Treatment Chemicals Industry Volume Share (%), by Product Type 2025 & 2033
- Figure 7: North America Industrial Water Treatment Chemicals Industry Revenue (Million), by End-user Industry 2025 & 2033
- Figure 8: North America Industrial Water Treatment Chemicals Industry Volume (Billion), by End-user Industry 2025 & 2033
- Figure 9: North America Industrial Water Treatment Chemicals Industry Revenue Share (%), by End-user Industry 2025 & 2033
- Figure 10: North America Industrial Water Treatment Chemicals Industry Volume Share (%), by End-user Industry 2025 & 2033
- Figure 11: North America Industrial Water Treatment Chemicals Industry Revenue (Million), by Country 2025 & 2033
- Figure 12: North America Industrial Water Treatment Chemicals Industry Volume (Billion), by Country 2025 & 2033
- Figure 13: North America Industrial Water Treatment Chemicals Industry Revenue Share (%), by Country 2025 & 2033
- Figure 14: North America Industrial Water Treatment Chemicals Industry Volume Share (%), by Country 2025 & 2033
- Figure 15: Europe Industrial Water Treatment Chemicals Industry Revenue (Million), by Product Type 2025 & 2033
- Figure 16: Europe Industrial Water Treatment Chemicals Industry Volume (Billion), by Product Type 2025 & 2033
- Figure 17: Europe Industrial Water Treatment Chemicals Industry Revenue Share (%), by Product Type 2025 & 2033
- Figure 18: Europe Industrial Water Treatment Chemicals Industry Volume Share (%), by Product Type 2025 & 2033
- Figure 19: Europe Industrial Water Treatment Chemicals Industry Revenue (Million), by End-user Industry 2025 & 2033
- Figure 20: Europe Industrial Water Treatment Chemicals Industry Volume (Billion), by End-user Industry 2025 & 2033
- Figure 21: Europe Industrial Water Treatment Chemicals Industry Revenue Share (%), by End-user Industry 2025 & 2033
- Figure 22: Europe Industrial Water Treatment Chemicals Industry Volume Share (%), by End-user Industry 2025 & 2033
- Figure 23: Europe Industrial Water Treatment Chemicals Industry Revenue (Million), by Country 2025 & 2033
- Figure 24: Europe Industrial Water Treatment Chemicals Industry Volume (Billion), by Country 2025 & 2033
- Figure 25: Europe Industrial Water Treatment Chemicals Industry Revenue Share (%), by Country 2025 & 2033
- Figure 26: Europe Industrial Water Treatment Chemicals Industry Volume Share (%), by Country 2025 & 2033
- Figure 27: Asia Pacific Industrial Water Treatment Chemicals Industry Revenue (Million), by Product Type 2025 & 2033
- Figure 28: Asia Pacific Industrial Water Treatment Chemicals Industry Volume (Billion), by Product Type 2025 & 2033
- Figure 29: Asia Pacific Industrial Water Treatment Chemicals Industry Revenue Share (%), by Product Type 2025 & 2033
- Figure 30: Asia Pacific Industrial Water Treatment Chemicals Industry Volume Share (%), by Product Type 2025 & 2033
- Figure 31: Asia Pacific Industrial Water Treatment Chemicals Industry Revenue (Million), by End-user Industry 2025 & 2033
- Figure 32: Asia Pacific Industrial Water Treatment Chemicals Industry Volume (Billion), by End-user Industry 2025 & 2033
- Figure 33: Asia Pacific Industrial Water Treatment Chemicals Industry Revenue Share (%), by End-user Industry 2025 & 2033
- Figure 34: Asia Pacific Industrial Water Treatment Chemicals Industry Volume Share (%), by End-user Industry 2025 & 2033
- Figure 35: Asia Pacific Industrial Water Treatment Chemicals Industry Revenue (Million), by Country 2025 & 2033
- Figure 36: Asia Pacific Industrial Water Treatment Chemicals Industry Volume (Billion), by Country 2025 & 2033
- Figure 37: Asia Pacific Industrial Water Treatment Chemicals Industry Revenue Share (%), by Country 2025 & 2033
- Figure 38: Asia Pacific Industrial Water Treatment Chemicals Industry Volume Share (%), by Country 2025 & 2033
- Figure 39: South America Industrial Water Treatment Chemicals Industry Revenue (Million), by Product Type 2025 & 2033
- Figure 40: South America Industrial Water Treatment Chemicals Industry Volume (Billion), by Product Type 2025 & 2033
- Figure 41: South America Industrial Water Treatment Chemicals Industry Revenue Share (%), by Product Type 2025 & 2033
- Figure 42: South America Industrial Water Treatment Chemicals Industry Volume Share (%), by Product Type 2025 & 2033
- Figure 43: South America Industrial Water Treatment Chemicals Industry Revenue (Million), by End-user Industry 2025 & 2033
- Figure 44: South America Industrial Water Treatment Chemicals Industry Volume (Billion), by End-user Industry 2025 & 2033
- Figure 45: South America Industrial Water Treatment Chemicals Industry Revenue Share (%), by End-user Industry 2025 & 2033
- Figure 46: South America Industrial Water Treatment Chemicals Industry Volume Share (%), by End-user Industry 2025 & 2033
- Figure 47: South America Industrial Water Treatment Chemicals Industry Revenue (Million), by Country 2025 & 2033
- Figure 48: South America Industrial Water Treatment Chemicals Industry Volume (Billion), by Country 2025 & 2033
- Figure 49: South America Industrial Water Treatment Chemicals Industry Revenue Share (%), by Country 2025 & 2033
- Figure 50: South America Industrial Water Treatment Chemicals Industry Volume Share (%), by Country 2025 & 2033
- Figure 51: Middle East and Africa Industrial Water Treatment Chemicals Industry Revenue (Million), by Product Type 2025 & 2033
- Figure 52: Middle East and Africa Industrial Water Treatment Chemicals Industry Volume (Billion), by Product Type 2025 & 2033
- Figure 53: Middle East and Africa Industrial Water Treatment Chemicals Industry Revenue Share (%), by Product Type 2025 & 2033
- Figure 54: Middle East and Africa Industrial Water Treatment Chemicals Industry Volume Share (%), by Product Type 2025 & 2033
- Figure 55: Middle East and Africa Industrial Water Treatment Chemicals Industry Revenue (Million), by End-user Industry 2025 & 2033
- Figure 56: Middle East and Africa Industrial Water Treatment Chemicals Industry Volume (Billion), by End-user Industry 2025 & 2033
- Figure 57: Middle East and Africa Industrial Water Treatment Chemicals Industry Revenue Share (%), by End-user Industry 2025 & 2033
- Figure 58: Middle East and Africa Industrial Water Treatment Chemicals Industry Volume Share (%), by End-user Industry 2025 & 2033
- Figure 59: Middle East and Africa Industrial Water Treatment Chemicals Industry Revenue (Million), by Country 2025 & 2033
- Figure 60: Middle East and Africa Industrial Water Treatment Chemicals Industry Volume (Billion), by Country 2025 & 2033
- Figure 61: Middle East and Africa Industrial Water Treatment Chemicals Industry Revenue Share (%), by Country 2025 & 2033
- Figure 62: Middle East and Africa Industrial Water Treatment Chemicals Industry Volume Share (%), by Country 2025 & 2033
List of Tables
- Table 1: Global Industrial Water Treatment Chemicals Industry Revenue Million Forecast, by Product Type 2020 & 2033
- Table 2: Global Industrial Water Treatment Chemicals Industry Volume Billion Forecast, by Product Type 2020 & 2033
- Table 3: Global Industrial Water Treatment Chemicals Industry Revenue Million Forecast, by End-user Industry 2020 & 2033
- Table 4: Global Industrial Water Treatment Chemicals Industry Volume Billion Forecast, by End-user Industry 2020 & 2033
- Table 5: Global Industrial Water Treatment Chemicals Industry Revenue Million Forecast, by Region 2020 & 2033
- Table 6: Global Industrial Water Treatment Chemicals Industry Volume Billion Forecast, by Region 2020 & 2033
- Table 7: Global Industrial Water Treatment Chemicals Industry Revenue Million Forecast, by Product Type 2020 & 2033
- Table 8: Global Industrial Water Treatment Chemicals Industry Volume Billion Forecast, by Product Type 2020 & 2033
- Table 9: Global Industrial Water Treatment Chemicals Industry Revenue Million Forecast, by End-user Industry 2020 & 2033
- Table 10: Global Industrial Water Treatment Chemicals Industry Volume Billion Forecast, by End-user Industry 2020 & 2033
- Table 11: Global Industrial Water Treatment Chemicals Industry Revenue Million Forecast, by Country 2020 & 2033
- Table 12: Global Industrial Water Treatment Chemicals Industry Volume Billion Forecast, by Country 2020 & 2033
- Table 13: United States Industrial Water Treatment Chemicals Industry Revenue (Million) Forecast, by Application 2020 & 2033
- Table 14: United States Industrial Water Treatment Chemicals Industry Volume (Billion) Forecast, by Application 2020 & 2033
- Table 15: Mexico Industrial Water Treatment Chemicals Industry Revenue (Million) Forecast, by Application 2020 & 2033
- Table 16: Mexico Industrial Water Treatment Chemicals Industry Volume (Billion) Forecast, by Application 2020 & 2033
- Table 17: Canada Industrial Water Treatment Chemicals Industry Revenue (Million) Forecast, by Application 2020 & 2033
- Table 18: Canada Industrial Water Treatment Chemicals Industry Volume (Billion) Forecast, by Application 2020 & 2033
- Table 19: Global Industrial Water Treatment Chemicals Industry Revenue Million Forecast, by Product Type 2020 & 2033
- Table 20: Global Industrial Water Treatment Chemicals Industry Volume Billion Forecast, by Product Type 2020 & 2033
- Table 21: Global Industrial Water Treatment Chemicals Industry Revenue Million Forecast, by End-user Industry 2020 & 2033
- Table 22: Global Industrial Water Treatment Chemicals Industry Volume Billion Forecast, by End-user Industry 2020 & 2033
- Table 23: Global Industrial Water Treatment Chemicals Industry Revenue Million Forecast, by Country 2020 & 2033
- Table 24: Global Industrial Water Treatment Chemicals Industry Volume Billion Forecast, by Country 2020 & 2033
- Table 25: Germany Industrial Water Treatment Chemicals Industry Revenue (Million) Forecast, by Application 2020 & 2033
- Table 26: Germany Industrial Water Treatment Chemicals Industry Volume (Billion) Forecast, by Application 2020 & 2033
- Table 27: United Kingdom Industrial Water Treatment Chemicals Industry Revenue (Million) Forecast, by Application 2020 & 2033
- Table 28: United Kingdom Industrial Water Treatment Chemicals Industry Volume (Billion) Forecast, by Application 2020 & 2033
- Table 29: France Industrial Water Treatment Chemicals Industry Revenue (Million) Forecast, by Application 2020 & 2033
- Table 30: France Industrial Water Treatment Chemicals Industry Volume (Billion) Forecast, by Application 2020 & 2033
- Table 31: Italy Industrial Water Treatment Chemicals Industry Revenue (Million) Forecast, by Application 2020 & 2033
- Table 32: Italy Industrial Water Treatment Chemicals Industry Volume (Billion) Forecast, by Application 2020 & 2033
- Table 33: Rest of Europe Industrial Water Treatment Chemicals Industry Revenue (Million) Forecast, by Application 2020 & 2033
- Table 34: Rest of Europe Industrial Water Treatment Chemicals Industry Volume (Billion) Forecast, by Application 2020 & 2033
- Table 35: Global Industrial Water Treatment Chemicals Industry Revenue Million Forecast, by Product Type 2020 & 2033
- Table 36: Global Industrial Water Treatment Chemicals Industry Volume Billion Forecast, by Product Type 2020 & 2033
- Table 37: Global Industrial Water Treatment Chemicals Industry Revenue Million Forecast, by End-user Industry 2020 & 2033
- Table 38: Global Industrial Water Treatment Chemicals Industry Volume Billion Forecast, by End-user Industry 2020 & 2033
- Table 39: Global Industrial Water Treatment Chemicals Industry Revenue Million Forecast, by Country 2020 & 2033
- Table 40: Global Industrial Water Treatment Chemicals Industry Volume Billion Forecast, by Country 2020 & 2033
- Table 41: China Industrial Water Treatment Chemicals Industry Revenue (Million) Forecast, by Application 2020 & 2033
- Table 42: China Industrial Water Treatment Chemicals Industry Volume (Billion) Forecast, by Application 2020 & 2033
- Table 43: India Industrial Water Treatment Chemicals Industry Revenue (Million) Forecast, by Application 2020 & 2033
- Table 44: India Industrial Water Treatment Chemicals Industry Volume (Billion) Forecast, by Application 2020 & 2033
- Table 45: Japan Industrial Water Treatment Chemicals Industry Revenue (Million) Forecast, by Application 2020 & 2033
- Table 46: Japan Industrial Water Treatment Chemicals Industry Volume (Billion) Forecast, by Application 2020 & 2033
- Table 47: South Korea Industrial Water Treatment Chemicals Industry Revenue (Million) Forecast, by Application 2020 & 2033
- Table 48: South Korea Industrial Water Treatment Chemicals Industry Volume (Billion) Forecast, by Application 2020 & 2033
- Table 49: Rest of Asia Pacific Industrial Water Treatment Chemicals Industry Revenue (Million) Forecast, by Application 2020 & 2033
- Table 50: Rest of Asia Pacific Industrial Water Treatment Chemicals Industry Volume (Billion) Forecast, by Application 2020 & 2033
- Table 51: Global Industrial Water Treatment Chemicals Industry Revenue Million Forecast, by Product Type 2020 & 2033
- Table 52: Global Industrial Water Treatment Chemicals Industry Volume Billion Forecast, by Product Type 2020 & 2033
- Table 53: Global Industrial Water Treatment Chemicals Industry Revenue Million Forecast, by End-user Industry 2020 & 2033
- Table 54: Global Industrial Water Treatment Chemicals Industry Volume Billion Forecast, by End-user Industry 2020 & 2033
- Table 55: Global Industrial Water Treatment Chemicals Industry Revenue Million Forecast, by Country 2020 & 2033
- Table 56: Global Industrial Water Treatment Chemicals Industry Volume Billion Forecast, by Country 2020 & 2033
- Table 57: Brazil Industrial Water Treatment Chemicals Industry Revenue (Million) Forecast, by Application 2020 & 2033
- Table 58: Brazil Industrial Water Treatment Chemicals Industry Volume (Billion) Forecast, by Application 2020 & 2033
- Table 59: Argentina Industrial Water Treatment Chemicals Industry Revenue (Million) Forecast, by Application 2020 & 2033
- Table 60: Argentina Industrial Water Treatment Chemicals Industry Volume (Billion) Forecast, by Application 2020 & 2033
- Table 61: Rest of South America Industrial Water Treatment Chemicals Industry Revenue (Million) Forecast, by Application 2020 & 2033
- Table 62: Rest of South America Industrial Water Treatment Chemicals Industry Volume (Billion) Forecast, by Application 2020 & 2033
- Table 63: Global Industrial Water Treatment Chemicals Industry Revenue Million Forecast, by Product Type 2020 & 2033
- Table 64: Global Industrial Water Treatment Chemicals Industry Volume Billion Forecast, by Product Type 2020 & 2033
- Table 65: Global Industrial Water Treatment Chemicals Industry Revenue Million Forecast, by End-user Industry 2020 & 2033
- Table 66: Global Industrial Water Treatment Chemicals Industry Volume Billion Forecast, by End-user Industry 2020 & 2033
- Table 67: Global Industrial Water Treatment Chemicals Industry Revenue Million Forecast, by Country 2020 & 2033
- Table 68: Global Industrial Water Treatment Chemicals Industry Volume Billion Forecast, by Country 2020 & 2033
- Table 69: Saudi Arabia Industrial Water Treatment Chemicals Industry Revenue (Million) Forecast, by Application 2020 & 2033
- Table 70: Saudi Arabia Industrial Water Treatment Chemicals Industry Volume (Billion) Forecast, by Application 2020 & 2033
- Table 71: South Africa Industrial Water Treatment Chemicals Industry Revenue (Million) Forecast, by Application 2020 & 2033
- Table 72: South Africa Industrial Water Treatment Chemicals Industry Volume (Billion) Forecast, by Application 2020 & 2033
- Table 73: United Arab Emirates Industrial Water Treatment Chemicals Industry Revenue (Million) Forecast, by Application 2020 & 2033
- Table 74: United Arab Emirates Industrial Water Treatment Chemicals Industry Volume (Billion) Forecast, by Application 2020 & 2033
- Table 75: Rest of Middle East and Africa Industrial Water Treatment Chemicals Industry Revenue (Million) Forecast, by Application 2020 & 2033
- Table 76: Rest of Middle East and Africa Industrial Water Treatment Chemicals Industry Volume (Billion) Forecast, by Application 2020 & 2033
Frequently Asked Questions
1. What is the projected Compound Annual Growth Rate (CAGR) of the Industrial Water Treatment Chemicals Industry?
The projected CAGR is approximately 6.04%.
2. Which companies are prominent players in the Industrial Water Treatment Chemicals Industry?
Key companies in the market include BWA WATER ADDITIVES, Chemifloc LTD, Kemira, Kurita Water Industries Ltd, Lenntech B V, Lonza, DuPont de Nemours Inc, Ecolab, SNF, Solenis, SUEZ*List Not Exhaustive.
3. What are the main segments of the Industrial Water Treatment Chemicals Industry?
The market segments include Product Type, End-user Industry.
4. Can you provide details about the market size?
The market size is estimated to be USD 22.19 Million as of 2022.
5. What are some drivers contributing to market growth?
Increasing Production of Shale Gas in the United States; Growing Production Activities in Chemical and Paper Industry; Other Drivers.
6. What are the notable trends driving market growth?
Power Industry to Dominate the Market.
7. Are there any restraints impacting market growth?
Increasing Production of Shale Gas in the United States; Growing Production Activities in Chemical and Paper Industry; Other Drivers.
8. Can you provide examples of recent developments in the market?
March 2023: Solenis, providing water treatment solutions for municipal and industrial water treatment, announced that it agreed to acquire Diversey, a cleaning solutions company primarily for industrial water treatment, for USD 4.6 billion.
9. What pricing options are available for accessing the report?
Pricing options include single-user, multi-user, and enterprise licenses priced at USD 4750, USD 5250, and USD 8750 respectively.
10. Is the market size provided in terms of value or volume?
The market size is provided in terms of value, measured in Million and volume, measured in Billion.
11. Are there any specific market keywords associated with the report?
Yes, the market keyword associated with the report is "Industrial Water Treatment Chemicals Industry," which aids in identifying and referencing the specific market segment covered.
12. How do I determine which pricing option suits my needs best?
The pricing options vary based on user requirements and access needs. Individual users may opt for single-user licenses, while businesses requiring broader access may choose multi-user or enterprise licenses for cost-effective access to the report.
13. Are there any additional resources or data provided in the Industrial Water Treatment Chemicals Industry report?
While the report offers comprehensive insights, it's advisable to review the specific contents or supplementary materials provided to ascertain if additional resources or data are available.
14. How can I stay updated on further developments or reports in the Industrial Water Treatment Chemicals Industry?
To stay informed about further developments, trends, and reports in the Industrial Water Treatment Chemicals Industry, consider subscribing to industry newsletters, following relevant companies and organizations, or regularly checking reputable industry news sources and publications.
Methodology
Step 1 - Identification of Relevant Samples Size from Population Database


Step 2 - Approaches for Defining Global Market Size (Value, Volume* & Price*)

Note*: In applicable scenarios
Step 3 - Data Sources
Primary Research
- Web Analytics
- Survey Reports
- Research Institute
- Latest Research Reports
- Opinion Leaders
Secondary Research
- Annual Reports
- White Paper
- Latest Press Release
- Industry Association
- Paid Database
- Investor Presentations

Step 4 - Data Triangulation
Involves using different sources of information in order to increase the validity of a study
These sources are likely to be stakeholders in a program - participants, other researchers, program staff, other community members, and so on.
Then we put all data in single framework & apply various statistical tools to find out the dynamic on the market.
During the analysis stage, feedback from the stakeholder groups would be compared to determine areas of agreement as well as areas of divergence