

Key Insights
The implantable blood glucose monitor (iBGM) market is experiencing robust growth, driven by the increasing prevalence of diabetes, advancements in sensor technology, and a rising demand for continuous glucose monitoring (CGM) solutions that offer improved convenience and better diabetes management compared to traditional methods. The market's expansion is further fueled by the development of smaller, more accurate, and longer-lasting implantable sensors, reducing the frequency of replacements and improving patient compliance. While challenges remain, such as the relatively high cost of devices and potential surgical risks associated with implantation, these are being mitigated by technological advancements and increased insurance coverage in several regions. The market is segmented by device type (e.g., single-use vs. reusable), application (e.g., type 1 vs. type 2 diabetes), and end-user (e.g., hospitals, clinics, homecare). Key players like Senseonics, GluSense, Dexcom, Medtronic, and Abbott are actively engaged in research and development, fostering competition and driving innovation within the sector. This leads to a continuous improvement in sensor technology, resulting in more accurate, reliable, and user-friendly iBGMs. The overall market outlook for iBGMs is positive, with substantial growth anticipated over the next decade, driven by an expanding diabetic population and the increasing adoption of minimally invasive continuous glucose monitoring technologies.
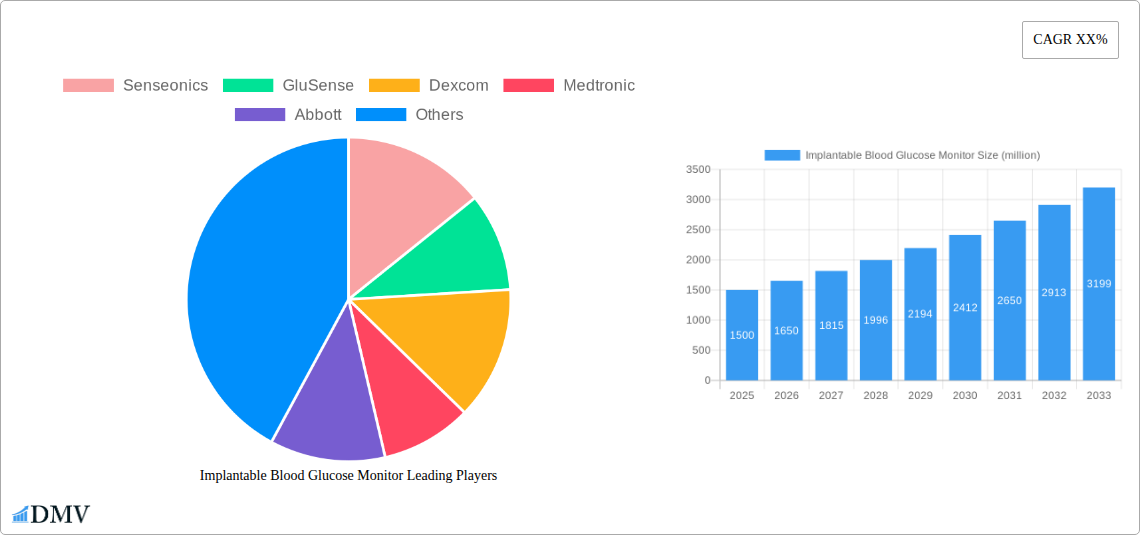
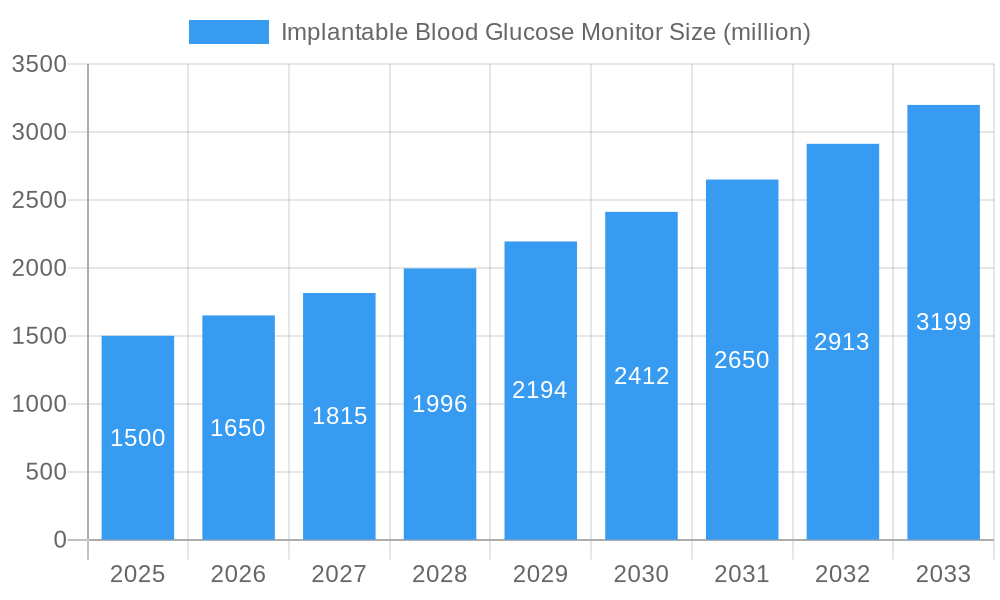
Implantable Blood Glucose Monitor Market Size (In Billion)
The competitive landscape is dynamic, with established players constantly striving to improve their offerings and newer entrants seeking to disrupt the market with innovative technologies. Strategic partnerships, mergers, and acquisitions are likely to shape the market structure in the coming years. Regional variations in market growth will be influenced by factors such as healthcare infrastructure, reimbursement policies, and the prevalence of diabetes. North America and Europe are expected to dominate the market initially due to higher adoption rates and advanced healthcare systems. However, emerging economies in Asia-Pacific and Latin America are poised for significant growth driven by rising diabetes prevalence and increasing healthcare expenditure. Continued focus on improving device longevity, enhancing accuracy, and minimizing invasiveness will be crucial for sustaining the market's momentum and expanding its reach to a wider patient population.
Implantable Blood Glucose Monitor Company Market Share
Implantable Blood Glucose Monitor Market Report: 2019-2033
This comprehensive report provides an in-depth analysis of the global implantable blood glucose monitor market, projecting a market valuation exceeding $XX million by 2033. The study period spans 2019-2033, with 2025 serving as both the base and estimated year. The forecast period covers 2025-2033, and the historical period encompasses 2019-2024. Key players like Senseonics, GluSense, Dexcom, Medtronic, and Abbott are extensively profiled, revealing market share dynamics and strategic initiatives shaping this rapidly evolving sector.
Implantable Blood Glucose Monitor Market Composition & Trends
This section delves into the competitive landscape of the implantable blood glucose monitor market, analyzing market concentration, innovation drivers, regulatory hurdles, substitute products, end-user demographics, and mergers & acquisitions (M&A) activities. We examine market share distribution among key players, revealing the dominance of established players and the emergence of innovative startups. M&A activity is analyzed, with estimated deal values exceeding $XX million in the last five years driving consolidation and technological advancements.
- Market Concentration: The market exhibits a moderately concentrated structure, with the top five players holding approximately XX% of the market share in 2024.
- Innovation Catalysts: Continuous advancements in sensor technology, miniaturization, and data analytics are driving innovation.
- Regulatory Landscape: Stringent regulatory approvals and reimbursement policies influence market penetration.
- Substitute Products: Existing blood glucose monitoring methods (e.g., continuous glucose monitors (CGMs)) pose competitive pressure, although implantable monitors offer unique advantages.
- End-User Profiles: The primary end-users are patients with diabetes, with a growing focus on expanding to other patient populations.
- M&A Activities: Significant M&A activity, totaling an estimated $XX million in value over the past five years, has reshaped the competitive landscape.
Implantable Blood Glucose Monitor Industry Evolution
This section examines the market's growth trajectory from 2019 to 2033, exploring technological advancements, shifting consumer preferences, and evolving regulatory landscapes. The market experienced a Compound Annual Growth Rate (CAGR) of XX% during the historical period (2019-2024), driven by increased diabetes prevalence and technological breakthroughs. We project a CAGR of XX% during the forecast period (2025-2033), anticipating significant market expansion, fueled by improved device longevity, enhanced accuracy, and wider accessibility. Adoption rates are analyzed, highlighting increasing acceptance among patients and healthcare providers.
Leading Regions, Countries, or Segments in Implantable Blood Glucose Monitor
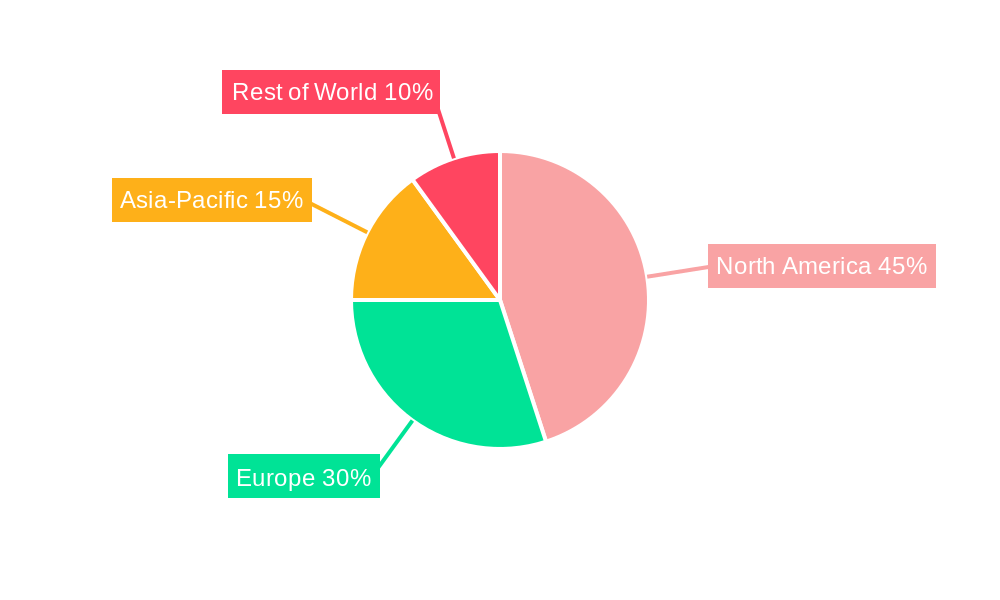
This section identifies the leading regions, countries, and segments within the implantable blood glucose monitor market. North America currently holds the largest market share due to high diabetes prevalence, advanced healthcare infrastructure, and robust regulatory support.
- Key Drivers for North American Dominance:
- High prevalence of diabetes and related complications.
- Strong regulatory approval pathways.
- Significant investments in medical technology research and development.
- Extensive healthcare insurance coverage.
- Early adoption of advanced technologies.
The detailed analysis further explores factors contributing to this dominance, including market access, reimbursement policies, and technological adoption rates. Growth in other regions, such as Europe and Asia-Pacific, is analyzed, considering factors such as increasing diabetes prevalence, rising healthcare expenditure, and growing technological advancements.
Implantable Blood Glucose Monitor Product Innovations
Recent innovations focus on extending sensor lifespan, enhancing accuracy, minimizing invasiveness, and improving data transmission capabilities. Miniaturization and wireless connectivity are key advancements, making devices more comfortable and user-friendly. The incorporation of advanced algorithms improves data interpretation and predictive capabilities. These improvements aim to enhance patient compliance and ultimately improve diabetes management.
Propelling Factors for Implantable Blood Glucose Monitor Growth
Several key factors drive market expansion: the increasing prevalence of diabetes globally, technological advancements leading to improved device accuracy and longevity, rising healthcare expenditure, favorable regulatory landscapes in key markets, and growing awareness among patients and healthcare professionals regarding the benefits of continuous glucose monitoring. Technological advancements, particularly in sensor technology and data analytics, are crucial drivers. Government initiatives supporting diabetes management also contribute significantly.
Obstacles in the Implantable Blood Glucose Monitor Market
Despite the significant potential, challenges remain. High initial costs, reimbursement limitations in certain regions, potential complications associated with implantation, concerns regarding device longevity, and the competitive landscape involving established CGM players pose significant challenges. Supply chain disruptions and the complexity of regulatory approval processes also impact market growth.
Future Opportunities in Implantable Blood Glucose Monitor
Future opportunities include expanding into underserved markets, integrating the devices with other diabetes management technologies (e.g., insulin pumps), developing closed-loop systems for automated insulin delivery, and exploring the application of implantable sensors for monitoring other biomarkers. Advanced materials science and improved manufacturing techniques will further drive innovation and cost reduction.
Major Players in the Implantable Blood Glucose Monitor Ecosystem
Key Developments in Implantable Blood Glucose Monitor Industry
- 2022 (Q4): Senseonics receives FDA approval for its Eversense next-generation implantable CGM.
- 2023 (Q1): Medtronic launches a new algorithm for its implantable glucose monitor, enhancing accuracy.
- 2023 (Q2): Abbott announces a strategic partnership to expand the distribution network for its implantable glucose monitor.
- (Further key developments will be included in the final report)
Strategic Implantable Blood Glucose Monitor Market Forecast
The implantable blood glucose monitor market is poised for robust growth, driven by technological advancements, increasing diabetes prevalence, and rising healthcare expenditure. The market's future hinges on addressing current challenges, including cost reduction, regulatory approvals, and enhanced device features. Continued innovation and strategic partnerships will significantly shape the market's trajectory over the next decade, leading to increased market penetration and improved patient outcomes.
Implantable Blood Glucose Monitor Segmentation
-
1. Application
- 1.1. Adult
- 1.2. Child
-
2. Types
- 2.1. Short Term (Less than 30 Days)
- 2.2. Long Term (180 Days)
Implantable Blood Glucose Monitor Segmentation By Geography
-
1. North America
- 1.1. United States
- 1.2. Canada
- 1.3. Mexico
-
2. South America
- 2.1. Brazil
- 2.2. Argentina
- 2.3. Rest of South America
-
3. Europe
- 3.1. United Kingdom
- 3.2. Germany
- 3.3. France
- 3.4. Italy
- 3.5. Spain
- 3.6. Russia
- 3.7. Benelux
- 3.8. Nordics
- 3.9. Rest of Europe
-
4. Middle East & Africa
- 4.1. Turkey
- 4.2. Israel
- 4.3. GCC
- 4.4. North Africa
- 4.5. South Africa
- 4.6. Rest of Middle East & Africa
-
5. Asia Pacific
- 5.1. China
- 5.2. India
- 5.3. Japan
- 5.4. South Korea
- 5.5. ASEAN
- 5.6. Oceania
- 5.7. Rest of Asia Pacific
Implantable Blood Glucose Monitor Regional Market Share
Geographic Coverage of Implantable Blood Glucose Monitor
Implantable Blood Glucose Monitor REPORT HIGHLIGHTS
| Aspects | Details |
|---|---|
| Study Period | 2020-2034 |
| Base Year | 2025 |
| Estimated Year | 2026 |
| Forecast Period | 2026-2034 |
| Historical Period | 2020-2025 |
| Growth Rate | CAGR of XX% from 2020-2034 |
| Segmentation |
|
Table of Contents
- 1. Introduction
- 1.1. Research Scope
- 1.2. Market Segmentation
- 1.3. Research Methodology
- 1.4. Definitions and Assumptions
- 2. Executive Summary
- 2.1. Introduction
- 3. Market Dynamics
- 3.1. Introduction
- 3.2. Market Drivers
- 3.3. Market Restrains
- 3.4. Market Trends
- 4. Market Factor Analysis
- 4.1. Porters Five Forces
- 4.2. Supply/Value Chain
- 4.3. PESTEL analysis
- 4.4. Market Entropy
- 4.5. Patent/Trademark Analysis
- 5. Global Implantable Blood Glucose Monitor Analysis, Insights and Forecast, 2020-2032
- 5.1. Market Analysis, Insights and Forecast - by Application
- 5.1.1. Adult
- 5.1.2. Child
- 5.2. Market Analysis, Insights and Forecast - by Types
- 5.2.1. Short Term (Less than 30 Days)
- 5.2.2. Long Term (180 Days)
- 5.3. Market Analysis, Insights and Forecast - by Region
- 5.3.1. North America
- 5.3.2. South America
- 5.3.3. Europe
- 5.3.4. Middle East & Africa
- 5.3.5. Asia Pacific
- 5.1. Market Analysis, Insights and Forecast - by Application
- 6. North America Implantable Blood Glucose Monitor Analysis, Insights and Forecast, 2020-2032
- 6.1. Market Analysis, Insights and Forecast - by Application
- 6.1.1. Adult
- 6.1.2. Child
- 6.2. Market Analysis, Insights and Forecast - by Types
- 6.2.1. Short Term (Less than 30 Days)
- 6.2.2. Long Term (180 Days)
- 6.1. Market Analysis, Insights and Forecast - by Application
- 7. South America Implantable Blood Glucose Monitor Analysis, Insights and Forecast, 2020-2032
- 7.1. Market Analysis, Insights and Forecast - by Application
- 7.1.1. Adult
- 7.1.2. Child
- 7.2. Market Analysis, Insights and Forecast - by Types
- 7.2.1. Short Term (Less than 30 Days)
- 7.2.2. Long Term (180 Days)
- 7.1. Market Analysis, Insights and Forecast - by Application
- 8. Europe Implantable Blood Glucose Monitor Analysis, Insights and Forecast, 2020-2032
- 8.1. Market Analysis, Insights and Forecast - by Application
- 8.1.1. Adult
- 8.1.2. Child
- 8.2. Market Analysis, Insights and Forecast - by Types
- 8.2.1. Short Term (Less than 30 Days)
- 8.2.2. Long Term (180 Days)
- 8.1. Market Analysis, Insights and Forecast - by Application
- 9. Middle East & Africa Implantable Blood Glucose Monitor Analysis, Insights and Forecast, 2020-2032
- 9.1. Market Analysis, Insights and Forecast - by Application
- 9.1.1. Adult
- 9.1.2. Child
- 9.2. Market Analysis, Insights and Forecast - by Types
- 9.2.1. Short Term (Less than 30 Days)
- 9.2.2. Long Term (180 Days)
- 9.1. Market Analysis, Insights and Forecast - by Application
- 10. Asia Pacific Implantable Blood Glucose Monitor Analysis, Insights and Forecast, 2020-2032
- 10.1. Market Analysis, Insights and Forecast - by Application
- 10.1.1. Adult
- 10.1.2. Child
- 10.2. Market Analysis, Insights and Forecast - by Types
- 10.2.1. Short Term (Less than 30 Days)
- 10.2.2. Long Term (180 Days)
- 10.1. Market Analysis, Insights and Forecast - by Application
- 11. Competitive Analysis
- 11.1. Global Market Share Analysis 2025
- 11.2. Company Profiles
- 11.2.1 Senseonics
- 11.2.1.1. Overview
- 11.2.1.2. Products
- 11.2.1.3. SWOT Analysis
- 11.2.1.4. Recent Developments
- 11.2.1.5. Financials (Based on Availability)
- 11.2.2 GluSense
- 11.2.2.1. Overview
- 11.2.2.2. Products
- 11.2.2.3. SWOT Analysis
- 11.2.2.4. Recent Developments
- 11.2.2.5. Financials (Based on Availability)
- 11.2.3 Dexcom
- 11.2.3.1. Overview
- 11.2.3.2. Products
- 11.2.3.3. SWOT Analysis
- 11.2.3.4. Recent Developments
- 11.2.3.5. Financials (Based on Availability)
- 11.2.4 Medtronic
- 11.2.4.1. Overview
- 11.2.4.2. Products
- 11.2.4.3. SWOT Analysis
- 11.2.4.4. Recent Developments
- 11.2.4.5. Financials (Based on Availability)
- 11.2.5 Abbott
- 11.2.5.1. Overview
- 11.2.5.2. Products
- 11.2.5.3. SWOT Analysis
- 11.2.5.4. Recent Developments
- 11.2.5.5. Financials (Based on Availability)
- 11.2.1 Senseonics
List of Figures
- Figure 1: Global Implantable Blood Glucose Monitor Revenue Breakdown (million, %) by Region 2025 & 2033
- Figure 2: Global Implantable Blood Glucose Monitor Volume Breakdown (K, %) by Region 2025 & 2033
- Figure 3: North America Implantable Blood Glucose Monitor Revenue (million), by Application 2025 & 2033
- Figure 4: North America Implantable Blood Glucose Monitor Volume (K), by Application 2025 & 2033
- Figure 5: North America Implantable Blood Glucose Monitor Revenue Share (%), by Application 2025 & 2033
- Figure 6: North America Implantable Blood Glucose Monitor Volume Share (%), by Application 2025 & 2033
- Figure 7: North America Implantable Blood Glucose Monitor Revenue (million), by Types 2025 & 2033
- Figure 8: North America Implantable Blood Glucose Monitor Volume (K), by Types 2025 & 2033
- Figure 9: North America Implantable Blood Glucose Monitor Revenue Share (%), by Types 2025 & 2033
- Figure 10: North America Implantable Blood Glucose Monitor Volume Share (%), by Types 2025 & 2033
- Figure 11: North America Implantable Blood Glucose Monitor Revenue (million), by Country 2025 & 2033
- Figure 12: North America Implantable Blood Glucose Monitor Volume (K), by Country 2025 & 2033
- Figure 13: North America Implantable Blood Glucose Monitor Revenue Share (%), by Country 2025 & 2033
- Figure 14: North America Implantable Blood Glucose Monitor Volume Share (%), by Country 2025 & 2033
- Figure 15: South America Implantable Blood Glucose Monitor Revenue (million), by Application 2025 & 2033
- Figure 16: South America Implantable Blood Glucose Monitor Volume (K), by Application 2025 & 2033
- Figure 17: South America Implantable Blood Glucose Monitor Revenue Share (%), by Application 2025 & 2033
- Figure 18: South America Implantable Blood Glucose Monitor Volume Share (%), by Application 2025 & 2033
- Figure 19: South America Implantable Blood Glucose Monitor Revenue (million), by Types 2025 & 2033
- Figure 20: South America Implantable Blood Glucose Monitor Volume (K), by Types 2025 & 2033
- Figure 21: South America Implantable Blood Glucose Monitor Revenue Share (%), by Types 2025 & 2033
- Figure 22: South America Implantable Blood Glucose Monitor Volume Share (%), by Types 2025 & 2033
- Figure 23: South America Implantable Blood Glucose Monitor Revenue (million), by Country 2025 & 2033
- Figure 24: South America Implantable Blood Glucose Monitor Volume (K), by Country 2025 & 2033
- Figure 25: South America Implantable Blood Glucose Monitor Revenue Share (%), by Country 2025 & 2033
- Figure 26: South America Implantable Blood Glucose Monitor Volume Share (%), by Country 2025 & 2033
- Figure 27: Europe Implantable Blood Glucose Monitor Revenue (million), by Application 2025 & 2033
- Figure 28: Europe Implantable Blood Glucose Monitor Volume (K), by Application 2025 & 2033
- Figure 29: Europe Implantable Blood Glucose Monitor Revenue Share (%), by Application 2025 & 2033
- Figure 30: Europe Implantable Blood Glucose Monitor Volume Share (%), by Application 2025 & 2033
- Figure 31: Europe Implantable Blood Glucose Monitor Revenue (million), by Types 2025 & 2033
- Figure 32: Europe Implantable Blood Glucose Monitor Volume (K), by Types 2025 & 2033
- Figure 33: Europe Implantable Blood Glucose Monitor Revenue Share (%), by Types 2025 & 2033
- Figure 34: Europe Implantable Blood Glucose Monitor Volume Share (%), by Types 2025 & 2033
- Figure 35: Europe Implantable Blood Glucose Monitor Revenue (million), by Country 2025 & 2033
- Figure 36: Europe Implantable Blood Glucose Monitor Volume (K), by Country 2025 & 2033
- Figure 37: Europe Implantable Blood Glucose Monitor Revenue Share (%), by Country 2025 & 2033
- Figure 38: Europe Implantable Blood Glucose Monitor Volume Share (%), by Country 2025 & 2033
- Figure 39: Middle East & Africa Implantable Blood Glucose Monitor Revenue (million), by Application 2025 & 2033
- Figure 40: Middle East & Africa Implantable Blood Glucose Monitor Volume (K), by Application 2025 & 2033
- Figure 41: Middle East & Africa Implantable Blood Glucose Monitor Revenue Share (%), by Application 2025 & 2033
- Figure 42: Middle East & Africa Implantable Blood Glucose Monitor Volume Share (%), by Application 2025 & 2033
- Figure 43: Middle East & Africa Implantable Blood Glucose Monitor Revenue (million), by Types 2025 & 2033
- Figure 44: Middle East & Africa Implantable Blood Glucose Monitor Volume (K), by Types 2025 & 2033
- Figure 45: Middle East & Africa Implantable Blood Glucose Monitor Revenue Share (%), by Types 2025 & 2033
- Figure 46: Middle East & Africa Implantable Blood Glucose Monitor Volume Share (%), by Types 2025 & 2033
- Figure 47: Middle East & Africa Implantable Blood Glucose Monitor Revenue (million), by Country 2025 & 2033
- Figure 48: Middle East & Africa Implantable Blood Glucose Monitor Volume (K), by Country 2025 & 2033
- Figure 49: Middle East & Africa Implantable Blood Glucose Monitor Revenue Share (%), by Country 2025 & 2033
- Figure 50: Middle East & Africa Implantable Blood Glucose Monitor Volume Share (%), by Country 2025 & 2033
- Figure 51: Asia Pacific Implantable Blood Glucose Monitor Revenue (million), by Application 2025 & 2033
- Figure 52: Asia Pacific Implantable Blood Glucose Monitor Volume (K), by Application 2025 & 2033
- Figure 53: Asia Pacific Implantable Blood Glucose Monitor Revenue Share (%), by Application 2025 & 2033
- Figure 54: Asia Pacific Implantable Blood Glucose Monitor Volume Share (%), by Application 2025 & 2033
- Figure 55: Asia Pacific Implantable Blood Glucose Monitor Revenue (million), by Types 2025 & 2033
- Figure 56: Asia Pacific Implantable Blood Glucose Monitor Volume (K), by Types 2025 & 2033
- Figure 57: Asia Pacific Implantable Blood Glucose Monitor Revenue Share (%), by Types 2025 & 2033
- Figure 58: Asia Pacific Implantable Blood Glucose Monitor Volume Share (%), by Types 2025 & 2033
- Figure 59: Asia Pacific Implantable Blood Glucose Monitor Revenue (million), by Country 2025 & 2033
- Figure 60: Asia Pacific Implantable Blood Glucose Monitor Volume (K), by Country 2025 & 2033
- Figure 61: Asia Pacific Implantable Blood Glucose Monitor Revenue Share (%), by Country 2025 & 2033
- Figure 62: Asia Pacific Implantable Blood Glucose Monitor Volume Share (%), by Country 2025 & 2033
List of Tables
- Table 1: Global Implantable Blood Glucose Monitor Revenue million Forecast, by Application 2020 & 2033
- Table 2: Global Implantable Blood Glucose Monitor Volume K Forecast, by Application 2020 & 2033
- Table 3: Global Implantable Blood Glucose Monitor Revenue million Forecast, by Types 2020 & 2033
- Table 4: Global Implantable Blood Glucose Monitor Volume K Forecast, by Types 2020 & 2033
- Table 5: Global Implantable Blood Glucose Monitor Revenue million Forecast, by Region 2020 & 2033
- Table 6: Global Implantable Blood Glucose Monitor Volume K Forecast, by Region 2020 & 2033
- Table 7: Global Implantable Blood Glucose Monitor Revenue million Forecast, by Application 2020 & 2033
- Table 8: Global Implantable Blood Glucose Monitor Volume K Forecast, by Application 2020 & 2033
- Table 9: Global Implantable Blood Glucose Monitor Revenue million Forecast, by Types 2020 & 2033
- Table 10: Global Implantable Blood Glucose Monitor Volume K Forecast, by Types 2020 & 2033
- Table 11: Global Implantable Blood Glucose Monitor Revenue million Forecast, by Country 2020 & 2033
- Table 12: Global Implantable Blood Glucose Monitor Volume K Forecast, by Country 2020 & 2033
- Table 13: United States Implantable Blood Glucose Monitor Revenue (million) Forecast, by Application 2020 & 2033
- Table 14: United States Implantable Blood Glucose Monitor Volume (K) Forecast, by Application 2020 & 2033
- Table 15: Canada Implantable Blood Glucose Monitor Revenue (million) Forecast, by Application 2020 & 2033
- Table 16: Canada Implantable Blood Glucose Monitor Volume (K) Forecast, by Application 2020 & 2033
- Table 17: Mexico Implantable Blood Glucose Monitor Revenue (million) Forecast, by Application 2020 & 2033
- Table 18: Mexico Implantable Blood Glucose Monitor Volume (K) Forecast, by Application 2020 & 2033
- Table 19: Global Implantable Blood Glucose Monitor Revenue million Forecast, by Application 2020 & 2033
- Table 20: Global Implantable Blood Glucose Monitor Volume K Forecast, by Application 2020 & 2033
- Table 21: Global Implantable Blood Glucose Monitor Revenue million Forecast, by Types 2020 & 2033
- Table 22: Global Implantable Blood Glucose Monitor Volume K Forecast, by Types 2020 & 2033
- Table 23: Global Implantable Blood Glucose Monitor Revenue million Forecast, by Country 2020 & 2033
- Table 24: Global Implantable Blood Glucose Monitor Volume K Forecast, by Country 2020 & 2033
- Table 25: Brazil Implantable Blood Glucose Monitor Revenue (million) Forecast, by Application 2020 & 2033
- Table 26: Brazil Implantable Blood Glucose Monitor Volume (K) Forecast, by Application 2020 & 2033
- Table 27: Argentina Implantable Blood Glucose Monitor Revenue (million) Forecast, by Application 2020 & 2033
- Table 28: Argentina Implantable Blood Glucose Monitor Volume (K) Forecast, by Application 2020 & 2033
- Table 29: Rest of South America Implantable Blood Glucose Monitor Revenue (million) Forecast, by Application 2020 & 2033
- Table 30: Rest of South America Implantable Blood Glucose Monitor Volume (K) Forecast, by Application 2020 & 2033
- Table 31: Global Implantable Blood Glucose Monitor Revenue million Forecast, by Application 2020 & 2033
- Table 32: Global Implantable Blood Glucose Monitor Volume K Forecast, by Application 2020 & 2033
- Table 33: Global Implantable Blood Glucose Monitor Revenue million Forecast, by Types 2020 & 2033
- Table 34: Global Implantable Blood Glucose Monitor Volume K Forecast, by Types 2020 & 2033
- Table 35: Global Implantable Blood Glucose Monitor Revenue million Forecast, by Country 2020 & 2033
- Table 36: Global Implantable Blood Glucose Monitor Volume K Forecast, by Country 2020 & 2033
- Table 37: United Kingdom Implantable Blood Glucose Monitor Revenue (million) Forecast, by Application 2020 & 2033
- Table 38: United Kingdom Implantable Blood Glucose Monitor Volume (K) Forecast, by Application 2020 & 2033
- Table 39: Germany Implantable Blood Glucose Monitor Revenue (million) Forecast, by Application 2020 & 2033
- Table 40: Germany Implantable Blood Glucose Monitor Volume (K) Forecast, by Application 2020 & 2033
- Table 41: France Implantable Blood Glucose Monitor Revenue (million) Forecast, by Application 2020 & 2033
- Table 42: France Implantable Blood Glucose Monitor Volume (K) Forecast, by Application 2020 & 2033
- Table 43: Italy Implantable Blood Glucose Monitor Revenue (million) Forecast, by Application 2020 & 2033
- Table 44: Italy Implantable Blood Glucose Monitor Volume (K) Forecast, by Application 2020 & 2033
- Table 45: Spain Implantable Blood Glucose Monitor Revenue (million) Forecast, by Application 2020 & 2033
- Table 46: Spain Implantable Blood Glucose Monitor Volume (K) Forecast, by Application 2020 & 2033
- Table 47: Russia Implantable Blood Glucose Monitor Revenue (million) Forecast, by Application 2020 & 2033
- Table 48: Russia Implantable Blood Glucose Monitor Volume (K) Forecast, by Application 2020 & 2033
- Table 49: Benelux Implantable Blood Glucose Monitor Revenue (million) Forecast, by Application 2020 & 2033
- Table 50: Benelux Implantable Blood Glucose Monitor Volume (K) Forecast, by Application 2020 & 2033
- Table 51: Nordics Implantable Blood Glucose Monitor Revenue (million) Forecast, by Application 2020 & 2033
- Table 52: Nordics Implantable Blood Glucose Monitor Volume (K) Forecast, by Application 2020 & 2033
- Table 53: Rest of Europe Implantable Blood Glucose Monitor Revenue (million) Forecast, by Application 2020 & 2033
- Table 54: Rest of Europe Implantable Blood Glucose Monitor Volume (K) Forecast, by Application 2020 & 2033
- Table 55: Global Implantable Blood Glucose Monitor Revenue million Forecast, by Application 2020 & 2033
- Table 56: Global Implantable Blood Glucose Monitor Volume K Forecast, by Application 2020 & 2033
- Table 57: Global Implantable Blood Glucose Monitor Revenue million Forecast, by Types 2020 & 2033
- Table 58: Global Implantable Blood Glucose Monitor Volume K Forecast, by Types 2020 & 2033
- Table 59: Global Implantable Blood Glucose Monitor Revenue million Forecast, by Country 2020 & 2033
- Table 60: Global Implantable Blood Glucose Monitor Volume K Forecast, by Country 2020 & 2033
- Table 61: Turkey Implantable Blood Glucose Monitor Revenue (million) Forecast, by Application 2020 & 2033
- Table 62: Turkey Implantable Blood Glucose Monitor Volume (K) Forecast, by Application 2020 & 2033
- Table 63: Israel Implantable Blood Glucose Monitor Revenue (million) Forecast, by Application 2020 & 2033
- Table 64: Israel Implantable Blood Glucose Monitor Volume (K) Forecast, by Application 2020 & 2033
- Table 65: GCC Implantable Blood Glucose Monitor Revenue (million) Forecast, by Application 2020 & 2033
- Table 66: GCC Implantable Blood Glucose Monitor Volume (K) Forecast, by Application 2020 & 2033
- Table 67: North Africa Implantable Blood Glucose Monitor Revenue (million) Forecast, by Application 2020 & 2033
- Table 68: North Africa Implantable Blood Glucose Monitor Volume (K) Forecast, by Application 2020 & 2033
- Table 69: South Africa Implantable Blood Glucose Monitor Revenue (million) Forecast, by Application 2020 & 2033
- Table 70: South Africa Implantable Blood Glucose Monitor Volume (K) Forecast, by Application 2020 & 2033
- Table 71: Rest of Middle East & Africa Implantable Blood Glucose Monitor Revenue (million) Forecast, by Application 2020 & 2033
- Table 72: Rest of Middle East & Africa Implantable Blood Glucose Monitor Volume (K) Forecast, by Application 2020 & 2033
- Table 73: Global Implantable Blood Glucose Monitor Revenue million Forecast, by Application 2020 & 2033
- Table 74: Global Implantable Blood Glucose Monitor Volume K Forecast, by Application 2020 & 2033
- Table 75: Global Implantable Blood Glucose Monitor Revenue million Forecast, by Types 2020 & 2033
- Table 76: Global Implantable Blood Glucose Monitor Volume K Forecast, by Types 2020 & 2033
- Table 77: Global Implantable Blood Glucose Monitor Revenue million Forecast, by Country 2020 & 2033
- Table 78: Global Implantable Blood Glucose Monitor Volume K Forecast, by Country 2020 & 2033
- Table 79: China Implantable Blood Glucose Monitor Revenue (million) Forecast, by Application 2020 & 2033
- Table 80: China Implantable Blood Glucose Monitor Volume (K) Forecast, by Application 2020 & 2033
- Table 81: India Implantable Blood Glucose Monitor Revenue (million) Forecast, by Application 2020 & 2033
- Table 82: India Implantable Blood Glucose Monitor Volume (K) Forecast, by Application 2020 & 2033
- Table 83: Japan Implantable Blood Glucose Monitor Revenue (million) Forecast, by Application 2020 & 2033
- Table 84: Japan Implantable Blood Glucose Monitor Volume (K) Forecast, by Application 2020 & 2033
- Table 85: South Korea Implantable Blood Glucose Monitor Revenue (million) Forecast, by Application 2020 & 2033
- Table 86: South Korea Implantable Blood Glucose Monitor Volume (K) Forecast, by Application 2020 & 2033
- Table 87: ASEAN Implantable Blood Glucose Monitor Revenue (million) Forecast, by Application 2020 & 2033
- Table 88: ASEAN Implantable Blood Glucose Monitor Volume (K) Forecast, by Application 2020 & 2033
- Table 89: Oceania Implantable Blood Glucose Monitor Revenue (million) Forecast, by Application 2020 & 2033
- Table 90: Oceania Implantable Blood Glucose Monitor Volume (K) Forecast, by Application 2020 & 2033
- Table 91: Rest of Asia Pacific Implantable Blood Glucose Monitor Revenue (million) Forecast, by Application 2020 & 2033
- Table 92: Rest of Asia Pacific Implantable Blood Glucose Monitor Volume (K) Forecast, by Application 2020 & 2033
Frequently Asked Questions
1. What is the projected Compound Annual Growth Rate (CAGR) of the Implantable Blood Glucose Monitor?
The projected CAGR is approximately XX%.
2. Which companies are prominent players in the Implantable Blood Glucose Monitor?
Key companies in the market include Senseonics, GluSense, Dexcom, Medtronic, Abbott.
3. What are the main segments of the Implantable Blood Glucose Monitor?
The market segments include Application, Types.
4. Can you provide details about the market size?
The market size is estimated to be USD XXX million as of 2022.
5. What are some drivers contributing to market growth?
N/A
6. What are the notable trends driving market growth?
N/A
7. Are there any restraints impacting market growth?
N/A
8. Can you provide examples of recent developments in the market?
N/A
9. What pricing options are available for accessing the report?
Pricing options include single-user, multi-user, and enterprise licenses priced at USD 3350.00, USD 5025.00, and USD 6700.00 respectively.
10. Is the market size provided in terms of value or volume?
The market size is provided in terms of value, measured in million and volume, measured in K.
11. Are there any specific market keywords associated with the report?
Yes, the market keyword associated with the report is "Implantable Blood Glucose Monitor," which aids in identifying and referencing the specific market segment covered.
12. How do I determine which pricing option suits my needs best?
The pricing options vary based on user requirements and access needs. Individual users may opt for single-user licenses, while businesses requiring broader access may choose multi-user or enterprise licenses for cost-effective access to the report.
13. Are there any additional resources or data provided in the Implantable Blood Glucose Monitor report?
While the report offers comprehensive insights, it's advisable to review the specific contents or supplementary materials provided to ascertain if additional resources or data are available.
14. How can I stay updated on further developments or reports in the Implantable Blood Glucose Monitor?
To stay informed about further developments, trends, and reports in the Implantable Blood Glucose Monitor, consider subscribing to industry newsletters, following relevant companies and organizations, or regularly checking reputable industry news sources and publications.
Methodology
Step 1 - Identification of Relevant Samples Size from Population Database


Step 2 - Approaches for Defining Global Market Size (Value, Volume* & Price*)

Note*: In applicable scenarios
Step 3 - Data Sources
Primary Research
- Web Analytics
- Survey Reports
- Research Institute
- Latest Research Reports
- Opinion Leaders
Secondary Research
- Annual Reports
- White Paper
- Latest Press Release
- Industry Association
- Paid Database
- Investor Presentations

Step 4 - Data Triangulation
Involves using different sources of information in order to increase the validity of a study
These sources are likely to be stakeholders in a program - participants, other researchers, program staff, other community members, and so on.
Then we put all data in single framework & apply various statistical tools to find out the dynamic on the market.
During the analysis stage, feedback from the stakeholder groups would be compared to determine areas of agreement as well as areas of divergence