

Key Insights
The global hydrazine market, valued at $543 million in 2024, is poised for substantial expansion. Projected at a CAGR of 6%, the market is expected to reach significant valuations by 2033. Key growth drivers encompass the escalating demand for hydrazine as an effective corrosion inhibitor in industrial settings, its indispensable role as a propellant and rocket fuel within the aerospace sector, and its expanding applications in pharmaceuticals and agrochemicals. The market is segmented by type, including Hydrazine Hydrate, Hydrazine Nitrate, Hydrazine Sulfate, and Others. Applications span corrosion inhibition, explosives, rocket fuel, medicinal ingredients, pesticide precursors, blowing agents, and more. Major end-user industries comprise pharmaceuticals, agrochemicals, and industrial sectors.
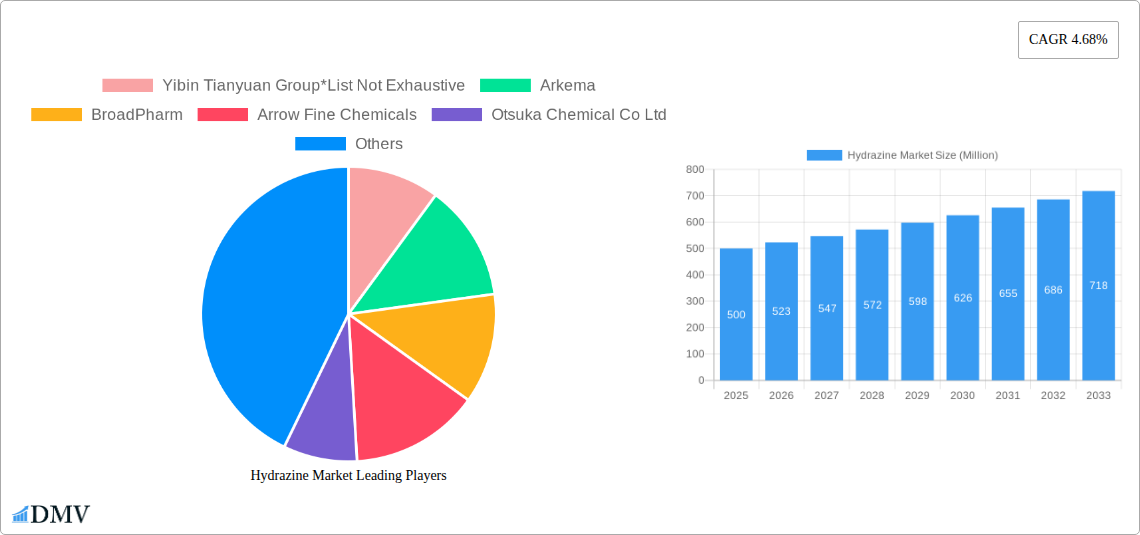
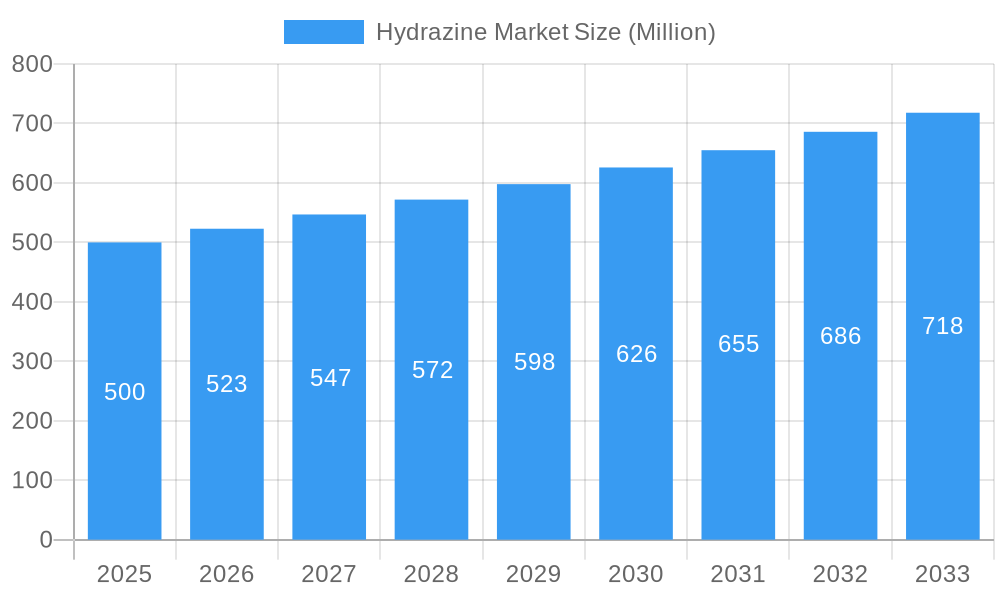
Hydrazine Market Market Size (In Million)
Geographically, the Asia Pacific region, led by China and India, currently dominates due to robust industrial growth and extensive manufacturing activities. North America and Europe are anticipated to experience notable expansion, driven by technological advancements and evolving environmental regulations. However, market growth may be moderated by stringent safety regulations concerning hydrazine's hazardous properties and the availability of viable alternative chemicals.
Hydrazine Market Company Market Share
The competitive landscape comprises established multinational corporations such as Arkema and LANXESS, alongside prominent regional players like Yibin Tianyuan Group and MERU CHEM PVT LTD. Strategic collaborations, innovative technological developments, and geographical market penetration are critical for competitive advantage. The future trajectory of the hydrazine market will be shaped by government policies, advancements in synthesis and handling technologies, and the emergence of sustainable alternatives. Fluctuations in raw material costs and broader economic conditions will also influence market performance. The forecast period presents considerable opportunities for market participants who can adeptly navigate this dynamic and specialized chemical sector.
Hydrazine Market: A Comprehensive Report (2019-2033)
This insightful report provides a detailed analysis of the Hydrazine Market, encompassing its current state, future projections, and key influencing factors. With a study period spanning from 2019 to 2033, a base year of 2025, and a forecast period from 2025 to 2033, this report offers invaluable data-driven insights for stakeholders across the value chain. The global Hydrazine Market is estimated to be valued at xx Million in 2025 and is projected to reach xx Million by 2033. This report covers key segments including Hydrazine Hydrate, Hydrazine Nitrate, Hydrazine Sulfate, and other types, with applications spanning pharmaceuticals, agrochemicals, industrial uses, and more. Leading players like Yibin Tianyuan Group, Arkema, and Otsuka Chemical Co Ltd are analyzed, revealing competitive dynamics and market share distribution.
Hydrazine Market Composition & Trends
This section dissects the competitive landscape of the Hydrazine Market, evaluating its concentration, innovation drivers, regulatory frameworks, substitute product availability, end-user profiles, and merger & acquisition (M&A) activities. The market's concentration is analyzed through detailed market share distribution among key players, revealing a [Describe Market Concentration: e.g., fragmented or concentrated] market structure. Significant M&A activities are examined, including deal values and their impact on market consolidation. The report identifies key innovation drivers such as [Mention key innovation drivers, e.g., advancements in synthesis techniques, development of new applications]. Regulatory landscapes across different geographies are evaluated, highlighting their influence on market growth. The availability and impact of substitute products are also assessed. Finally, end-user profiles are examined to understand consumption patterns and market demands across different sectors.
- Market Share Distribution: Yibin Tianyuan Group holds an estimated xx% market share, followed by Arkema at xx% and Otsuka Chemical Co Ltd at xx%. Other players contribute to the remaining xx%.
- M&A Activity: A total of xx M&A deals with an aggregate value of xx Million were recorded between 2019 and 2024, predominantly focused on [Mention the focus area of M&A activities, e.g., expansion into new markets, technological acquisitions].
Hydrazine Market Industry Evolution
The Hydrazine Market has undergone a significant evolutionary journey from 2019 to 2024, characterized by robust growth, substantial technological advancements, and a discernible shift in consumer preferences. During this historical period, the market is estimated to have expanded at a Compound Annual Growth Rate (CAGR) of approximately **6.5% to 7.5%**. This upward trajectory has been primarily fueled by the burgeoning demand from the pharmaceutical sector for its critical role in synthesizing various active pharmaceutical ingredients (APIs) and advanced drug intermediates. Furthermore, the expanding applications of hydrazine derivatives in the agrochemical industry, particularly in the development of novel pesticides and herbicides, have contributed significantly to market expansion. Technological breakthroughs, especially in the optimization of hydrazine synthesis methods like the Raschig process and the peroxide process, along with advancements in purification techniques, have led to enhanced production efficiency, improved product purity, and reduced environmental impact. Concurrently, a growing global emphasis on sustainability and eco-friendly products has propelled innovations in greener hydrazine production processes and the exploration of bio-based alternatives. Looking ahead, the forecast period from 2025 to 2033 is poised for continued, strong growth. This expansion is anticipated to be driven by the rising global demand for specialized hydrazine derivatives with tailored properties for advanced applications in aerospace, energy storage, and high-performance polymers, alongside the expansion of its usage in emerging markets undergoing rapid industrialization.
Leading Regions, Countries, or Segments in Hydrazine Market
This section meticulously identifies the preeminent regions, countries, and market segments within the global Hydrazine Market, analyzing their dominance based on product type, application, and end-user industry. A thorough examination highlights the key factors underpinning their leading positions and the primary drivers of their market influence.
Dominant Regions/Countries: Asia Pacific currently commands the largest market share, driven by its extensive manufacturing base in China and India, which are significant producers and consumers of hydrazine for pharmaceuticals and agrochemicals. North America also holds a substantial market share, propelled by strong and consistent demand from its well-established pharmaceutical and industrial sectors. This dominance is further supported by favorable regulatory frameworks and significant investments in research and development activities. Europe follows closely, with a robust chemical industry and a growing focus on specialized applications, including water treatment and polymerization inhibitors.
Dominant Segments:
By Type: Hydrazine Hydrate remains the dominant product type, owing to its inherent versatility, cost-effectiveness, and widespread use across numerous industrial and chemical applications. Anhydrous Hydrazine, while less voluminous, holds significant importance in specialized high-tech applications.
By Application: The pharmaceutical sector continues to exhibit the highest growth trajectory. This surge is directly attributable to the increasing global demand for life-saving drugs and the constant need for new drug discovery and development, where hydrazine and its derivatives are indispensable building blocks for synthesizing complex APIs.
By End-user Industry: The pharmaceutical industry stands as the largest consumer of hydrazine, followed by the agrochemical sector, which utilizes it extensively for crop protection products. The industrial sector, encompassing applications like water treatment and blowing agents, also represents a significant demand driver.
Key Drivers:
- Pharmaceutical: The escalating global healthcare expenditure, coupled with continuous investment in drug discovery and development pipelines, fuels the demand for high-purity hydrazine. Stringent regulatory approvals for novel drug formulations further necessitate the use of reliable and high-quality hydrazine as a key intermediate.
- Agrochemicals: The imperative for enhanced food security, driven by a growing global population, stimulates the demand for advanced and effective agrochemical solutions. Hydrazine's role in developing next-generation pesticides and herbicides to improve crop yields and protect against diseases is a critical growth factor.
- Industrial Applications: Growing demand for efficient water treatment solutions to mitigate pollution and conserve water resources, alongside its use as a blowing agent in the manufacturing of polymers and plastics, contributes to steady market growth.
Hydrazine Market Product Innovations
Recent innovations in the Hydrazine market include the development of [Mention specific product innovations, e.g., high-purity Hydrazine derivatives, improved synthesis processes]. These innovations improve the efficiency and efficacy of existing applications, expanding the market reach into new sectors like [Mention new sectors if any]. These new products exhibit enhanced [Mention specific benefits like purity, stability, safety]. Technological advancements leading to these innovations include [Mention advancements, e.g., novel catalysts, advanced purification techniques].
Propelling Factors for Hydrazine Market Growth
Several factors drive the Hydrazine Market's expansion. Technological advancements in synthesis and purification contribute to higher efficiency and cost reduction. Furthermore, the expanding pharmaceutical and agrochemical industries fuel strong demand. Favorable government regulations and incentives in some regions also promote market growth. For example, government initiatives to enhance agricultural productivity or support pharmaceutical research significantly impact Hydrazine demand.
Obstacles in the Hydrazine Market
Challenges in the Hydrazine Market include stringent safety regulations due to its hazardous nature. Supply chain disruptions can impact production and availability. Intense competition among established players and the emergence of new entrants create pressure on margins and market share. These factors can lead to price fluctuations and hinder market growth.
Future Opportunities in Hydrazine Market
The Hydrazine Market is brimming with emerging opportunities, particularly in the development of novel, high-performance hydrazine-based products tailored for niche and specialized applications. The growing global emphasis on environmental sustainability presents a significant opportunity for innovations in greener and more efficient hydrazine production methods, including exploring bio-based synthesis routes and developing advanced recycling techniques to mitigate environmental concerns. Furthermore, the untapped potential of emerging markets in Asia, Africa, and Latin America, characterized by rapidly industrializing economies and increasing investments in their chemical and pharmaceutical sectors, offers substantial avenues for market expansion and increased demand for hydrazine and its derivatives.
Major Players in the Hydrazine Market Ecosystem
- Yibin Tianyuan Group
- Arkema
- BroadPharm
- Arrow Fine Chemicals
- Otsuka Chemical Co Ltd
- Tokyo Chemical Industry Co Ltd
- NIPPON CARBIDE INDUSTRIES CO INC
- LANXESS
- Innova Corporate
- ACURO ORGANICS LIMITED
- MERU CHEM PVT LTD
- Shandong Xinhua Pharmaceutical Co., Ltd.
- Chemours Company
Key Developments in Hydrazine Market Industry
- March 2023: Otsuka Chemical Co., Ltd. and Yokogawa Electric Corporation established SynCrest Inc., a CRDMO, boosting pharmaceutical Hydrazine demand.
- May 2023: SynCrest Inc. announced its services globally, further fueling the demand for Hydrazine in pharmaceutical manufacturing.
Strategic Hydrazine Market Forecast
The Hydrazine Market is poised for sustained growth driven by the increasing demand from key sectors like pharmaceuticals and agrochemicals. Continued technological advancements in synthesis and purification will enhance product quality and efficiency. Expansion into new applications and emerging markets will further drive market expansion in the coming years, promising significant market potential.
Hydrazine Market Segmentation
-
1. Type
- 1.1. Hydrazine Hydrate
- 1.2. Hydrazine Nitrate
- 1.3. Hydrazine Sulfate
- 1.4. Other Types (Hydrazine Carbonate, etc.)
-
2. Application
- 2.1. Corrosion Inhibitor
- 2.2. Explosives
- 2.3. Rocket Fuel
- 2.4. Medicinal Ingredients
- 2.5. Precursor to Pesticides
- 2.6. Blowing Agent
- 2.7. Other Ap
-
3. End-user Industry
- 3.1. Pharmaceuticals
- 3.2. Agrochemicals
- 3.3. Industrial
- 3.4. Other End-user Industries (Water Treatment, etc.)
Hydrazine Market Segmentation By Geography
-
1. Asia Pacific
- 1.1. China
- 1.2. India
- 1.3. Japan
- 1.4. South Korea
- 1.5. Rest of Asia Pacific
-
2. North America
- 2.1. United States
- 2.2. Canada
- 2.3. Mexico
-
3. Europe
- 3.1. Germany
- 3.2. United Kingdom
- 3.3. Italy
- 3.4. France
- 3.5. Rest of Europe
-
4. South America
- 4.1. Brazil
- 4.2. Argentina
- 4.3. Rest of South America
-
5. Middle East and Africa
- 5.1. Saudi Arabia
- 5.2. South Africa
- 5.3. Rest of Middle East and Africa
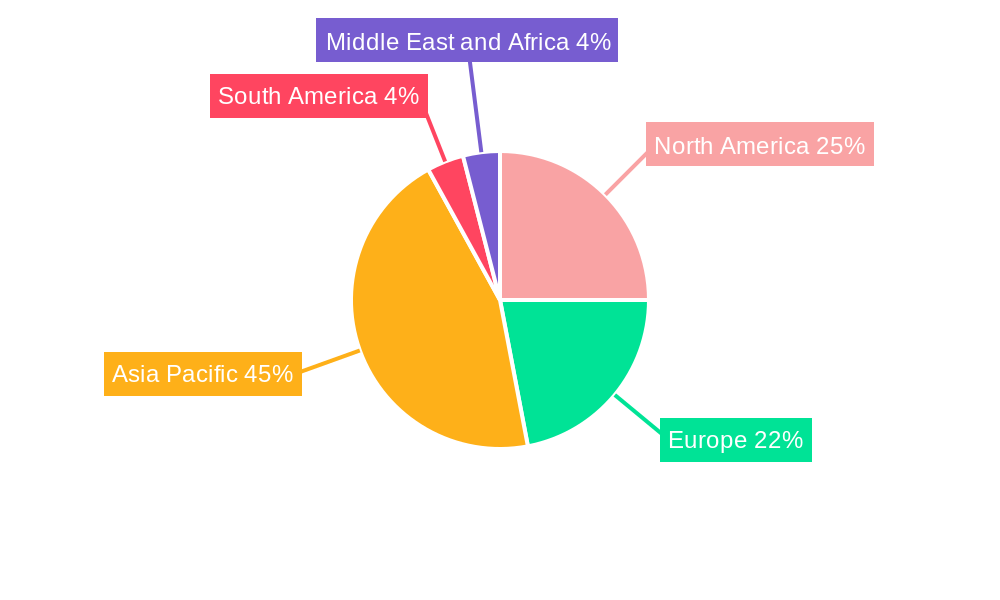
Hydrazine Market Regional Market Share
Geographic Coverage of Hydrazine Market
Hydrazine Market REPORT HIGHLIGHTS
| Aspects | Details |
|---|---|
| Study Period | 2020-2034 |
| Base Year | 2025 |
| Estimated Year | 2026 |
| Forecast Period | 2026-2034 |
| Historical Period | 2020-2025 |
| Growth Rate | CAGR of 6% from 2020-2034 |
| Segmentation |
|
Table of Contents
- 1. Introduction
- 1.1. Research Scope
- 1.2. Market Segmentation
- 1.3. Research Objective
- 1.4. Definitions and Assumptions
- 2. Executive Summary
- 2.1. Market Snapshot
- 3. Market Dynamics
- 3.1. Market Drivers
- 3.2. Market Restrains
- 3.3. Market Trends
- 3.4. Market Opportunities
- 4. Market Factor Analysis
- 4.1. Porters Five Forces
- 4.1.1. Bargaining Power of Suppliers
- 4.1.2. Bargaining Power of Buyers
- 4.1.3. Threat of New Entrants
- 4.1.4. Threat of Substitutes
- 4.1.5. Competitive Rivalry
- 4.2. PESTEL analysis
- 4.3. BCG Analysis
- 4.3.1. Stars (High Growth, High Market Share)
- 4.3.2. Cash Cows (Low Growth, High Market Share)
- 4.3.3. Question Mark (High Growth, Low Market Share)
- 4.3.4. Dogs (Low Growth, Low Market Share)
- 4.4. Ansoff Matrix Analysis
- 4.5. Supply Chain Analysis
- 4.6. Regulatory Landscape
- 4.7. Current Market Potential and Opportunity Assessment (TAM–SAM–SOM Framework)
- 4.8. DMV Analyst Note
- 4.1. Porters Five Forces
- 5. Market Analysis, Insights and Forecast 2021-2033
- 5.1. Market Analysis, Insights and Forecast - by Type
- 5.1.1. Hydrazine Hydrate
- 5.1.2. Hydrazine Nitrate
- 5.1.3. Hydrazine Sulfate
- 5.1.4. Other Types (Hydrazine Carbonate, etc.)
- 5.2. Market Analysis, Insights and Forecast - by Application
- 5.2.1. Corrosion Inhibitor
- 5.2.2. Explosives
- 5.2.3. Rocket Fuel
- 5.2.4. Medicinal Ingredients
- 5.2.5. Precursor to Pesticides
- 5.2.6. Blowing Agent
- 5.2.7. Other Ap
- 5.3. Market Analysis, Insights and Forecast - by End-user Industry
- 5.3.1. Pharmaceuticals
- 5.3.2. Agrochemicals
- 5.3.3. Industrial
- 5.3.4. Other End-user Industries (Water Treatment, etc.)
- 5.4. Market Analysis, Insights and Forecast - by Region
- 5.4.1. Asia Pacific
- 5.4.2. North America
- 5.4.3. Europe
- 5.4.4. South America
- 5.4.5. Middle East and Africa
- 5.1. Market Analysis, Insights and Forecast - by Type
- 6. Global Hydrazine Market Analysis, Insights and Forecast, 2021-2033
- 6.1. Market Analysis, Insights and Forecast - by Type
- 6.1.1. Hydrazine Hydrate
- 6.1.2. Hydrazine Nitrate
- 6.1.3. Hydrazine Sulfate
- 6.1.4. Other Types (Hydrazine Carbonate, etc.)
- 6.2. Market Analysis, Insights and Forecast - by Application
- 6.2.1. Corrosion Inhibitor
- 6.2.2. Explosives
- 6.2.3. Rocket Fuel
- 6.2.4. Medicinal Ingredients
- 6.2.5. Precursor to Pesticides
- 6.2.6. Blowing Agent
- 6.2.7. Other Ap
- 6.3. Market Analysis, Insights and Forecast - by End-user Industry
- 6.3.1. Pharmaceuticals
- 6.3.2. Agrochemicals
- 6.3.3. Industrial
- 6.3.4. Other End-user Industries (Water Treatment, etc.)
- 6.1. Market Analysis, Insights and Forecast - by Type
- 7. Asia Pacific Hydrazine Market Analysis, Insights and Forecast, 2020-2032
- 7.1. Market Analysis, Insights and Forecast - by Type
- 7.1.1. Hydrazine Hydrate
- 7.1.2. Hydrazine Nitrate
- 7.1.3. Hydrazine Sulfate
- 7.1.4. Other Types (Hydrazine Carbonate, etc.)
- 7.2. Market Analysis, Insights and Forecast - by Application
- 7.2.1. Corrosion Inhibitor
- 7.2.2. Explosives
- 7.2.3. Rocket Fuel
- 7.2.4. Medicinal Ingredients
- 7.2.5. Precursor to Pesticides
- 7.2.6. Blowing Agent
- 7.2.7. Other Ap
- 7.3. Market Analysis, Insights and Forecast - by End-user Industry
- 7.3.1. Pharmaceuticals
- 7.3.2. Agrochemicals
- 7.3.3. Industrial
- 7.3.4. Other End-user Industries (Water Treatment, etc.)
- 7.1. Market Analysis, Insights and Forecast - by Type
- 8. North America Hydrazine Market Analysis, Insights and Forecast, 2020-2032
- 8.1. Market Analysis, Insights and Forecast - by Type
- 8.1.1. Hydrazine Hydrate
- 8.1.2. Hydrazine Nitrate
- 8.1.3. Hydrazine Sulfate
- 8.1.4. Other Types (Hydrazine Carbonate, etc.)
- 8.2. Market Analysis, Insights and Forecast - by Application
- 8.2.1. Corrosion Inhibitor
- 8.2.2. Explosives
- 8.2.3. Rocket Fuel
- 8.2.4. Medicinal Ingredients
- 8.2.5. Precursor to Pesticides
- 8.2.6. Blowing Agent
- 8.2.7. Other Ap
- 8.3. Market Analysis, Insights and Forecast - by End-user Industry
- 8.3.1. Pharmaceuticals
- 8.3.2. Agrochemicals
- 8.3.3. Industrial
- 8.3.4. Other End-user Industries (Water Treatment, etc.)
- 8.1. Market Analysis, Insights and Forecast - by Type
- 9. Europe Hydrazine Market Analysis, Insights and Forecast, 2020-2032
- 9.1. Market Analysis, Insights and Forecast - by Type
- 9.1.1. Hydrazine Hydrate
- 9.1.2. Hydrazine Nitrate
- 9.1.3. Hydrazine Sulfate
- 9.1.4. Other Types (Hydrazine Carbonate, etc.)
- 9.2. Market Analysis, Insights and Forecast - by Application
- 9.2.1. Corrosion Inhibitor
- 9.2.2. Explosives
- 9.2.3. Rocket Fuel
- 9.2.4. Medicinal Ingredients
- 9.2.5. Precursor to Pesticides
- 9.2.6. Blowing Agent
- 9.2.7. Other Ap
- 9.3. Market Analysis, Insights and Forecast - by End-user Industry
- 9.3.1. Pharmaceuticals
- 9.3.2. Agrochemicals
- 9.3.3. Industrial
- 9.3.4. Other End-user Industries (Water Treatment, etc.)
- 9.1. Market Analysis, Insights and Forecast - by Type
- 10. South America Hydrazine Market Analysis, Insights and Forecast, 2020-2032
- 10.1. Market Analysis, Insights and Forecast - by Type
- 10.1.1. Hydrazine Hydrate
- 10.1.2. Hydrazine Nitrate
- 10.1.3. Hydrazine Sulfate
- 10.1.4. Other Types (Hydrazine Carbonate, etc.)
- 10.2. Market Analysis, Insights and Forecast - by Application
- 10.2.1. Corrosion Inhibitor
- 10.2.2. Explosives
- 10.2.3. Rocket Fuel
- 10.2.4. Medicinal Ingredients
- 10.2.5. Precursor to Pesticides
- 10.2.6. Blowing Agent
- 10.2.7. Other Ap
- 10.3. Market Analysis, Insights and Forecast - by End-user Industry
- 10.3.1. Pharmaceuticals
- 10.3.2. Agrochemicals
- 10.3.3. Industrial
- 10.3.4. Other End-user Industries (Water Treatment, etc.)
- 10.1. Market Analysis, Insights and Forecast - by Type
- 11. Middle East and Africa Hydrazine Market Analysis, Insights and Forecast, 2020-2032
- 11.1. Market Analysis, Insights and Forecast - by Type
- 11.1.1. Hydrazine Hydrate
- 11.1.2. Hydrazine Nitrate
- 11.1.3. Hydrazine Sulfate
- 11.1.4. Other Types (Hydrazine Carbonate, etc.)
- 11.2. Market Analysis, Insights and Forecast - by Application
- 11.2.1. Corrosion Inhibitor
- 11.2.2. Explosives
- 11.2.3. Rocket Fuel
- 11.2.4. Medicinal Ingredients
- 11.2.5. Precursor to Pesticides
- 11.2.6. Blowing Agent
- 11.2.7. Other Ap
- 11.3. Market Analysis, Insights and Forecast - by End-user Industry
- 11.3.1. Pharmaceuticals
- 11.3.2. Agrochemicals
- 11.3.3. Industrial
- 11.3.4. Other End-user Industries (Water Treatment, etc.)
- 11.1. Market Analysis, Insights and Forecast - by Type
- 12. Competitive Analysis
- 12.1. Company Profiles
- 12.1.1 Yibin Tianyuan Group*List Not Exhaustive
- 12.1.1.1. Company Overview
- 12.1.1.2. Products
- 12.1.1.3. Company Financials
- 12.1.1.4. SWOT Analysis
- 12.1.2 Arkema
- 12.1.2.1. Company Overview
- 12.1.2.2. Products
- 12.1.2.3. Company Financials
- 12.1.2.4. SWOT Analysis
- 12.1.3 BroadPharm
- 12.1.3.1. Company Overview
- 12.1.3.2. Products
- 12.1.3.3. Company Financials
- 12.1.3.4. SWOT Analysis
- 12.1.4 Arrow Fine Chemicals
- 12.1.4.1. Company Overview
- 12.1.4.2. Products
- 12.1.4.3. Company Financials
- 12.1.4.4. SWOT Analysis
- 12.1.5 Otsuka Chemical Co Ltd
- 12.1.5.1. Company Overview
- 12.1.5.2. Products
- 12.1.5.3. Company Financials
- 12.1.5.4. SWOT Analysis
- 12.1.6 Tokyo Chemical Industry Co Ltd
- 12.1.6.1. Company Overview
- 12.1.6.2. Products
- 12.1.6.3. Company Financials
- 12.1.6.4. SWOT Analysis
- 12.1.7 NIPPON CARBIDE INDUSTRIES CO INC
- 12.1.7.1. Company Overview
- 12.1.7.2. Products
- 12.1.7.3. Company Financials
- 12.1.7.4. SWOT Analysis
- 12.1.8 LANXESS
- 12.1.8.1. Company Overview
- 12.1.8.2. Products
- 12.1.8.3. Company Financials
- 12.1.8.4. SWOT Analysis
- 12.1.9 Innova Corporate
- 12.1.9.1. Company Overview
- 12.1.9.2. Products
- 12.1.9.3. Company Financials
- 12.1.9.4. SWOT Analysis
- 12.1.10 ACURO ORGANICS LIMITED
- 12.1.10.1. Company Overview
- 12.1.10.2. Products
- 12.1.10.3. Company Financials
- 12.1.10.4. SWOT Analysis
- 12.1.11 MERU CHEM PVT LTD
- 12.1.11.1. Company Overview
- 12.1.11.2. Products
- 12.1.11.3. Company Financials
- 12.1.11.4. SWOT Analysis
- 12.1.1 Yibin Tianyuan Group*List Not Exhaustive
- 12.2. Market Entropy
- 12.2.1 Company's Key Areas Served
- 12.2.2 Recent Developments
- 12.3. Company Market Share Analysis 2025
- 12.3.1 Top 5 Companies Market Share Analysis
- 12.3.2 Top 3 Companies Market Share Analysis
- 12.4. List of Potential Customers
- 13. Research Methodology
List of Figures
- Figure 1: Global Hydrazine Market Revenue Breakdown (million, %) by Region 2025 & 2033
- Figure 2: Global Hydrazine Market Volume Breakdown (kilotons, %) by Region 2025 & 2033
- Figure 3: Asia Pacific Hydrazine Market Revenue (million), by Type 2025 & 2033
- Figure 4: Asia Pacific Hydrazine Market Volume (kilotons), by Type 2025 & 2033
- Figure 5: Asia Pacific Hydrazine Market Revenue Share (%), by Type 2025 & 2033
- Figure 6: Asia Pacific Hydrazine Market Volume Share (%), by Type 2025 & 2033
- Figure 7: Asia Pacific Hydrazine Market Revenue (million), by Application 2025 & 2033
- Figure 8: Asia Pacific Hydrazine Market Volume (kilotons), by Application 2025 & 2033
- Figure 9: Asia Pacific Hydrazine Market Revenue Share (%), by Application 2025 & 2033
- Figure 10: Asia Pacific Hydrazine Market Volume Share (%), by Application 2025 & 2033
- Figure 11: Asia Pacific Hydrazine Market Revenue (million), by End-user Industry 2025 & 2033
- Figure 12: Asia Pacific Hydrazine Market Volume (kilotons), by End-user Industry 2025 & 2033
- Figure 13: Asia Pacific Hydrazine Market Revenue Share (%), by End-user Industry 2025 & 2033
- Figure 14: Asia Pacific Hydrazine Market Volume Share (%), by End-user Industry 2025 & 2033
- Figure 15: Asia Pacific Hydrazine Market Revenue (million), by Country 2025 & 2033
- Figure 16: Asia Pacific Hydrazine Market Volume (kilotons), by Country 2025 & 2033
- Figure 17: Asia Pacific Hydrazine Market Revenue Share (%), by Country 2025 & 2033
- Figure 18: Asia Pacific Hydrazine Market Volume Share (%), by Country 2025 & 2033
- Figure 19: North America Hydrazine Market Revenue (million), by Type 2025 & 2033
- Figure 20: North America Hydrazine Market Volume (kilotons), by Type 2025 & 2033
- Figure 21: North America Hydrazine Market Revenue Share (%), by Type 2025 & 2033
- Figure 22: North America Hydrazine Market Volume Share (%), by Type 2025 & 2033
- Figure 23: North America Hydrazine Market Revenue (million), by Application 2025 & 2033
- Figure 24: North America Hydrazine Market Volume (kilotons), by Application 2025 & 2033
- Figure 25: North America Hydrazine Market Revenue Share (%), by Application 2025 & 2033
- Figure 26: North America Hydrazine Market Volume Share (%), by Application 2025 & 2033
- Figure 27: North America Hydrazine Market Revenue (million), by End-user Industry 2025 & 2033
- Figure 28: North America Hydrazine Market Volume (kilotons), by End-user Industry 2025 & 2033
- Figure 29: North America Hydrazine Market Revenue Share (%), by End-user Industry 2025 & 2033
- Figure 30: North America Hydrazine Market Volume Share (%), by End-user Industry 2025 & 2033
- Figure 31: North America Hydrazine Market Revenue (million), by Country 2025 & 2033
- Figure 32: North America Hydrazine Market Volume (kilotons), by Country 2025 & 2033
- Figure 33: North America Hydrazine Market Revenue Share (%), by Country 2025 & 2033
- Figure 34: North America Hydrazine Market Volume Share (%), by Country 2025 & 2033
- Figure 35: Europe Hydrazine Market Revenue (million), by Type 2025 & 2033
- Figure 36: Europe Hydrazine Market Volume (kilotons), by Type 2025 & 2033
- Figure 37: Europe Hydrazine Market Revenue Share (%), by Type 2025 & 2033
- Figure 38: Europe Hydrazine Market Volume Share (%), by Type 2025 & 2033
- Figure 39: Europe Hydrazine Market Revenue (million), by Application 2025 & 2033
- Figure 40: Europe Hydrazine Market Volume (kilotons), by Application 2025 & 2033
- Figure 41: Europe Hydrazine Market Revenue Share (%), by Application 2025 & 2033
- Figure 42: Europe Hydrazine Market Volume Share (%), by Application 2025 & 2033
- Figure 43: Europe Hydrazine Market Revenue (million), by End-user Industry 2025 & 2033
- Figure 44: Europe Hydrazine Market Volume (kilotons), by End-user Industry 2025 & 2033
- Figure 45: Europe Hydrazine Market Revenue Share (%), by End-user Industry 2025 & 2033
- Figure 46: Europe Hydrazine Market Volume Share (%), by End-user Industry 2025 & 2033
- Figure 47: Europe Hydrazine Market Revenue (million), by Country 2025 & 2033
- Figure 48: Europe Hydrazine Market Volume (kilotons), by Country 2025 & 2033
- Figure 49: Europe Hydrazine Market Revenue Share (%), by Country 2025 & 2033
- Figure 50: Europe Hydrazine Market Volume Share (%), by Country 2025 & 2033
- Figure 51: South America Hydrazine Market Revenue (million), by Type 2025 & 2033
- Figure 52: South America Hydrazine Market Volume (kilotons), by Type 2025 & 2033
- Figure 53: South America Hydrazine Market Revenue Share (%), by Type 2025 & 2033
- Figure 54: South America Hydrazine Market Volume Share (%), by Type 2025 & 2033
- Figure 55: South America Hydrazine Market Revenue (million), by Application 2025 & 2033
- Figure 56: South America Hydrazine Market Volume (kilotons), by Application 2025 & 2033
- Figure 57: South America Hydrazine Market Revenue Share (%), by Application 2025 & 2033
- Figure 58: South America Hydrazine Market Volume Share (%), by Application 2025 & 2033
- Figure 59: South America Hydrazine Market Revenue (million), by End-user Industry 2025 & 2033
- Figure 60: South America Hydrazine Market Volume (kilotons), by End-user Industry 2025 & 2033
- Figure 61: South America Hydrazine Market Revenue Share (%), by End-user Industry 2025 & 2033
- Figure 62: South America Hydrazine Market Volume Share (%), by End-user Industry 2025 & 2033
- Figure 63: South America Hydrazine Market Revenue (million), by Country 2025 & 2033
- Figure 64: South America Hydrazine Market Volume (kilotons), by Country 2025 & 2033
- Figure 65: South America Hydrazine Market Revenue Share (%), by Country 2025 & 2033
- Figure 66: South America Hydrazine Market Volume Share (%), by Country 2025 & 2033
- Figure 67: Middle East and Africa Hydrazine Market Revenue (million), by Type 2025 & 2033
- Figure 68: Middle East and Africa Hydrazine Market Volume (kilotons), by Type 2025 & 2033
- Figure 69: Middle East and Africa Hydrazine Market Revenue Share (%), by Type 2025 & 2033
- Figure 70: Middle East and Africa Hydrazine Market Volume Share (%), by Type 2025 & 2033
- Figure 71: Middle East and Africa Hydrazine Market Revenue (million), by Application 2025 & 2033
- Figure 72: Middle East and Africa Hydrazine Market Volume (kilotons), by Application 2025 & 2033
- Figure 73: Middle East and Africa Hydrazine Market Revenue Share (%), by Application 2025 & 2033
- Figure 74: Middle East and Africa Hydrazine Market Volume Share (%), by Application 2025 & 2033
- Figure 75: Middle East and Africa Hydrazine Market Revenue (million), by End-user Industry 2025 & 2033
- Figure 76: Middle East and Africa Hydrazine Market Volume (kilotons), by End-user Industry 2025 & 2033
- Figure 77: Middle East and Africa Hydrazine Market Revenue Share (%), by End-user Industry 2025 & 2033
- Figure 78: Middle East and Africa Hydrazine Market Volume Share (%), by End-user Industry 2025 & 2033
- Figure 79: Middle East and Africa Hydrazine Market Revenue (million), by Country 2025 & 2033
- Figure 80: Middle East and Africa Hydrazine Market Volume (kilotons), by Country 2025 & 2033
- Figure 81: Middle East and Africa Hydrazine Market Revenue Share (%), by Country 2025 & 2033
- Figure 82: Middle East and Africa Hydrazine Market Volume Share (%), by Country 2025 & 2033
List of Tables
- Table 1: Global Hydrazine Market Revenue million Forecast, by Type 2020 & 2033
- Table 2: Global Hydrazine Market Volume kilotons Forecast, by Type 2020 & 2033
- Table 3: Global Hydrazine Market Revenue million Forecast, by Application 2020 & 2033
- Table 4: Global Hydrazine Market Volume kilotons Forecast, by Application 2020 & 2033
- Table 5: Global Hydrazine Market Revenue million Forecast, by End-user Industry 2020 & 2033
- Table 6: Global Hydrazine Market Volume kilotons Forecast, by End-user Industry 2020 & 2033
- Table 7: Global Hydrazine Market Revenue million Forecast, by Region 2020 & 2033
- Table 8: Global Hydrazine Market Volume kilotons Forecast, by Region 2020 & 2033
- Table 9: Global Hydrazine Market Revenue million Forecast, by Type 2020 & 2033
- Table 10: Global Hydrazine Market Volume kilotons Forecast, by Type 2020 & 2033
- Table 11: Global Hydrazine Market Revenue million Forecast, by Application 2020 & 2033
- Table 12: Global Hydrazine Market Volume kilotons Forecast, by Application 2020 & 2033
- Table 13: Global Hydrazine Market Revenue million Forecast, by End-user Industry 2020 & 2033
- Table 14: Global Hydrazine Market Volume kilotons Forecast, by End-user Industry 2020 & 2033
- Table 15: Global Hydrazine Market Revenue million Forecast, by Country 2020 & 2033
- Table 16: Global Hydrazine Market Volume kilotons Forecast, by Country 2020 & 2033
- Table 17: China Hydrazine Market Revenue (million) Forecast, by Application 2020 & 2033
- Table 18: China Hydrazine Market Volume (kilotons) Forecast, by Application 2020 & 2033
- Table 19: India Hydrazine Market Revenue (million) Forecast, by Application 2020 & 2033
- Table 20: India Hydrazine Market Volume (kilotons) Forecast, by Application 2020 & 2033
- Table 21: Japan Hydrazine Market Revenue (million) Forecast, by Application 2020 & 2033
- Table 22: Japan Hydrazine Market Volume (kilotons) Forecast, by Application 2020 & 2033
- Table 23: South Korea Hydrazine Market Revenue (million) Forecast, by Application 2020 & 2033
- Table 24: South Korea Hydrazine Market Volume (kilotons) Forecast, by Application 2020 & 2033
- Table 25: Rest of Asia Pacific Hydrazine Market Revenue (million) Forecast, by Application 2020 & 2033
- Table 26: Rest of Asia Pacific Hydrazine Market Volume (kilotons) Forecast, by Application 2020 & 2033
- Table 27: Global Hydrazine Market Revenue million Forecast, by Type 2020 & 2033
- Table 28: Global Hydrazine Market Volume kilotons Forecast, by Type 2020 & 2033
- Table 29: Global Hydrazine Market Revenue million Forecast, by Application 2020 & 2033
- Table 30: Global Hydrazine Market Volume kilotons Forecast, by Application 2020 & 2033
- Table 31: Global Hydrazine Market Revenue million Forecast, by End-user Industry 2020 & 2033
- Table 32: Global Hydrazine Market Volume kilotons Forecast, by End-user Industry 2020 & 2033
- Table 33: Global Hydrazine Market Revenue million Forecast, by Country 2020 & 2033
- Table 34: Global Hydrazine Market Volume kilotons Forecast, by Country 2020 & 2033
- Table 35: United States Hydrazine Market Revenue (million) Forecast, by Application 2020 & 2033
- Table 36: United States Hydrazine Market Volume (kilotons) Forecast, by Application 2020 & 2033
- Table 37: Canada Hydrazine Market Revenue (million) Forecast, by Application 2020 & 2033
- Table 38: Canada Hydrazine Market Volume (kilotons) Forecast, by Application 2020 & 2033
- Table 39: Mexico Hydrazine Market Revenue (million) Forecast, by Application 2020 & 2033
- Table 40: Mexico Hydrazine Market Volume (kilotons) Forecast, by Application 2020 & 2033
- Table 41: Global Hydrazine Market Revenue million Forecast, by Type 2020 & 2033
- Table 42: Global Hydrazine Market Volume kilotons Forecast, by Type 2020 & 2033
- Table 43: Global Hydrazine Market Revenue million Forecast, by Application 2020 & 2033
- Table 44: Global Hydrazine Market Volume kilotons Forecast, by Application 2020 & 2033
- Table 45: Global Hydrazine Market Revenue million Forecast, by End-user Industry 2020 & 2033
- Table 46: Global Hydrazine Market Volume kilotons Forecast, by End-user Industry 2020 & 2033
- Table 47: Global Hydrazine Market Revenue million Forecast, by Country 2020 & 2033
- Table 48: Global Hydrazine Market Volume kilotons Forecast, by Country 2020 & 2033
- Table 49: Germany Hydrazine Market Revenue (million) Forecast, by Application 2020 & 2033
- Table 50: Germany Hydrazine Market Volume (kilotons) Forecast, by Application 2020 & 2033
- Table 51: United Kingdom Hydrazine Market Revenue (million) Forecast, by Application 2020 & 2033
- Table 52: United Kingdom Hydrazine Market Volume (kilotons) Forecast, by Application 2020 & 2033
- Table 53: Italy Hydrazine Market Revenue (million) Forecast, by Application 2020 & 2033
- Table 54: Italy Hydrazine Market Volume (kilotons) Forecast, by Application 2020 & 2033
- Table 55: France Hydrazine Market Revenue (million) Forecast, by Application 2020 & 2033
- Table 56: France Hydrazine Market Volume (kilotons) Forecast, by Application 2020 & 2033
- Table 57: Rest of Europe Hydrazine Market Revenue (million) Forecast, by Application 2020 & 2033
- Table 58: Rest of Europe Hydrazine Market Volume (kilotons) Forecast, by Application 2020 & 2033
- Table 59: Global Hydrazine Market Revenue million Forecast, by Type 2020 & 2033
- Table 60: Global Hydrazine Market Volume kilotons Forecast, by Type 2020 & 2033
- Table 61: Global Hydrazine Market Revenue million Forecast, by Application 2020 & 2033
- Table 62: Global Hydrazine Market Volume kilotons Forecast, by Application 2020 & 2033
- Table 63: Global Hydrazine Market Revenue million Forecast, by End-user Industry 2020 & 2033
- Table 64: Global Hydrazine Market Volume kilotons Forecast, by End-user Industry 2020 & 2033
- Table 65: Global Hydrazine Market Revenue million Forecast, by Country 2020 & 2033
- Table 66: Global Hydrazine Market Volume kilotons Forecast, by Country 2020 & 2033
- Table 67: Brazil Hydrazine Market Revenue (million) Forecast, by Application 2020 & 2033
- Table 68: Brazil Hydrazine Market Volume (kilotons) Forecast, by Application 2020 & 2033
- Table 69: Argentina Hydrazine Market Revenue (million) Forecast, by Application 2020 & 2033
- Table 70: Argentina Hydrazine Market Volume (kilotons) Forecast, by Application 2020 & 2033
- Table 71: Rest of South America Hydrazine Market Revenue (million) Forecast, by Application 2020 & 2033
- Table 72: Rest of South America Hydrazine Market Volume (kilotons) Forecast, by Application 2020 & 2033
- Table 73: Global Hydrazine Market Revenue million Forecast, by Type 2020 & 2033
- Table 74: Global Hydrazine Market Volume kilotons Forecast, by Type 2020 & 2033
- Table 75: Global Hydrazine Market Revenue million Forecast, by Application 2020 & 2033
- Table 76: Global Hydrazine Market Volume kilotons Forecast, by Application 2020 & 2033
- Table 77: Global Hydrazine Market Revenue million Forecast, by End-user Industry 2020 & 2033
- Table 78: Global Hydrazine Market Volume kilotons Forecast, by End-user Industry 2020 & 2033
- Table 79: Global Hydrazine Market Revenue million Forecast, by Country 2020 & 2033
- Table 80: Global Hydrazine Market Volume kilotons Forecast, by Country 2020 & 2033
- Table 81: Saudi Arabia Hydrazine Market Revenue (million) Forecast, by Application 2020 & 2033
- Table 82: Saudi Arabia Hydrazine Market Volume (kilotons) Forecast, by Application 2020 & 2033
- Table 83: South Africa Hydrazine Market Revenue (million) Forecast, by Application 2020 & 2033
- Table 84: South Africa Hydrazine Market Volume (kilotons) Forecast, by Application 2020 & 2033
- Table 85: Rest of Middle East and Africa Hydrazine Market Revenue (million) Forecast, by Application 2020 & 2033
- Table 86: Rest of Middle East and Africa Hydrazine Market Volume (kilotons) Forecast, by Application 2020 & 2033
Frequently Asked Questions
1. What is the projected Compound Annual Growth Rate (CAGR) of the Hydrazine Market?
The projected CAGR is approximately 6%.
2. Which companies are prominent players in the Hydrazine Market?
Key companies in the market include Yibin Tianyuan Group*List Not Exhaustive, Arkema, BroadPharm, Arrow Fine Chemicals, Otsuka Chemical Co Ltd, Tokyo Chemical Industry Co Ltd, NIPPON CARBIDE INDUSTRIES CO INC, LANXESS, Innova Corporate, ACURO ORGANICS LIMITED, MERU CHEM PVT LTD.
3. What are the main segments of the Hydrazine Market?
The market segments include Type, Application, End-user Industry.
4. Can you provide details about the market size?
The market size is estimated to be USD 543 million as of 2022.
5. What are some drivers contributing to market growth?
Increasing Demand from Agrochemicals; Growing Applications in Pharmaceutical Industry; Other Drivers.
6. What are the notable trends driving market growth?
Increasing Demand from Pharmaceutical Sector.
7. Are there any restraints impacting market growth?
Highly Toxic Nature of Hydrazine; Other Restraints.
8. Can you provide examples of recent developments in the market?
May 2023: SynCrest Inc., a peptide and nucleotide CRDMO (Contract Research, Development, and Manufacturing Organization), announced the availability of its services for pharmaceutical companies and research institutions in Japan, Europe, North America, and South America. (Hydrazine is used in the manufacturing of pharmaceutical drugs.)
9. What pricing options are available for accessing the report?
Pricing options include single-user, multi-user, and enterprise licenses priced at USD 4750, USD 5250, and USD 8750 respectively.
10. Is the market size provided in terms of value or volume?
The market size is provided in terms of value, measured in million and volume, measured in kilotons.
11. Are there any specific market keywords associated with the report?
Yes, the market keyword associated with the report is "Hydrazine Market," which aids in identifying and referencing the specific market segment covered.
12. How do I determine which pricing option suits my needs best?
The pricing options vary based on user requirements and access needs. Individual users may opt for single-user licenses, while businesses requiring broader access may choose multi-user or enterprise licenses for cost-effective access to the report.
13. Are there any additional resources or data provided in the Hydrazine Market report?
While the report offers comprehensive insights, it's advisable to review the specific contents or supplementary materials provided to ascertain if additional resources or data are available.
14. How can I stay updated on further developments or reports in the Hydrazine Market?
To stay informed about further developments, trends, and reports in the Hydrazine Market, consider subscribing to industry newsletters, following relevant companies and organizations, or regularly checking reputable industry news sources and publications.
Methodology
Step 1 - Identification of Relevant Samples Size from Population Database


Step 2 - Approaches for Defining Global Market Size (Value, Volume* & Price*)

Note*: In applicable scenarios
Step 3 - Data Sources
Primary Research
- Web Analytics
- Survey Reports
- Research Institute
- Latest Research Reports
- Opinion Leaders
Secondary Research
- Annual Reports
- White Paper
- Latest Press Release
- Industry Association
- Paid Database
- Investor Presentations

Step 4 - Data Triangulation
Involves using different sources of information in order to increase the validity of a study
These sources are likely to be stakeholders in a program - participants, other researchers, program staff, other community members, and so on.
Then we put all data in single framework & apply various statistical tools to find out the dynamic on the market.
During the analysis stage, feedback from the stakeholder groups would be compared to determine areas of agreement as well as areas of divergence