

Key Insights
The High-Purity Alumina (HPA) market is projected for substantial expansion, driven by escalating demand across key industries. With a Compound Annual Growth Rate (CAGR) of 20.62%, the market is anticipated to reach a size of 0.57 billion by 2025. This growth is primarily propelled by the robust expansion of the LED lighting sector and the increasing adoption of sapphire substrates in electronics and semiconductors. Innovations in HPA manufacturing are enhancing purity and efficiency, further stimulating market development. The market is segmented by application, including LED lighting, sapphire substrates, electronics, and refractories, with significant geographical variations influencing growth trajectories. A competitive landscape analysis reveals a dynamic environment with both established leaders and emerging innovators, indicating potential for strategic collaborations and market consolidation. Potential challenges may include raw material price volatility, adherence to environmental regulations, and supply chain resilience.
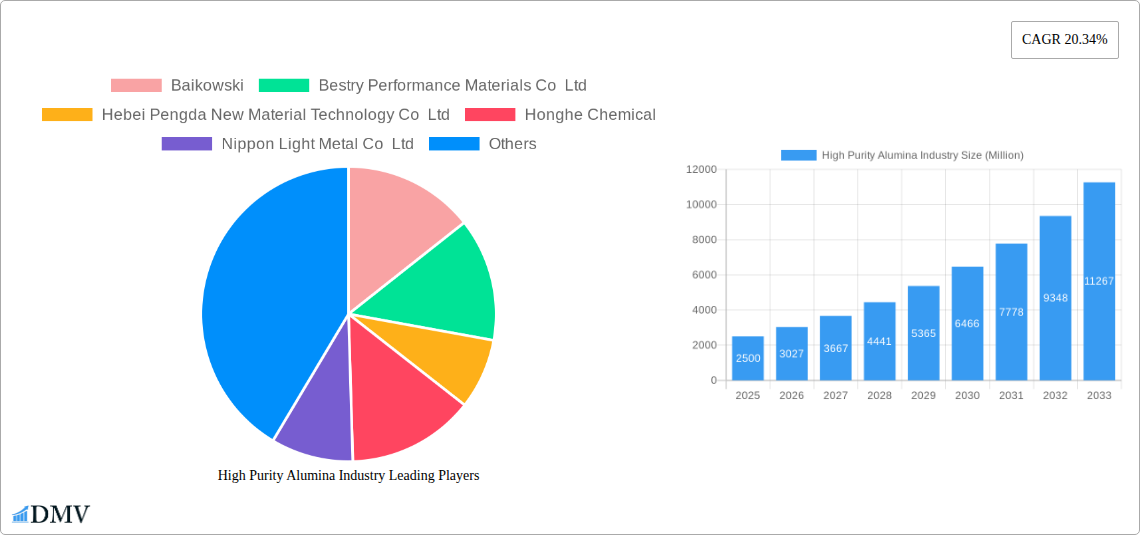
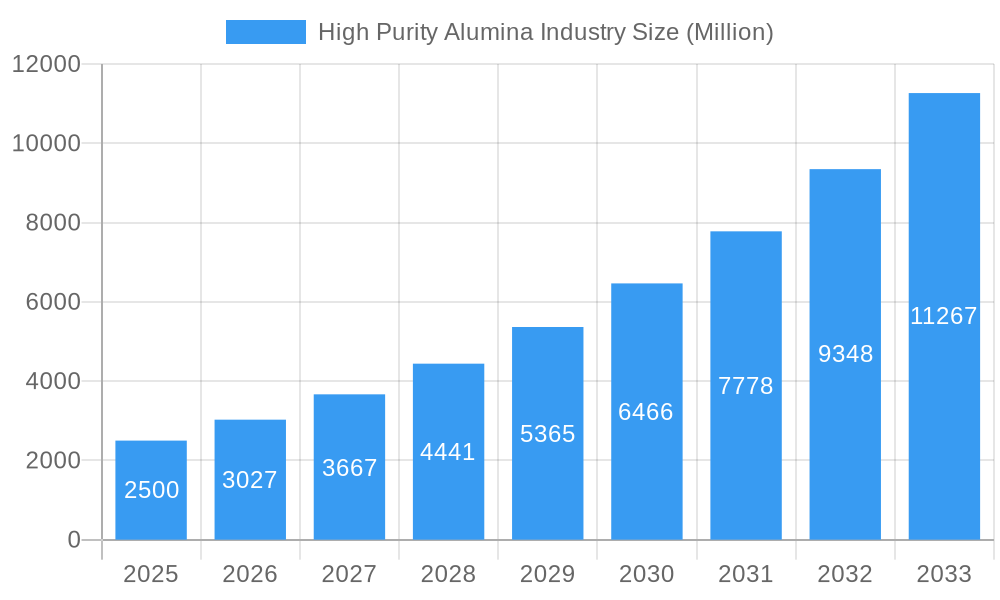
High Purity Alumina Industry Market Size (In Million)
The forecast period (2025-2033) signals sustained HPA market growth, supported by technological advancements and rising demand from high-growth sectors. Strategic investments in research and development are focused on optimizing production, improving product quality, and identifying novel applications. The global emphasis on energy efficiency and the rapid evolution of the electronics industry will act as key growth accelerators. Regional market dynamics will continue to diversify, influenced by government incentives, infrastructure development, and the presence of major industry players. A comprehensive understanding of these factors is crucial for businesses aiming to thrive in this competitive and evolving market. Detailed regional analysis, including country-specific market valuations, is recommended for granular insights.
High Purity Alumina Industry Company Market Share
High Purity Alumina Industry Market Report: 2019-2033
This comprehensive report provides an in-depth analysis of the High Purity Alumina industry, offering valuable insights for stakeholders seeking to navigate this dynamic market. Covering the period 2019-2033, with a focus on 2025, this report unveils market trends, technological advancements, and future opportunities within this multi-million dollar industry.
High Purity Alumina Industry Market Composition & Trends
The High Purity Alumina market, valued at xx Million in 2025, exhibits a moderately concentrated landscape. While a few major players like Sumitomo Chemical Co Ltd and Rusal hold significant market share, several regional and specialized companies contribute to the overall market dynamics. Innovation is driven by the demand for higher purity levels and specialized applications, especially within the electronics and energy sectors. Regulatory pressures, particularly concerning environmental impact and material sourcing, are increasingly influencing market operations. Substitute materials, such as other ceramic compounds, pose a competitive challenge, though the unique properties of high-purity alumina maintain its strong position in various applications. The end-user base spans diverse sectors including electronics, ceramics, refractories, and advanced materials. M&A activity has been moderate, with deal values averaging xx Million in recent years. Specific deals and their impact are detailed within the report.
- Market Share Distribution: Sumitomo Chemical Co Ltd (xx%), Rusal (xx%), Baikowski (xx%), Others (xx%)
- M&A Deal Values (2019-2024): Average xx Million per deal.
- Key Regulatory Factors: Environmental regulations related to alumina production and waste management.
High Purity Alumina Industry Industry Evolution
The High Purity Alumina industry has witnessed substantial growth over the past five years, with a Compound Annual Growth Rate (CAGR) of xx% between 2019 and 2024. Technological advancements, particularly in refining processes and the development of ultra-fine alumina powders, have fueled this expansion. Furthermore, increasing demand from emerging applications, such as high-performance lithium-ion batteries, have significantly impacted growth trajectories. The industry has also seen a notable shift toward sustainable and environmentally friendly production methods, aligning with global sustainability initiatives. The adoption rate of new technologies is relatively high, with around xx% of manufacturers implementing advanced processes in 2024. Future growth is projected to be driven by continued advancements in material science and the expanding applications of high-purity alumina in various high-tech industries. Market forecasts suggest a CAGR of xx% from 2025-2033, reaching a projected value of xx Million by 2033.
Leading Regions, Countries, or Segments in High Purity Alumina Industry
While the global nature of the market makes pinpointing a single dominant region challenging, Asia (specifically, China) currently holds a leading position driven by high domestic demand and substantial manufacturing capacity.
- Key Drivers for Asian Dominance:
- Significant investments in advanced materials manufacturing.
- Abundant aluminum resources and established processing infrastructure.
- Government support for the development of high-tech industries.
- Growing electronics and renewable energy sectors.
This dominance is further solidified by the strong presence of key manufacturers like Hebei Pengda New Material Technology Co Ltd and Shandong Keheng Crystal Material Technology Co Ltd. However, other regions such as North America and Europe continue to hold important market shares, fueled by robust technological advancements and specialized applications in sectors such as aerospace and defense.
High Purity Alumina Industry Product Innovations
Recent innovations have focused on developing ultra-fine α-alumina powders with superior properties and tailored characteristics. Sumitomo Chemical Co Ltd's new production technology, set to commence in September 2023, exemplifies this trend. These advancements lead to enhanced performance in applications requiring high strength, thermal conductivity, and dielectric properties. The unique selling propositions lie in improved purity levels (99.99% or more), reduced particle sizes, and customized functionalities to meet specific needs.
Propelling Factors for High Purity Alumina Industry Growth
The growth of the High Purity Alumina market is primarily driven by:
- Technological advancements: Improved production techniques leading to higher purity and tailored properties.
- Increasing demand from high-tech sectors: Electronics, energy storage, and aerospace are key drivers.
- Government incentives and investments: Support for advanced materials research and development.
Obstacles in the High Purity Alumina Industry Market
The High Purity Alumina market faces challenges such as:
- Fluctuations in raw material prices: Aluminum hydroxide prices can significantly impact production costs.
- Stringent environmental regulations: Compliance costs and potential production limitations.
- Intense competition: Existing players and emerging entrants creating price pressure.
Future Opportunities in High Purity Alumina Industry
Future opportunities are emerging in:
- Novel applications: Expansion into new high-growth sectors like advanced medical devices and 5G infrastructure.
- Development of specialized materials: Tailored alumina for specific applications to enhance performance.
- Sustainable production methods: Reducing environmental impact to enhance market acceptance.
Major Players in the High Purity Alumina Industry Ecosystem
- Baikowski
- Bestry Performance Materials Co Ltd
- Hebei Pengda New Material Technology Co Ltd
- Honghe Chemical
- Nippon Light Metal Co Ltd
- Polar Sapphire
- Rusal
- Sasol (USA) Corporation
- Shandong Keheng Crystal Material Technology Co Ltd
- Sumitomo Chemical Co Ltd
- Wuxi Tuobada Titanium Dioxide Products Co Ltd
- Xuancheng Jingrui New Materials Co Ltd
- List Not Exhaustive
Key Developments in High Purity Alumina Industry Industry
- August 2023: Sumitomo Chemical launched a new technology for ultra-fine α-alumina production, enhancing its market position and product portfolio.
- January 2022: Polar Performance Materials secured USD 4.1 Million in funding to develop high-purity alumina for lithium-ion batteries, showcasing the industry's potential in the clean energy sector.
Strategic High Purity Alumina Industry Market Forecast
The High Purity Alumina market is poised for continued growth, driven by technological innovation, expanding applications, and increased investment in sustainable manufacturing practices. The forecast period (2025-2033) anticipates robust expansion, with emerging markets and advanced applications fueling significant market potential and increased value. The industry's ability to adapt to changing regulatory environments and offer innovative solutions will be key factors in determining future success.
High Purity Alumina Industry Segmentation
-
1. Type
- 1.1. 4N
- 1.2. 5N
- 1.3. 6N
-
2. Technology
- 2.1. Hydrolysis
- 2.2. Hydrochloric Acid Leaching
-
3. Application
- 3.1. LED Lighting
- 3.2. Phosphor
- 3.3. Semiconductor
- 3.4. Lithium-ion (Li-Ion) Batteries
- 3.5. Technical Ceramics
- 3.6. Other Applications
High Purity Alumina Industry Segmentation By Geography
-
1. Asia Pacific
- 1.1. China
- 1.2. India
- 1.3. Japan
- 1.4. South Korea
- 1.5. Malaysia
- 1.6. Thailand
- 1.7. Indonesia
- 1.8. Vietnam
- 1.9. Rest of Asia Pacific
-
2. North America
- 2.1. United States
- 2.2. Canada
- 2.3. Mexico
-
3. Europe
- 3.1. Germany
- 3.2. United Kingdom
- 3.3. France
- 3.4. Italy
- 3.5. Spain
- 3.6. NORDIC Countries
- 3.7. Turkey
- 3.8. Russia
- 3.9. Rest of Europe
-
4. South America
- 4.1. Brazil
- 4.2. Argentina
- 4.3. Colombia
- 4.4. Rest of South America
-
5. Middle East and Africa
- 5.1. Saudi Arabia
- 5.2. Qatar
- 5.3. United Arab Emirates
- 5.4. Nigeria
- 5.5. Egypt
- 5.6. South Africa
- 5.7. Rest of Middle East and Africa
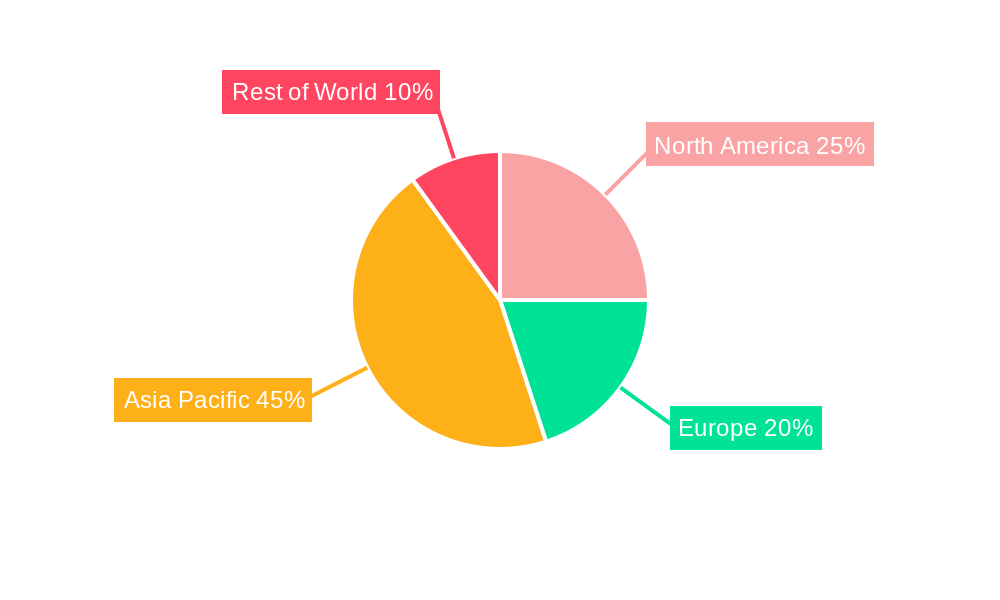
High Purity Alumina Industry Regional Market Share
Geographic Coverage of High Purity Alumina Industry
High Purity Alumina Industry REPORT HIGHLIGHTS
| Aspects | Details |
|---|---|
| Study Period | 2020-2034 |
| Base Year | 2025 |
| Estimated Year | 2026 |
| Forecast Period | 2026-2034 |
| Historical Period | 2020-2025 |
| Growth Rate | CAGR of 20.62% from 2020-2034 |
| Segmentation |
|
Table of Contents
- 1. Introduction
- 1.1. Research Scope
- 1.2. Market Segmentation
- 1.3. Research Objective
- 1.4. Definitions and Assumptions
- 2. Executive Summary
- 2.1. Market Snapshot
- 3. Market Dynamics
- 3.1. Market Drivers
- 3.2. Market Restrains
- 3.3. Market Trends
- 3.4. Market Opportunities
- 4. Market Factor Analysis
- 4.1. Porters Five Forces
- 4.1.1. Bargaining Power of Suppliers
- 4.1.2. Bargaining Power of Buyers
- 4.1.3. Threat of New Entrants
- 4.1.4. Threat of Substitutes
- 4.1.5. Competitive Rivalry
- 4.2. PESTEL analysis
- 4.3. BCG Analysis
- 4.3.1. Stars (High Growth, High Market Share)
- 4.3.2. Cash Cows (Low Growth, High Market Share)
- 4.3.3. Question Mark (High Growth, Low Market Share)
- 4.3.4. Dogs (Low Growth, Low Market Share)
- 4.4. Ansoff Matrix Analysis
- 4.5. Supply Chain Analysis
- 4.6. Regulatory Landscape
- 4.7. Current Market Potential and Opportunity Assessment (TAM–SAM–SOM Framework)
- 4.8. DMV Analyst Note
- 4.1. Porters Five Forces
- 5. Market Analysis, Insights and Forecast 2021-2033
- 5.1. Market Analysis, Insights and Forecast - by Type
- 5.1.1. 4N
- 5.1.2. 5N
- 5.1.3. 6N
- 5.2. Market Analysis, Insights and Forecast - by Technology
- 5.2.1. Hydrolysis
- 5.2.2. Hydrochloric Acid Leaching
- 5.3. Market Analysis, Insights and Forecast - by Application
- 5.3.1. LED Lighting
- 5.3.2. Phosphor
- 5.3.3. Semiconductor
- 5.3.4. Lithium-ion (Li-Ion) Batteries
- 5.3.5. Technical Ceramics
- 5.3.6. Other Applications
- 5.4. Market Analysis, Insights and Forecast - by Region
- 5.4.1. Asia Pacific
- 5.4.2. North America
- 5.4.3. Europe
- 5.4.4. South America
- 5.4.5. Middle East and Africa
- 5.1. Market Analysis, Insights and Forecast - by Type
- 6. Global High Purity Alumina Industry Analysis, Insights and Forecast, 2021-2033
- 6.1. Market Analysis, Insights and Forecast - by Type
- 6.1.1. 4N
- 6.1.2. 5N
- 6.1.3. 6N
- 6.2. Market Analysis, Insights and Forecast - by Technology
- 6.2.1. Hydrolysis
- 6.2.2. Hydrochloric Acid Leaching
- 6.3. Market Analysis, Insights and Forecast - by Application
- 6.3.1. LED Lighting
- 6.3.2. Phosphor
- 6.3.3. Semiconductor
- 6.3.4. Lithium-ion (Li-Ion) Batteries
- 6.3.5. Technical Ceramics
- 6.3.6. Other Applications
- 6.1. Market Analysis, Insights and Forecast - by Type
- 7. Asia Pacific High Purity Alumina Industry Analysis, Insights and Forecast, 2020-2032
- 7.1. Market Analysis, Insights and Forecast - by Type
- 7.1.1. 4N
- 7.1.2. 5N
- 7.1.3. 6N
- 7.2. Market Analysis, Insights and Forecast - by Technology
- 7.2.1. Hydrolysis
- 7.2.2. Hydrochloric Acid Leaching
- 7.3. Market Analysis, Insights and Forecast - by Application
- 7.3.1. LED Lighting
- 7.3.2. Phosphor
- 7.3.3. Semiconductor
- 7.3.4. Lithium-ion (Li-Ion) Batteries
- 7.3.5. Technical Ceramics
- 7.3.6. Other Applications
- 7.1. Market Analysis, Insights and Forecast - by Type
- 8. North America High Purity Alumina Industry Analysis, Insights and Forecast, 2020-2032
- 8.1. Market Analysis, Insights and Forecast - by Type
- 8.1.1. 4N
- 8.1.2. 5N
- 8.1.3. 6N
- 8.2. Market Analysis, Insights and Forecast - by Technology
- 8.2.1. Hydrolysis
- 8.2.2. Hydrochloric Acid Leaching
- 8.3. Market Analysis, Insights and Forecast - by Application
- 8.3.1. LED Lighting
- 8.3.2. Phosphor
- 8.3.3. Semiconductor
- 8.3.4. Lithium-ion (Li-Ion) Batteries
- 8.3.5. Technical Ceramics
- 8.3.6. Other Applications
- 8.1. Market Analysis, Insights and Forecast - by Type
- 9. Europe High Purity Alumina Industry Analysis, Insights and Forecast, 2020-2032
- 9.1. Market Analysis, Insights and Forecast - by Type
- 9.1.1. 4N
- 9.1.2. 5N
- 9.1.3. 6N
- 9.2. Market Analysis, Insights and Forecast - by Technology
- 9.2.1. Hydrolysis
- 9.2.2. Hydrochloric Acid Leaching
- 9.3. Market Analysis, Insights and Forecast - by Application
- 9.3.1. LED Lighting
- 9.3.2. Phosphor
- 9.3.3. Semiconductor
- 9.3.4. Lithium-ion (Li-Ion) Batteries
- 9.3.5. Technical Ceramics
- 9.3.6. Other Applications
- 9.1. Market Analysis, Insights and Forecast - by Type
- 10. South America High Purity Alumina Industry Analysis, Insights and Forecast, 2020-2032
- 10.1. Market Analysis, Insights and Forecast - by Type
- 10.1.1. 4N
- 10.1.2. 5N
- 10.1.3. 6N
- 10.2. Market Analysis, Insights and Forecast - by Technology
- 10.2.1. Hydrolysis
- 10.2.2. Hydrochloric Acid Leaching
- 10.3. Market Analysis, Insights and Forecast - by Application
- 10.3.1. LED Lighting
- 10.3.2. Phosphor
- 10.3.3. Semiconductor
- 10.3.4. Lithium-ion (Li-Ion) Batteries
- 10.3.5. Technical Ceramics
- 10.3.6. Other Applications
- 10.1. Market Analysis, Insights and Forecast - by Type
- 11. Middle East and Africa High Purity Alumina Industry Analysis, Insights and Forecast, 2020-2032
- 11.1. Market Analysis, Insights and Forecast - by Type
- 11.1.1. 4N
- 11.1.2. 5N
- 11.1.3. 6N
- 11.2. Market Analysis, Insights and Forecast - by Technology
- 11.2.1. Hydrolysis
- 11.2.2. Hydrochloric Acid Leaching
- 11.3. Market Analysis, Insights and Forecast - by Application
- 11.3.1. LED Lighting
- 11.3.2. Phosphor
- 11.3.3. Semiconductor
- 11.3.4. Lithium-ion (Li-Ion) Batteries
- 11.3.5. Technical Ceramics
- 11.3.6. Other Applications
- 11.1. Market Analysis, Insights and Forecast - by Type
- 12. Competitive Analysis
- 12.1. Company Profiles
- 12.1.1 Baikowski
- 12.1.1.1. Company Overview
- 12.1.1.2. Products
- 12.1.1.3. Company Financials
- 12.1.1.4. SWOT Analysis
- 12.1.2 Bestry Performance Materials Co Ltd
- 12.1.2.1. Company Overview
- 12.1.2.2. Products
- 12.1.2.3. Company Financials
- 12.1.2.4. SWOT Analysis
- 12.1.3 Hebei Pengda New Material Technology Co Ltd
- 12.1.3.1. Company Overview
- 12.1.3.2. Products
- 12.1.3.3. Company Financials
- 12.1.3.4. SWOT Analysis
- 12.1.4 Honghe Chemical
- 12.1.4.1. Company Overview
- 12.1.4.2. Products
- 12.1.4.3. Company Financials
- 12.1.4.4. SWOT Analysis
- 12.1.5 Nippon Light Metal Co Ltd
- 12.1.5.1. Company Overview
- 12.1.5.2. Products
- 12.1.5.3. Company Financials
- 12.1.5.4. SWOT Analysis
- 12.1.6 Polar Sapphire
- 12.1.6.1. Company Overview
- 12.1.6.2. Products
- 12.1.6.3. Company Financials
- 12.1.6.4. SWOT Analysis
- 12.1.7 Rusal
- 12.1.7.1. Company Overview
- 12.1.7.2. Products
- 12.1.7.3. Company Financials
- 12.1.7.4. SWOT Analysis
- 12.1.8 Sasol (USA) Corporation
- 12.1.8.1. Company Overview
- 12.1.8.2. Products
- 12.1.8.3. Company Financials
- 12.1.8.4. SWOT Analysis
- 12.1.9 Shandong Keheng Crystal Material Technology Co Ltd
- 12.1.9.1. Company Overview
- 12.1.9.2. Products
- 12.1.9.3. Company Financials
- 12.1.9.4. SWOT Analysis
- 12.1.10 Sumitomo Chemical Co Ltd
- 12.1.10.1. Company Overview
- 12.1.10.2. Products
- 12.1.10.3. Company Financials
- 12.1.10.4. SWOT Analysis
- 12.1.11 Wuxi Tuobada Titanium Dioxide Products Co Ltd
- 12.1.11.1. Company Overview
- 12.1.11.2. Products
- 12.1.11.3. Company Financials
- 12.1.11.4. SWOT Analysis
- 12.1.12 Xuancheng Jingrui New Materials Co Ltd*List Not Exhaustive
- 12.1.12.1. Company Overview
- 12.1.12.2. Products
- 12.1.12.3. Company Financials
- 12.1.12.4. SWOT Analysis
- 12.1.1 Baikowski
- 12.2. Market Entropy
- 12.2.1 Company's Key Areas Served
- 12.2.2 Recent Developments
- 12.3. Company Market Share Analysis 2025
- 12.3.1 Top 5 Companies Market Share Analysis
- 12.3.2 Top 3 Companies Market Share Analysis
- 12.4. List of Potential Customers
- 13. Research Methodology
List of Figures
- Figure 1: Global High Purity Alumina Industry Revenue Breakdown (billion, %) by Region 2025 & 2033
- Figure 2: Asia Pacific High Purity Alumina Industry Revenue (billion), by Type 2025 & 2033
- Figure 3: Asia Pacific High Purity Alumina Industry Revenue Share (%), by Type 2025 & 2033
- Figure 4: Asia Pacific High Purity Alumina Industry Revenue (billion), by Technology 2025 & 2033
- Figure 5: Asia Pacific High Purity Alumina Industry Revenue Share (%), by Technology 2025 & 2033
- Figure 6: Asia Pacific High Purity Alumina Industry Revenue (billion), by Application 2025 & 2033
- Figure 7: Asia Pacific High Purity Alumina Industry Revenue Share (%), by Application 2025 & 2033
- Figure 8: Asia Pacific High Purity Alumina Industry Revenue (billion), by Country 2025 & 2033
- Figure 9: Asia Pacific High Purity Alumina Industry Revenue Share (%), by Country 2025 & 2033
- Figure 10: North America High Purity Alumina Industry Revenue (billion), by Type 2025 & 2033
- Figure 11: North America High Purity Alumina Industry Revenue Share (%), by Type 2025 & 2033
- Figure 12: North America High Purity Alumina Industry Revenue (billion), by Technology 2025 & 2033
- Figure 13: North America High Purity Alumina Industry Revenue Share (%), by Technology 2025 & 2033
- Figure 14: North America High Purity Alumina Industry Revenue (billion), by Application 2025 & 2033
- Figure 15: North America High Purity Alumina Industry Revenue Share (%), by Application 2025 & 2033
- Figure 16: North America High Purity Alumina Industry Revenue (billion), by Country 2025 & 2033
- Figure 17: North America High Purity Alumina Industry Revenue Share (%), by Country 2025 & 2033
- Figure 18: Europe High Purity Alumina Industry Revenue (billion), by Type 2025 & 2033
- Figure 19: Europe High Purity Alumina Industry Revenue Share (%), by Type 2025 & 2033
- Figure 20: Europe High Purity Alumina Industry Revenue (billion), by Technology 2025 & 2033
- Figure 21: Europe High Purity Alumina Industry Revenue Share (%), by Technology 2025 & 2033
- Figure 22: Europe High Purity Alumina Industry Revenue (billion), by Application 2025 & 2033
- Figure 23: Europe High Purity Alumina Industry Revenue Share (%), by Application 2025 & 2033
- Figure 24: Europe High Purity Alumina Industry Revenue (billion), by Country 2025 & 2033
- Figure 25: Europe High Purity Alumina Industry Revenue Share (%), by Country 2025 & 2033
- Figure 26: South America High Purity Alumina Industry Revenue (billion), by Type 2025 & 2033
- Figure 27: South America High Purity Alumina Industry Revenue Share (%), by Type 2025 & 2033
- Figure 28: South America High Purity Alumina Industry Revenue (billion), by Technology 2025 & 2033
- Figure 29: South America High Purity Alumina Industry Revenue Share (%), by Technology 2025 & 2033
- Figure 30: South America High Purity Alumina Industry Revenue (billion), by Application 2025 & 2033
- Figure 31: South America High Purity Alumina Industry Revenue Share (%), by Application 2025 & 2033
- Figure 32: South America High Purity Alumina Industry Revenue (billion), by Country 2025 & 2033
- Figure 33: South America High Purity Alumina Industry Revenue Share (%), by Country 2025 & 2033
- Figure 34: Middle East and Africa High Purity Alumina Industry Revenue (billion), by Type 2025 & 2033
- Figure 35: Middle East and Africa High Purity Alumina Industry Revenue Share (%), by Type 2025 & 2033
- Figure 36: Middle East and Africa High Purity Alumina Industry Revenue (billion), by Technology 2025 & 2033
- Figure 37: Middle East and Africa High Purity Alumina Industry Revenue Share (%), by Technology 2025 & 2033
- Figure 38: Middle East and Africa High Purity Alumina Industry Revenue (billion), by Application 2025 & 2033
- Figure 39: Middle East and Africa High Purity Alumina Industry Revenue Share (%), by Application 2025 & 2033
- Figure 40: Middle East and Africa High Purity Alumina Industry Revenue (billion), by Country 2025 & 2033
- Figure 41: Middle East and Africa High Purity Alumina Industry Revenue Share (%), by Country 2025 & 2033
List of Tables
- Table 1: Global High Purity Alumina Industry Revenue billion Forecast, by Type 2020 & 2033
- Table 2: Global High Purity Alumina Industry Revenue billion Forecast, by Technology 2020 & 2033
- Table 3: Global High Purity Alumina Industry Revenue billion Forecast, by Application 2020 & 2033
- Table 4: Global High Purity Alumina Industry Revenue billion Forecast, by Region 2020 & 2033
- Table 5: Global High Purity Alumina Industry Revenue billion Forecast, by Type 2020 & 2033
- Table 6: Global High Purity Alumina Industry Revenue billion Forecast, by Technology 2020 & 2033
- Table 7: Global High Purity Alumina Industry Revenue billion Forecast, by Application 2020 & 2033
- Table 8: Global High Purity Alumina Industry Revenue billion Forecast, by Country 2020 & 2033
- Table 9: China High Purity Alumina Industry Revenue (billion) Forecast, by Application 2020 & 2033
- Table 10: India High Purity Alumina Industry Revenue (billion) Forecast, by Application 2020 & 2033
- Table 11: Japan High Purity Alumina Industry Revenue (billion) Forecast, by Application 2020 & 2033
- Table 12: South Korea High Purity Alumina Industry Revenue (billion) Forecast, by Application 2020 & 2033
- Table 13: Malaysia High Purity Alumina Industry Revenue (billion) Forecast, by Application 2020 & 2033
- Table 14: Thailand High Purity Alumina Industry Revenue (billion) Forecast, by Application 2020 & 2033
- Table 15: Indonesia High Purity Alumina Industry Revenue (billion) Forecast, by Application 2020 & 2033
- Table 16: Vietnam High Purity Alumina Industry Revenue (billion) Forecast, by Application 2020 & 2033
- Table 17: Rest of Asia Pacific High Purity Alumina Industry Revenue (billion) Forecast, by Application 2020 & 2033
- Table 18: Global High Purity Alumina Industry Revenue billion Forecast, by Type 2020 & 2033
- Table 19: Global High Purity Alumina Industry Revenue billion Forecast, by Technology 2020 & 2033
- Table 20: Global High Purity Alumina Industry Revenue billion Forecast, by Application 2020 & 2033
- Table 21: Global High Purity Alumina Industry Revenue billion Forecast, by Country 2020 & 2033
- Table 22: United States High Purity Alumina Industry Revenue (billion) Forecast, by Application 2020 & 2033
- Table 23: Canada High Purity Alumina Industry Revenue (billion) Forecast, by Application 2020 & 2033
- Table 24: Mexico High Purity Alumina Industry Revenue (billion) Forecast, by Application 2020 & 2033
- Table 25: Global High Purity Alumina Industry Revenue billion Forecast, by Type 2020 & 2033
- Table 26: Global High Purity Alumina Industry Revenue billion Forecast, by Technology 2020 & 2033
- Table 27: Global High Purity Alumina Industry Revenue billion Forecast, by Application 2020 & 2033
- Table 28: Global High Purity Alumina Industry Revenue billion Forecast, by Country 2020 & 2033
- Table 29: Germany High Purity Alumina Industry Revenue (billion) Forecast, by Application 2020 & 2033
- Table 30: United Kingdom High Purity Alumina Industry Revenue (billion) Forecast, by Application 2020 & 2033
- Table 31: France High Purity Alumina Industry Revenue (billion) Forecast, by Application 2020 & 2033
- Table 32: Italy High Purity Alumina Industry Revenue (billion) Forecast, by Application 2020 & 2033
- Table 33: Spain High Purity Alumina Industry Revenue (billion) Forecast, by Application 2020 & 2033
- Table 34: NORDIC Countries High Purity Alumina Industry Revenue (billion) Forecast, by Application 2020 & 2033
- Table 35: Turkey High Purity Alumina Industry Revenue (billion) Forecast, by Application 2020 & 2033
- Table 36: Russia High Purity Alumina Industry Revenue (billion) Forecast, by Application 2020 & 2033
- Table 37: Rest of Europe High Purity Alumina Industry Revenue (billion) Forecast, by Application 2020 & 2033
- Table 38: Global High Purity Alumina Industry Revenue billion Forecast, by Type 2020 & 2033
- Table 39: Global High Purity Alumina Industry Revenue billion Forecast, by Technology 2020 & 2033
- Table 40: Global High Purity Alumina Industry Revenue billion Forecast, by Application 2020 & 2033
- Table 41: Global High Purity Alumina Industry Revenue billion Forecast, by Country 2020 & 2033
- Table 42: Brazil High Purity Alumina Industry Revenue (billion) Forecast, by Application 2020 & 2033
- Table 43: Argentina High Purity Alumina Industry Revenue (billion) Forecast, by Application 2020 & 2033
- Table 44: Colombia High Purity Alumina Industry Revenue (billion) Forecast, by Application 2020 & 2033
- Table 45: Rest of South America High Purity Alumina Industry Revenue (billion) Forecast, by Application 2020 & 2033
- Table 46: Global High Purity Alumina Industry Revenue billion Forecast, by Type 2020 & 2033
- Table 47: Global High Purity Alumina Industry Revenue billion Forecast, by Technology 2020 & 2033
- Table 48: Global High Purity Alumina Industry Revenue billion Forecast, by Application 2020 & 2033
- Table 49: Global High Purity Alumina Industry Revenue billion Forecast, by Country 2020 & 2033
- Table 50: Saudi Arabia High Purity Alumina Industry Revenue (billion) Forecast, by Application 2020 & 2033
- Table 51: Qatar High Purity Alumina Industry Revenue (billion) Forecast, by Application 2020 & 2033
- Table 52: United Arab Emirates High Purity Alumina Industry Revenue (billion) Forecast, by Application 2020 & 2033
- Table 53: Nigeria High Purity Alumina Industry Revenue (billion) Forecast, by Application 2020 & 2033
- Table 54: Egypt High Purity Alumina Industry Revenue (billion) Forecast, by Application 2020 & 2033
- Table 55: South Africa High Purity Alumina Industry Revenue (billion) Forecast, by Application 2020 & 2033
- Table 56: Rest of Middle East and Africa High Purity Alumina Industry Revenue (billion) Forecast, by Application 2020 & 2033
Frequently Asked Questions
1. What is the projected Compound Annual Growth Rate (CAGR) of the High Purity Alumina Industry?
The projected CAGR is approximately 20.62%.
2. Which companies are prominent players in the High Purity Alumina Industry?
Key companies in the market include Baikowski, Bestry Performance Materials Co Ltd, Hebei Pengda New Material Technology Co Ltd, Honghe Chemical, Nippon Light Metal Co Ltd, Polar Sapphire, Rusal, Sasol (USA) Corporation, Shandong Keheng Crystal Material Technology Co Ltd, Sumitomo Chemical Co Ltd, Wuxi Tuobada Titanium Dioxide Products Co Ltd, Xuancheng Jingrui New Materials Co Ltd*List Not Exhaustive.
3. What are the main segments of the High Purity Alumina Industry?
The market segments include Type, Technology, Application.
4. Can you provide details about the market size?
The market size is estimated to be USD 0.57 billion as of 2022.
5. What are some drivers contributing to market growth?
Increasing Demand for LED-based Lighting; Demand from Lithium-ion Battery Markets.
6. What are the notable trends driving market growth?
The LED Lighting Segment is Expected to Dominate the Market.
7. Are there any restraints impacting market growth?
Increasing Demand for LED-based Lighting; Demand from Lithium-ion Battery Markets.
8. Can you provide examples of recent developments in the market?
August 2023: Sumitomo Chemical introduced a new technology for the production of ultra-fine α-alumina, which was set to start in September 2023. Alumina materials that are made by calcining aluminum hydroxide at high temperatures have a purity of around 99.99% or more. They are called ultra-high purity alumina.
9. What pricing options are available for accessing the report?
Pricing options include single-user, multi-user, and enterprise licenses priced at USD 4750, USD 5250, and USD 8750 respectively.
10. Is the market size provided in terms of value or volume?
The market size is provided in terms of value, measured in billion.
11. Are there any specific market keywords associated with the report?
Yes, the market keyword associated with the report is "High Purity Alumina Industry," which aids in identifying and referencing the specific market segment covered.
12. How do I determine which pricing option suits my needs best?
The pricing options vary based on user requirements and access needs. Individual users may opt for single-user licenses, while businesses requiring broader access may choose multi-user or enterprise licenses for cost-effective access to the report.
13. Are there any additional resources or data provided in the High Purity Alumina Industry report?
While the report offers comprehensive insights, it's advisable to review the specific contents or supplementary materials provided to ascertain if additional resources or data are available.
14. How can I stay updated on further developments or reports in the High Purity Alumina Industry?
To stay informed about further developments, trends, and reports in the High Purity Alumina Industry, consider subscribing to industry newsletters, following relevant companies and organizations, or regularly checking reputable industry news sources and publications.
Methodology
Step 1 - Identification of Relevant Samples Size from Population Database


Step 2 - Approaches for Defining Global Market Size (Value, Volume* & Price*)

Note*: In applicable scenarios
Step 3 - Data Sources
Primary Research
- Web Analytics
- Survey Reports
- Research Institute
- Latest Research Reports
- Opinion Leaders
Secondary Research
- Annual Reports
- White Paper
- Latest Press Release
- Industry Association
- Paid Database
- Investor Presentations

Step 4 - Data Triangulation
Involves using different sources of information in order to increase the validity of a study
These sources are likely to be stakeholders in a program - participants, other researchers, program staff, other community members, and so on.
Then we put all data in single framework & apply various statistical tools to find out the dynamic on the market.
During the analysis stage, feedback from the stakeholder groups would be compared to determine areas of agreement as well as areas of divergence