

Key Insights
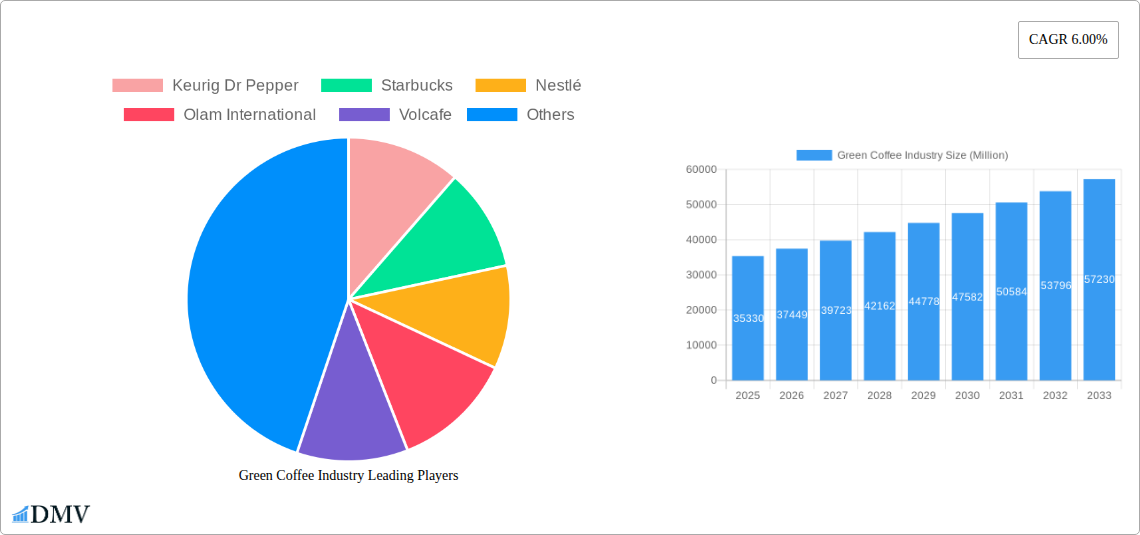
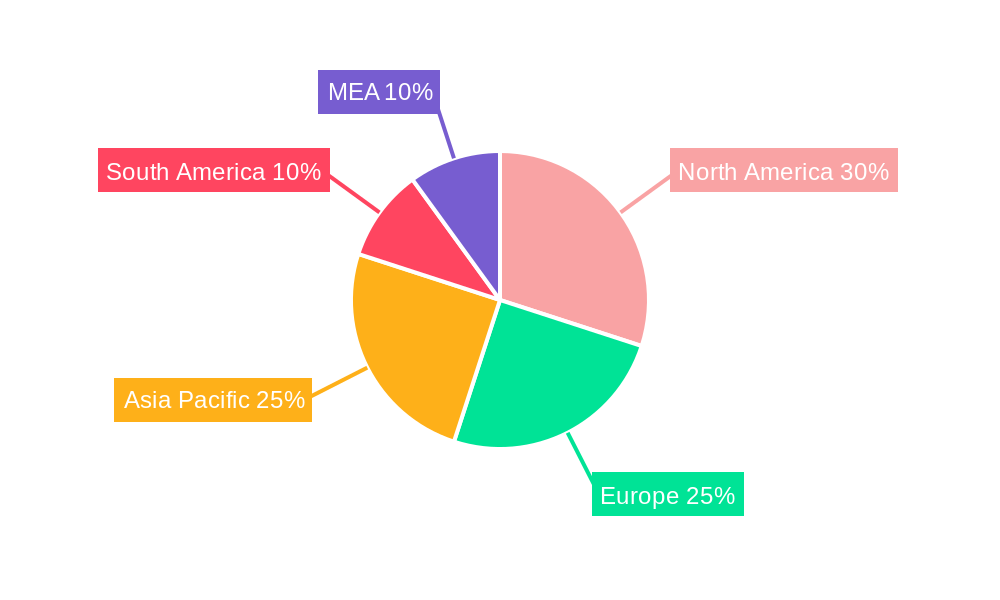
The global green coffee market, valued at $35.33 billion in 2025, is projected to experience robust growth, driven by rising consumer demand for coffee, particularly in emerging economies. A compound annual growth rate (CAGR) of 6% from 2025 to 2033 indicates a significant expansion of the market, reaching an estimated value exceeding $60 billion by 2033. This growth is fueled by several key factors. Firstly, the increasing popularity of specialty coffee and the growing awareness of health benefits associated with coffee consumption are driving demand for high-quality green beans. Secondly, the expanding food service industry and the rise of coffee shops globally are significant contributors to market expansion. Finally, ongoing innovations in coffee brewing methods and the emergence of new coffee-based products are further fueling market growth. However, factors such as fluctuating coffee bean prices due to climate change and geopolitical instability, as well as potential supply chain disruptions, pose challenges to consistent market growth. The market is segmented by product type (Arabica, Robusta, Others), application (Beverage, Food, Others), and end-user (Household, Commercial, Others), allowing for a deeper understanding of specific market dynamics within these categories. Key players like Keurig Dr Pepper, Starbucks, Nestlé, and Olam International are shaping the market through strategic acquisitions, product diversification, and global expansion. Regional analysis reveals significant market concentration in North America and Europe, but growth in Asia-Pacific is expected to be particularly strong, driven by increasing coffee consumption in countries like China and India.
The segmentation of the green coffee market offers granular insights into its dynamics. The Arabica segment currently holds a dominant market share due to its superior quality and flavor profile, while Robusta beans cater to a price-sensitive segment. The beverage application segment dominates the market, reflecting the widespread use of coffee as a beverage. However, the food industry is showing increasing adoption of coffee as an ingredient, driving the growth of the food application segment. Household consumption constitutes a larger share of the end-user segment, but the commercial segment is expanding rapidly due to the proliferation of cafes and restaurants. Geographic variations in coffee consumption patterns influence regional market share, with developed nations exhibiting high per capita consumption and developing nations witnessing a rapid increase in coffee consumption. Competitive analysis suggests a consolidation of the market with large multinational players strategically positioning themselves to capitalize on the industry's growth trajectory. Therefore, a thorough understanding of these market dynamics is crucial for stakeholders seeking to succeed in this dynamic industry.
Green Coffee Industry Market Report: 2019-2033
This comprehensive report provides a detailed analysis of the global green coffee industry, encompassing market size, trends, leading players, and future growth prospects. The study period covers 2019-2033, with 2025 as the base and estimated year. This insightful analysis is crucial for stakeholders seeking to understand the dynamics of this multi-billion-dollar market and capitalize on emerging opportunities. The market is projected to reach $XX Million by 2033.
Green Coffee Industry Market Composition & Trends
This section delves into the intricate structure of the green coffee market, examining its concentration, innovation drivers, regulatory landscape, substitute products, end-user profiles, and merger & acquisition (M&A) activities. The global green coffee market is estimated at $XX Million in 2025, showing a [growth rate]% CAGR from 2025 to 2033.
Market Concentration: The market exhibits a moderately concentrated structure, with a few major players commanding significant market share. For instance, Nestle and Starbucks together hold approximately XX% of the market share, while Olam International and Volcafe control about xx%. Smaller players account for the remaining XX%.
Innovation Catalysts: Sustainability certifications (like Rainforest Alliance) and technological advancements in farming and processing drive innovation. Single-origin coffee and specialty blends are driving premiumization and impacting market segmentation.
Regulatory Landscape: Government regulations concerning coffee production, trade, and sustainability significantly influence market dynamics. The recent Indian Coffee Promotion and Development Bill, 2022, exemplifies regulatory intervention aimed at boosting the industry.
Substitute Products: Tea and other beverages pose a competitive threat, impacting the overall demand for green coffee.
End-User Profiles: The primary end-users are household consumers (XX%), followed by commercial establishments (XX%), such as cafes and restaurants. The remaining XX% comprises other segments.
M&A Activities: The past five years have witnessed significant M&A activity valued at approximately $XX Million, mainly driven by vertical integration and expansion into new markets. Key transactions include [mention specific, impactful M&A deals, if available. Otherwise, state "Data unavailable"].
Green Coffee Industry Industry Evolution
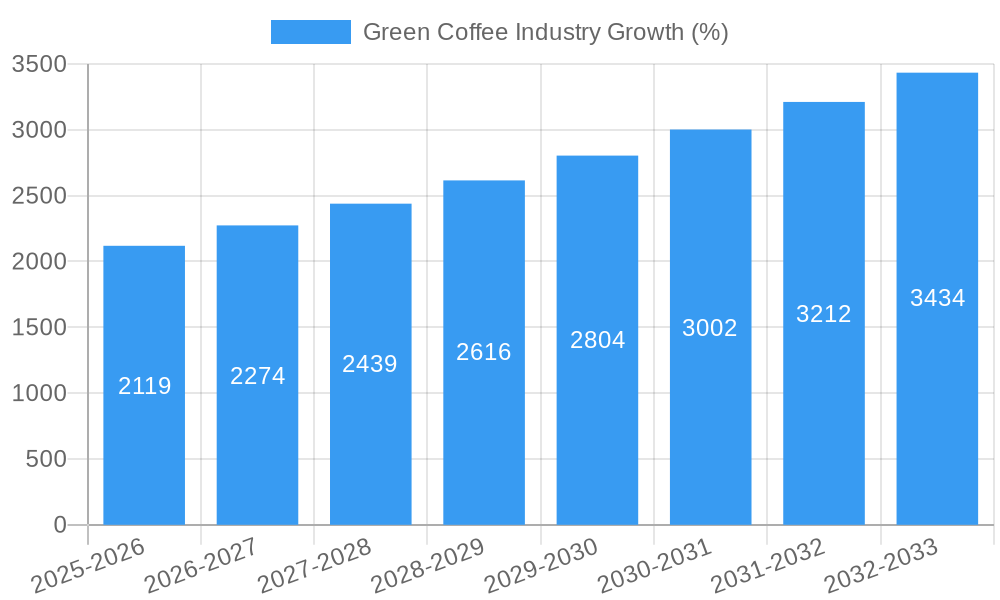
This section analyzes the evolutionary trajectory of the green coffee industry, incorporating market growth trajectories, technological advancements, and evolving consumer preferences. The industry has witnessed significant growth over the past decade, driven by increasing demand for specialty coffee and ethical sourcing. Technological advancements in farming techniques and processing methods have enhanced efficiency and quality. Consumer preferences are shifting towards sustainability and premiumization, driving demand for organic, fair-trade, and single-origin coffees. The market witnessed a growth rate of [Growth rate]% during the historical period (2019-2024), driven primarily by [specify key reasons, e.g., rising disposable incomes, changing lifestyles]. This trend is projected to continue during the forecast period (2025-2033), with an anticipated growth rate of [Growth rate]%. The adoption rate of sustainable farming practices is increasing, with [Percentage]% of coffee farms currently certified under sustainability programs.
Leading Regions, Countries, or Segments in Green Coffee Industry
This section identifies dominant regions, countries, and segments within the green coffee industry.
Product Type: Arabica coffee accounts for the largest market share (XX%), followed by Robusta (XX%) and others (XX%). Arabica's dominance stems from its superior taste and aroma, driving higher prices and demand.
Application: Beverages are the dominant application (XX%), followed by food (XX%) and other uses (XX%). The beverage segment's dominance is due to the widespread consumption of coffee worldwide.
End-User: Household consumption (XX%) constitutes the major end-user segment, surpassing commercial consumption (XX%). The remaining XX% represents other consumption sectors.
Key Drivers:
- Investment Trends: Significant investments in sustainable farming practices and processing technologies contribute to the growth of specific segments.
- Regulatory Support: Government policies and initiatives aimed at promoting the coffee industry, such as the Indian Coffee Promotion and Development Bill, 2022, enhance production and exports.
Green Coffee Industry Product Innovations
Recent innovations focus on enhancing coffee quality, sustainability, and convenience. New roasting techniques are improving flavor profiles, while single-serve brewing systems and ready-to-drink coffee formats cater to busy consumers. The emergence of plant-based coffee alternatives expands the product portfolio. Technological improvements in farming practices lead to higher yields and better quality beans. The unique selling propositions of these innovations include improved convenience, enhanced taste, and sustainable sourcing.
Propelling Factors for Green Coffee Industry Growth
Several factors contribute to the industry's growth. Rising disposable incomes and changing lifestyles increase coffee consumption. Technological advancements, such as precision agriculture and automated processing, enhance efficiency and quality. Government support through initiatives like the Indian Coffee Promotion and Development Bill, 2022, fosters industry growth. Growing awareness of health benefits associated with coffee consumption is boosting the market.
Obstacles in the Green Coffee Industry Market
The green coffee industry faces challenges, including volatile commodity prices, supply chain disruptions due to climate change and geopolitical instability, and increasing competition from substitute products. Regulatory hurdles in different countries can hinder market access, while sustainability concerns necessitate increased investment in ethical sourcing. These factors collectively impact profitability and overall market growth.
Future Opportunities in Green Coffee Industry
Emerging opportunities reside in expanding into new markets, especially in developing countries with rising coffee consumption. Technological advancements, such as artificial intelligence in quality control and personalized coffee brewing systems, hold immense potential. The growing popularity of specialty coffee and plant-based alternatives presents lucrative avenues for growth.
Major Players in the Green Coffee Industry Ecosystem
- Keurig Dr Pepper
- Starbucks
- Nestlé
- Olam International
- Volcafe
- Jacobs Douwe Egberts
- Lavazza illycaffè
- J.M. Smucker
- Kraft Heinz
Key Developments in Green Coffee Industry Industry
- July 2021: The Rainforest Alliance launched a new sustainability certification program, impacting ethical sourcing and consumer perception.
- July 2022: The Ethiopian Coffee and Tea Authority (ECTA) announced a strategy to triple coffee production in ten years, significantly influencing future supply.
- July 2022: The Indian government proposed the 'Coffee Promotion and Development Bill, 2022,' aiming to modernize the industry and boost exports.
Strategic Green Coffee Industry Market Forecast
The green coffee industry is poised for substantial growth driven by increasing demand, technological advancements, and supportive government policies. The focus on sustainability and premiumization will shape future market trends. The market's potential for expansion into new geographical regions and product categories presents significant opportunities for stakeholders. Continued innovation and strategic investments are crucial for sustained growth in the years to come.
Green Coffee Industry Segmentation
- 1. Production Analysis
- 2. Consumption Analysis
- 3. Import Market Analysis (Value & Volume)
- 4. Export Market Analysis (Value & Volume)
- 5. Price Trend Analysis
Green Coffee Industry Segmentation By Geography
-
1. North America
- 1.1. United States
- 1.2. Canada
- 1.3. Mexico
-
2. Europe
- 2.1. Germany
- 2.2. United Kingdom
- 2.3. Spain
- 2.4. France
- 2.5. Italy
- 2.6. Belgium
- 2.7. Russia
-
3. Asia Pacific
- 3.1. China
- 3.2. Vietnam
- 3.3. Indonesia
- 3.4. India
- 3.5. Japan
-
4. South America
- 4.1. Brazil
- 4.2. Colombia
-
5. Middle East and Africa
- 5.1. Uganda
- 5.2. Ethiopia
Green Coffee Industry REPORT HIGHLIGHTS
| Aspects | Details |
|---|---|
| Study Period | 2019-2033 |
| Base Year | 2024 |
| Estimated Year | 2025 |
| Forecast Period | 2025-2033 |
| Historical Period | 2019-2024 |
| Growth Rate | CAGR of 6.00% from 2019-2033 |
| Segmentation |
|
Table of Contents
- 1. Introduction
- 1.1. Research Scope
- 1.2. Market Segmentation
- 1.3. Research Methodology
- 1.4. Definitions and Assumptions
- 2. Executive Summary
- 2.1. Introduction
- 3. Market Dynamics
- 3.1. Introduction
- 3.2. Market Drivers
- 3.2.1. Increasing Berry Consumption for Health Benefits; Increasing Adoption of High-Technology Farm Practices; Growing Usage of Berries in the Food and Beverage Industries
- 3.3. Market Restrains
- 3.3.1. High Production Cost Involved in Berry Production; Increasing Disease and Pest Infestations
- 3.4. Market Trends
- 3.4.1. Increasing Demand for Certified Coffee
- 4. Market Factor Analysis
- 4.1. Porters Five Forces
- 4.2. Supply/Value Chain
- 4.3. PESTEL analysis
- 4.4. Market Entropy
- 4.5. Patent/Trademark Analysis
- 5. Global Green Coffee Industry Analysis, Insights and Forecast, 2019-2031
- 5.1. Market Analysis, Insights and Forecast - by Production Analysis
- 5.2. Market Analysis, Insights and Forecast - by Consumption Analysis
- 5.3. Market Analysis, Insights and Forecast - by Import Market Analysis (Value & Volume)
- 5.4. Market Analysis, Insights and Forecast - by Export Market Analysis (Value & Volume)
- 5.5. Market Analysis, Insights and Forecast - by Price Trend Analysis
- 5.6. Market Analysis, Insights and Forecast - by Region
- 5.6.1. North America
- 5.6.2. Europe
- 5.6.3. Asia Pacific
- 5.6.4. South America
- 5.6.5. Middle East and Africa
- 5.1. Market Analysis, Insights and Forecast - by Production Analysis
- 6. North America Green Coffee Industry Analysis, Insights and Forecast, 2019-2031
- 6.1. Market Analysis, Insights and Forecast - by Production Analysis
- 6.2. Market Analysis, Insights and Forecast - by Consumption Analysis
- 6.3. Market Analysis, Insights and Forecast - by Import Market Analysis (Value & Volume)
- 6.4. Market Analysis, Insights and Forecast - by Export Market Analysis (Value & Volume)
- 6.5. Market Analysis, Insights and Forecast - by Price Trend Analysis
- 6.1. Market Analysis, Insights and Forecast - by Production Analysis
- 7. Europe Green Coffee Industry Analysis, Insights and Forecast, 2019-2031
- 7.1. Market Analysis, Insights and Forecast - by Production Analysis
- 7.2. Market Analysis, Insights and Forecast - by Consumption Analysis
- 7.3. Market Analysis, Insights and Forecast - by Import Market Analysis (Value & Volume)
- 7.4. Market Analysis, Insights and Forecast - by Export Market Analysis (Value & Volume)
- 7.5. Market Analysis, Insights and Forecast - by Price Trend Analysis
- 7.1. Market Analysis, Insights and Forecast - by Production Analysis
- 8. Asia Pacific Green Coffee Industry Analysis, Insights and Forecast, 2019-2031
- 8.1. Market Analysis, Insights and Forecast - by Production Analysis
- 8.2. Market Analysis, Insights and Forecast - by Consumption Analysis
- 8.3. Market Analysis, Insights and Forecast - by Import Market Analysis (Value & Volume)
- 8.4. Market Analysis, Insights and Forecast - by Export Market Analysis (Value & Volume)
- 8.5. Market Analysis, Insights and Forecast - by Price Trend Analysis
- 8.1. Market Analysis, Insights and Forecast - by Production Analysis
- 9. South America Green Coffee Industry Analysis, Insights and Forecast, 2019-2031
- 9.1. Market Analysis, Insights and Forecast - by Production Analysis
- 9.2. Market Analysis, Insights and Forecast - by Consumption Analysis
- 9.3. Market Analysis, Insights and Forecast - by Import Market Analysis (Value & Volume)
- 9.4. Market Analysis, Insights and Forecast - by Export Market Analysis (Value & Volume)
- 9.5. Market Analysis, Insights and Forecast - by Price Trend Analysis
- 9.1. Market Analysis, Insights and Forecast - by Production Analysis
- 10. Middle East and Africa Green Coffee Industry Analysis, Insights and Forecast, 2019-2031
- 10.1. Market Analysis, Insights and Forecast - by Production Analysis
- 10.2. Market Analysis, Insights and Forecast - by Consumption Analysis
- 10.3. Market Analysis, Insights and Forecast - by Import Market Analysis (Value & Volume)
- 10.4. Market Analysis, Insights and Forecast - by Export Market Analysis (Value & Volume)
- 10.5. Market Analysis, Insights and Forecast - by Price Trend Analysis
- 10.1. Market Analysis, Insights and Forecast - by Production Analysis
- 11. North America Green Coffee Industry Analysis, Insights and Forecast, 2019-2031
- 11.1. Market Analysis, Insights and Forecast - By Country/Sub-region
- 11.1.1 United States
- 11.1.2 Canada
- 11.1.3 Mexico
- 12. Europe Green Coffee Industry Analysis, Insights and Forecast, 2019-2031
- 12.1. Market Analysis, Insights and Forecast - By Country/Sub-region
- 12.1.1 Germany
- 12.1.2 United Kingdom
- 12.1.3 France
- 12.1.4 Spain
- 12.1.5 Italy
- 12.1.6 Spain
- 12.1.7 Belgium
- 12.1.8 Netherland
- 12.1.9 Nordics
- 12.1.10 Rest of Europe
- 13. Asia Pacific Green Coffee Industry Analysis, Insights and Forecast, 2019-2031
- 13.1. Market Analysis, Insights and Forecast - By Country/Sub-region
- 13.1.1 China
- 13.1.2 Japan
- 13.1.3 India
- 13.1.4 South Korea
- 13.1.5 Southeast Asia
- 13.1.6 Australia
- 13.1.7 Indonesia
- 13.1.8 Phillipes
- 13.1.9 Singapore
- 13.1.10 Thailandc
- 13.1.11 Rest of Asia Pacific
- 14. South America Green Coffee Industry Analysis, Insights and Forecast, 2019-2031
- 14.1. Market Analysis, Insights and Forecast - By Country/Sub-region
- 14.1.1 Brazil
- 14.1.2 Argentina
- 14.1.3 Peru
- 14.1.4 Chile
- 14.1.5 Colombia
- 14.1.6 Ecuador
- 14.1.7 Venezuela
- 14.1.8 Rest of South America
- 15. MEA Green Coffee Industry Analysis, Insights and Forecast, 2019-2031
- 15.1. Market Analysis, Insights and Forecast - By Country/Sub-region
- 15.1.1 United Arab Emirates
- 15.1.2 Saudi Arabia
- 15.1.3 South Africa
- 15.1.4 Rest of Middle East and Africa
- 16. Competitive Analysis
- 16.1. Global Market Share Analysis 2024
- 16.2. Company Profiles
- 16.2.1 Keurig Dr Pepper
- 16.2.1.1. Overview
- 16.2.1.2. Products
- 16.2.1.3. SWOT Analysis
- 16.2.1.4. Recent Developments
- 16.2.1.5. Financials (Based on Availability)
- 16.2.2 Starbucks
- 16.2.2.1. Overview
- 16.2.2.2. Products
- 16.2.2.3. SWOT Analysis
- 16.2.2.4. Recent Developments
- 16.2.2.5. Financials (Based on Availability)
- 16.2.3 Nestlé
- 16.2.3.1. Overview
- 16.2.3.2. Products
- 16.2.3.3. SWOT Analysis
- 16.2.3.4. Recent Developments
- 16.2.3.5. Financials (Based on Availability)
- 16.2.4 Olam International
- 16.2.4.1. Overview
- 16.2.4.2. Products
- 16.2.4.3. SWOT Analysis
- 16.2.4.4. Recent Developments
- 16.2.4.5. Financials (Based on Availability)
- 16.2.5 Volcafe
- 16.2.5.1. Overview
- 16.2.5.2. Products
- 16.2.5.3. SWOT Analysis
- 16.2.5.4. Recent Developments
- 16.2.5.5. Financials (Based on Availability)
- 16.2.6 Jacobs Douwe Egberts
- 16.2.6.1. Overview
- 16.2.6.2. Products
- 16.2.6.3. SWOT Analysis
- 16.2.6.4. Recent Developments
- 16.2.6.5. Financials (Based on Availability)
- 16.2.7 Lavazza illycaffè
- 16.2.7.1. Overview
- 16.2.7.2. Products
- 16.2.7.3. SWOT Analysis
- 16.2.7.4. Recent Developments
- 16.2.7.5. Financials (Based on Availability)
- 16.2.8 J.M. Smucker
- 16.2.8.1. Overview
- 16.2.8.2. Products
- 16.2.8.3. SWOT Analysis
- 16.2.8.4. Recent Developments
- 16.2.8.5. Financials (Based on Availability)
- 16.2.9 Kraft Heinz
- 16.2.9.1. Overview
- 16.2.9.2. Products
- 16.2.9.3. SWOT Analysis
- 16.2.9.4. Recent Developments
- 16.2.9.5. Financials (Based on Availability)
- 16.2.1 Keurig Dr Pepper
List of Figures
- Figure 1: Global Green Coffee Industry Revenue Breakdown (Million, %) by Region 2024 & 2032
- Figure 2: North America Green Coffee Industry Revenue (Million), by Country 2024 & 2032
- Figure 3: North America Green Coffee Industry Revenue Share (%), by Country 2024 & 2032
- Figure 4: Europe Green Coffee Industry Revenue (Million), by Country 2024 & 2032
- Figure 5: Europe Green Coffee Industry Revenue Share (%), by Country 2024 & 2032
- Figure 6: Asia Pacific Green Coffee Industry Revenue (Million), by Country 2024 & 2032
- Figure 7: Asia Pacific Green Coffee Industry Revenue Share (%), by Country 2024 & 2032
- Figure 8: South America Green Coffee Industry Revenue (Million), by Country 2024 & 2032
- Figure 9: South America Green Coffee Industry Revenue Share (%), by Country 2024 & 2032
- Figure 10: MEA Green Coffee Industry Revenue (Million), by Country 2024 & 2032
- Figure 11: MEA Green Coffee Industry Revenue Share (%), by Country 2024 & 2032
- Figure 12: North America Green Coffee Industry Revenue (Million), by Production Analysis 2024 & 2032
- Figure 13: North America Green Coffee Industry Revenue Share (%), by Production Analysis 2024 & 2032
- Figure 14: North America Green Coffee Industry Revenue (Million), by Consumption Analysis 2024 & 2032
- Figure 15: North America Green Coffee Industry Revenue Share (%), by Consumption Analysis 2024 & 2032
- Figure 16: North America Green Coffee Industry Revenue (Million), by Import Market Analysis (Value & Volume) 2024 & 2032
- Figure 17: North America Green Coffee Industry Revenue Share (%), by Import Market Analysis (Value & Volume) 2024 & 2032
- Figure 18: North America Green Coffee Industry Revenue (Million), by Export Market Analysis (Value & Volume) 2024 & 2032
- Figure 19: North America Green Coffee Industry Revenue Share (%), by Export Market Analysis (Value & Volume) 2024 & 2032
- Figure 20: North America Green Coffee Industry Revenue (Million), by Price Trend Analysis 2024 & 2032
- Figure 21: North America Green Coffee Industry Revenue Share (%), by Price Trend Analysis 2024 & 2032
- Figure 22: North America Green Coffee Industry Revenue (Million), by Country 2024 & 2032
- Figure 23: North America Green Coffee Industry Revenue Share (%), by Country 2024 & 2032
- Figure 24: Europe Green Coffee Industry Revenue (Million), by Production Analysis 2024 & 2032
- Figure 25: Europe Green Coffee Industry Revenue Share (%), by Production Analysis 2024 & 2032
- Figure 26: Europe Green Coffee Industry Revenue (Million), by Consumption Analysis 2024 & 2032
- Figure 27: Europe Green Coffee Industry Revenue Share (%), by Consumption Analysis 2024 & 2032
- Figure 28: Europe Green Coffee Industry Revenue (Million), by Import Market Analysis (Value & Volume) 2024 & 2032
- Figure 29: Europe Green Coffee Industry Revenue Share (%), by Import Market Analysis (Value & Volume) 2024 & 2032
- Figure 30: Europe Green Coffee Industry Revenue (Million), by Export Market Analysis (Value & Volume) 2024 & 2032
- Figure 31: Europe Green Coffee Industry Revenue Share (%), by Export Market Analysis (Value & Volume) 2024 & 2032
- Figure 32: Europe Green Coffee Industry Revenue (Million), by Price Trend Analysis 2024 & 2032
- Figure 33: Europe Green Coffee Industry Revenue Share (%), by Price Trend Analysis 2024 & 2032
- Figure 34: Europe Green Coffee Industry Revenue (Million), by Country 2024 & 2032
- Figure 35: Europe Green Coffee Industry Revenue Share (%), by Country 2024 & 2032
- Figure 36: Asia Pacific Green Coffee Industry Revenue (Million), by Production Analysis 2024 & 2032
- Figure 37: Asia Pacific Green Coffee Industry Revenue Share (%), by Production Analysis 2024 & 2032
- Figure 38: Asia Pacific Green Coffee Industry Revenue (Million), by Consumption Analysis 2024 & 2032
- Figure 39: Asia Pacific Green Coffee Industry Revenue Share (%), by Consumption Analysis 2024 & 2032
- Figure 40: Asia Pacific Green Coffee Industry Revenue (Million), by Import Market Analysis (Value & Volume) 2024 & 2032
- Figure 41: Asia Pacific Green Coffee Industry Revenue Share (%), by Import Market Analysis (Value & Volume) 2024 & 2032
- Figure 42: Asia Pacific Green Coffee Industry Revenue (Million), by Export Market Analysis (Value & Volume) 2024 & 2032
- Figure 43: Asia Pacific Green Coffee Industry Revenue Share (%), by Export Market Analysis (Value & Volume) 2024 & 2032
- Figure 44: Asia Pacific Green Coffee Industry Revenue (Million), by Price Trend Analysis 2024 & 2032
- Figure 45: Asia Pacific Green Coffee Industry Revenue Share (%), by Price Trend Analysis 2024 & 2032
- Figure 46: Asia Pacific Green Coffee Industry Revenue (Million), by Country 2024 & 2032
- Figure 47: Asia Pacific Green Coffee Industry Revenue Share (%), by Country 2024 & 2032
- Figure 48: South America Green Coffee Industry Revenue (Million), by Production Analysis 2024 & 2032
- Figure 49: South America Green Coffee Industry Revenue Share (%), by Production Analysis 2024 & 2032
- Figure 50: South America Green Coffee Industry Revenue (Million), by Consumption Analysis 2024 & 2032
- Figure 51: South America Green Coffee Industry Revenue Share (%), by Consumption Analysis 2024 & 2032
- Figure 52: South America Green Coffee Industry Revenue (Million), by Import Market Analysis (Value & Volume) 2024 & 2032
- Figure 53: South America Green Coffee Industry Revenue Share (%), by Import Market Analysis (Value & Volume) 2024 & 2032
- Figure 54: South America Green Coffee Industry Revenue (Million), by Export Market Analysis (Value & Volume) 2024 & 2032
- Figure 55: South America Green Coffee Industry Revenue Share (%), by Export Market Analysis (Value & Volume) 2024 & 2032
- Figure 56: South America Green Coffee Industry Revenue (Million), by Price Trend Analysis 2024 & 2032
- Figure 57: South America Green Coffee Industry Revenue Share (%), by Price Trend Analysis 2024 & 2032
- Figure 58: South America Green Coffee Industry Revenue (Million), by Country 2024 & 2032
- Figure 59: South America Green Coffee Industry Revenue Share (%), by Country 2024 & 2032
- Figure 60: Middle East and Africa Green Coffee Industry Revenue (Million), by Production Analysis 2024 & 2032
- Figure 61: Middle East and Africa Green Coffee Industry Revenue Share (%), by Production Analysis 2024 & 2032
- Figure 62: Middle East and Africa Green Coffee Industry Revenue (Million), by Consumption Analysis 2024 & 2032
- Figure 63: Middle East and Africa Green Coffee Industry Revenue Share (%), by Consumption Analysis 2024 & 2032
- Figure 64: Middle East and Africa Green Coffee Industry Revenue (Million), by Import Market Analysis (Value & Volume) 2024 & 2032
- Figure 65: Middle East and Africa Green Coffee Industry Revenue Share (%), by Import Market Analysis (Value & Volume) 2024 & 2032
- Figure 66: Middle East and Africa Green Coffee Industry Revenue (Million), by Export Market Analysis (Value & Volume) 2024 & 2032
- Figure 67: Middle East and Africa Green Coffee Industry Revenue Share (%), by Export Market Analysis (Value & Volume) 2024 & 2032
- Figure 68: Middle East and Africa Green Coffee Industry Revenue (Million), by Price Trend Analysis 2024 & 2032
- Figure 69: Middle East and Africa Green Coffee Industry Revenue Share (%), by Price Trend Analysis 2024 & 2032
- Figure 70: Middle East and Africa Green Coffee Industry Revenue (Million), by Country 2024 & 2032
- Figure 71: Middle East and Africa Green Coffee Industry Revenue Share (%), by Country 2024 & 2032
List of Tables
- Table 1: Global Green Coffee Industry Revenue Million Forecast, by Region 2019 & 2032
- Table 2: Global Green Coffee Industry Revenue Million Forecast, by Production Analysis 2019 & 2032
- Table 3: Global Green Coffee Industry Revenue Million Forecast, by Consumption Analysis 2019 & 2032
- Table 4: Global Green Coffee Industry Revenue Million Forecast, by Import Market Analysis (Value & Volume) 2019 & 2032
- Table 5: Global Green Coffee Industry Revenue Million Forecast, by Export Market Analysis (Value & Volume) 2019 & 2032
- Table 6: Global Green Coffee Industry Revenue Million Forecast, by Price Trend Analysis 2019 & 2032
- Table 7: Global Green Coffee Industry Revenue Million Forecast, by Region 2019 & 2032
- Table 8: Global Green Coffee Industry Revenue Million Forecast, by Country 2019 & 2032
- Table 9: United States Green Coffee Industry Revenue (Million) Forecast, by Application 2019 & 2032
- Table 10: Canada Green Coffee Industry Revenue (Million) Forecast, by Application 2019 & 2032
- Table 11: Mexico Green Coffee Industry Revenue (Million) Forecast, by Application 2019 & 2032
- Table 12: Global Green Coffee Industry Revenue Million Forecast, by Country 2019 & 2032
- Table 13: Germany Green Coffee Industry Revenue (Million) Forecast, by Application 2019 & 2032
- Table 14: United Kingdom Green Coffee Industry Revenue (Million) Forecast, by Application 2019 & 2032
- Table 15: France Green Coffee Industry Revenue (Million) Forecast, by Application 2019 & 2032
- Table 16: Spain Green Coffee Industry Revenue (Million) Forecast, by Application 2019 & 2032
- Table 17: Italy Green Coffee Industry Revenue (Million) Forecast, by Application 2019 & 2032
- Table 18: Spain Green Coffee Industry Revenue (Million) Forecast, by Application 2019 & 2032
- Table 19: Belgium Green Coffee Industry Revenue (Million) Forecast, by Application 2019 & 2032
- Table 20: Netherland Green Coffee Industry Revenue (Million) Forecast, by Application 2019 & 2032
- Table 21: Nordics Green Coffee Industry Revenue (Million) Forecast, by Application 2019 & 2032
- Table 22: Rest of Europe Green Coffee Industry Revenue (Million) Forecast, by Application 2019 & 2032
- Table 23: Global Green Coffee Industry Revenue Million Forecast, by Country 2019 & 2032
- Table 24: China Green Coffee Industry Revenue (Million) Forecast, by Application 2019 & 2032
- Table 25: Japan Green Coffee Industry Revenue (Million) Forecast, by Application 2019 & 2032
- Table 26: India Green Coffee Industry Revenue (Million) Forecast, by Application 2019 & 2032
- Table 27: South Korea Green Coffee Industry Revenue (Million) Forecast, by Application 2019 & 2032
- Table 28: Southeast Asia Green Coffee Industry Revenue (Million) Forecast, by Application 2019 & 2032
- Table 29: Australia Green Coffee Industry Revenue (Million) Forecast, by Application 2019 & 2032
- Table 30: Indonesia Green Coffee Industry Revenue (Million) Forecast, by Application 2019 & 2032
- Table 31: Phillipes Green Coffee Industry Revenue (Million) Forecast, by Application 2019 & 2032
- Table 32: Singapore Green Coffee Industry Revenue (Million) Forecast, by Application 2019 & 2032
- Table 33: Thailandc Green Coffee Industry Revenue (Million) Forecast, by Application 2019 & 2032
- Table 34: Rest of Asia Pacific Green Coffee Industry Revenue (Million) Forecast, by Application 2019 & 2032
- Table 35: Global Green Coffee Industry Revenue Million Forecast, by Country 2019 & 2032
- Table 36: Brazil Green Coffee Industry Revenue (Million) Forecast, by Application 2019 & 2032
- Table 37: Argentina Green Coffee Industry Revenue (Million) Forecast, by Application 2019 & 2032
- Table 38: Peru Green Coffee Industry Revenue (Million) Forecast, by Application 2019 & 2032
- Table 39: Chile Green Coffee Industry Revenue (Million) Forecast, by Application 2019 & 2032
- Table 40: Colombia Green Coffee Industry Revenue (Million) Forecast, by Application 2019 & 2032
- Table 41: Ecuador Green Coffee Industry Revenue (Million) Forecast, by Application 2019 & 2032
- Table 42: Venezuela Green Coffee Industry Revenue (Million) Forecast, by Application 2019 & 2032
- Table 43: Rest of South America Green Coffee Industry Revenue (Million) Forecast, by Application 2019 & 2032
- Table 44: Global Green Coffee Industry Revenue Million Forecast, by Country 2019 & 2032
- Table 45: United Arab Emirates Green Coffee Industry Revenue (Million) Forecast, by Application 2019 & 2032
- Table 46: Saudi Arabia Green Coffee Industry Revenue (Million) Forecast, by Application 2019 & 2032
- Table 47: South Africa Green Coffee Industry Revenue (Million) Forecast, by Application 2019 & 2032
- Table 48: Rest of Middle East and Africa Green Coffee Industry Revenue (Million) Forecast, by Application 2019 & 2032
- Table 49: Global Green Coffee Industry Revenue Million Forecast, by Production Analysis 2019 & 2032
- Table 50: Global Green Coffee Industry Revenue Million Forecast, by Consumption Analysis 2019 & 2032
- Table 51: Global Green Coffee Industry Revenue Million Forecast, by Import Market Analysis (Value & Volume) 2019 & 2032
- Table 52: Global Green Coffee Industry Revenue Million Forecast, by Export Market Analysis (Value & Volume) 2019 & 2032
- Table 53: Global Green Coffee Industry Revenue Million Forecast, by Price Trend Analysis 2019 & 2032
- Table 54: Global Green Coffee Industry Revenue Million Forecast, by Country 2019 & 2032
- Table 55: United States Green Coffee Industry Revenue (Million) Forecast, by Application 2019 & 2032
- Table 56: Canada Green Coffee Industry Revenue (Million) Forecast, by Application 2019 & 2032
- Table 57: Mexico Green Coffee Industry Revenue (Million) Forecast, by Application 2019 & 2032
- Table 58: Global Green Coffee Industry Revenue Million Forecast, by Production Analysis 2019 & 2032
- Table 59: Global Green Coffee Industry Revenue Million Forecast, by Consumption Analysis 2019 & 2032
- Table 60: Global Green Coffee Industry Revenue Million Forecast, by Import Market Analysis (Value & Volume) 2019 & 2032
- Table 61: Global Green Coffee Industry Revenue Million Forecast, by Export Market Analysis (Value & Volume) 2019 & 2032
- Table 62: Global Green Coffee Industry Revenue Million Forecast, by Price Trend Analysis 2019 & 2032
- Table 63: Global Green Coffee Industry Revenue Million Forecast, by Country 2019 & 2032
- Table 64: Germany Green Coffee Industry Revenue (Million) Forecast, by Application 2019 & 2032
- Table 65: United Kingdom Green Coffee Industry Revenue (Million) Forecast, by Application 2019 & 2032
- Table 66: Spain Green Coffee Industry Revenue (Million) Forecast, by Application 2019 & 2032
- Table 67: France Green Coffee Industry Revenue (Million) Forecast, by Application 2019 & 2032
- Table 68: Italy Green Coffee Industry Revenue (Million) Forecast, by Application 2019 & 2032
- Table 69: Belgium Green Coffee Industry Revenue (Million) Forecast, by Application 2019 & 2032
- Table 70: Russia Green Coffee Industry Revenue (Million) Forecast, by Application 2019 & 2032
- Table 71: Global Green Coffee Industry Revenue Million Forecast, by Production Analysis 2019 & 2032
- Table 72: Global Green Coffee Industry Revenue Million Forecast, by Consumption Analysis 2019 & 2032
- Table 73: Global Green Coffee Industry Revenue Million Forecast, by Import Market Analysis (Value & Volume) 2019 & 2032
- Table 74: Global Green Coffee Industry Revenue Million Forecast, by Export Market Analysis (Value & Volume) 2019 & 2032
- Table 75: Global Green Coffee Industry Revenue Million Forecast, by Price Trend Analysis 2019 & 2032
- Table 76: Global Green Coffee Industry Revenue Million Forecast, by Country 2019 & 2032
- Table 77: China Green Coffee Industry Revenue (Million) Forecast, by Application 2019 & 2032
- Table 78: Vietnam Green Coffee Industry Revenue (Million) Forecast, by Application 2019 & 2032
- Table 79: Indonesia Green Coffee Industry Revenue (Million) Forecast, by Application 2019 & 2032
- Table 80: India Green Coffee Industry Revenue (Million) Forecast, by Application 2019 & 2032
- Table 81: Japan Green Coffee Industry Revenue (Million) Forecast, by Application 2019 & 2032
- Table 82: Global Green Coffee Industry Revenue Million Forecast, by Production Analysis 2019 & 2032
- Table 83: Global Green Coffee Industry Revenue Million Forecast, by Consumption Analysis 2019 & 2032
- Table 84: Global Green Coffee Industry Revenue Million Forecast, by Import Market Analysis (Value & Volume) 2019 & 2032
- Table 85: Global Green Coffee Industry Revenue Million Forecast, by Export Market Analysis (Value & Volume) 2019 & 2032
- Table 86: Global Green Coffee Industry Revenue Million Forecast, by Price Trend Analysis 2019 & 2032
- Table 87: Global Green Coffee Industry Revenue Million Forecast, by Country 2019 & 2032
- Table 88: Brazil Green Coffee Industry Revenue (Million) Forecast, by Application 2019 & 2032
- Table 89: Colombia Green Coffee Industry Revenue (Million) Forecast, by Application 2019 & 2032
- Table 90: Global Green Coffee Industry Revenue Million Forecast, by Production Analysis 2019 & 2032
- Table 91: Global Green Coffee Industry Revenue Million Forecast, by Consumption Analysis 2019 & 2032
- Table 92: Global Green Coffee Industry Revenue Million Forecast, by Import Market Analysis (Value & Volume) 2019 & 2032
- Table 93: Global Green Coffee Industry Revenue Million Forecast, by Export Market Analysis (Value & Volume) 2019 & 2032
- Table 94: Global Green Coffee Industry Revenue Million Forecast, by Price Trend Analysis 2019 & 2032
- Table 95: Global Green Coffee Industry Revenue Million Forecast, by Country 2019 & 2032
- Table 96: Uganda Green Coffee Industry Revenue (Million) Forecast, by Application 2019 & 2032
- Table 97: Ethiopia Green Coffee Industry Revenue (Million) Forecast, by Application 2019 & 2032
Frequently Asked Questions
1. What is the projected Compound Annual Growth Rate (CAGR) of the Green Coffee Industry?
The projected CAGR is approximately 6.00%.
2. Which companies are prominent players in the Green Coffee Industry?
Key companies in the market include Keurig Dr Pepper , Starbucks , Nestlé , Olam International , Volcafe, Jacobs Douwe Egberts , Lavazza illycaffè , J.M. Smucker , Kraft Heinz .
3. What are the main segments of the Green Coffee Industry?
The market segments include Production Analysis, Consumption Analysis, Import Market Analysis (Value & Volume), Export Market Analysis (Value & Volume), Price Trend Analysis.
4. Can you provide details about the market size?
The market size is estimated to be USD 35.33 Million as of 2022.
5. What are some drivers contributing to market growth?
Increasing Berry Consumption for Health Benefits; Increasing Adoption of High-Technology Farm Practices; Growing Usage of Berries in the Food and Beverage Industries.
6. What are the notable trends driving market growth?
Increasing Demand for Certified Coffee.
7. Are there any restraints impacting market growth?
High Production Cost Involved in Berry Production; Increasing Disease and Pest Infestations.
8. Can you provide examples of recent developments in the market?
July 2022: The Ethiopian Coffee and Tea Authority (ECTA) released a new, comprehensive strategy for the country's coffee sector, which was developed in collaboration with the Ethiopian Institute of Agriculture Research (EIAR) and international nonprofit TechnoServe to increase coffee production by three times within next 10 years.
9. What pricing options are available for accessing the report?
Pricing options include single-user, multi-user, and enterprise licenses priced at USD 4750, USD 5250, and USD 8750 respectively.
10. Is the market size provided in terms of value or volume?
The market size is provided in terms of value, measured in Million.
11. Are there any specific market keywords associated with the report?
Yes, the market keyword associated with the report is "Green Coffee Industry," which aids in identifying and referencing the specific market segment covered.
12. How do I determine which pricing option suits my needs best?
The pricing options vary based on user requirements and access needs. Individual users may opt for single-user licenses, while businesses requiring broader access may choose multi-user or enterprise licenses for cost-effective access to the report.
13. Are there any additional resources or data provided in the Green Coffee Industry report?
While the report offers comprehensive insights, it's advisable to review the specific contents or supplementary materials provided to ascertain if additional resources or data are available.
14. How can I stay updated on further developments or reports in the Green Coffee Industry?
To stay informed about further developments, trends, and reports in the Green Coffee Industry, consider subscribing to industry newsletters, following relevant companies and organizations, or regularly checking reputable industry news sources and publications.
Methodology
Step 1 - Identification of Relevant Samples Size from Population Database


Step 2 - Approaches for Defining Global Market Size (Value, Volume* & Price*)

Note*: In applicable scenarios
Step 3 - Data Sources
Primary Research
- Web Analytics
- Survey Reports
- Research Institute
- Latest Research Reports
- Opinion Leaders
Secondary Research
- Annual Reports
- White Paper
- Latest Press Release
- Industry Association
- Paid Database
- Investor Presentations

Step 4 - Data Triangulation
Involves using different sources of information in order to increase the validity of a study
These sources are likely to be stakeholders in a program - participants, other researchers, program staff, other community members, and so on.
Then we put all data in single framework & apply various statistical tools to find out the dynamic on the market.
During the analysis stage, feedback from the stakeholder groups would be compared to determine areas of agreement as well as areas of divergence
