

Key Insights
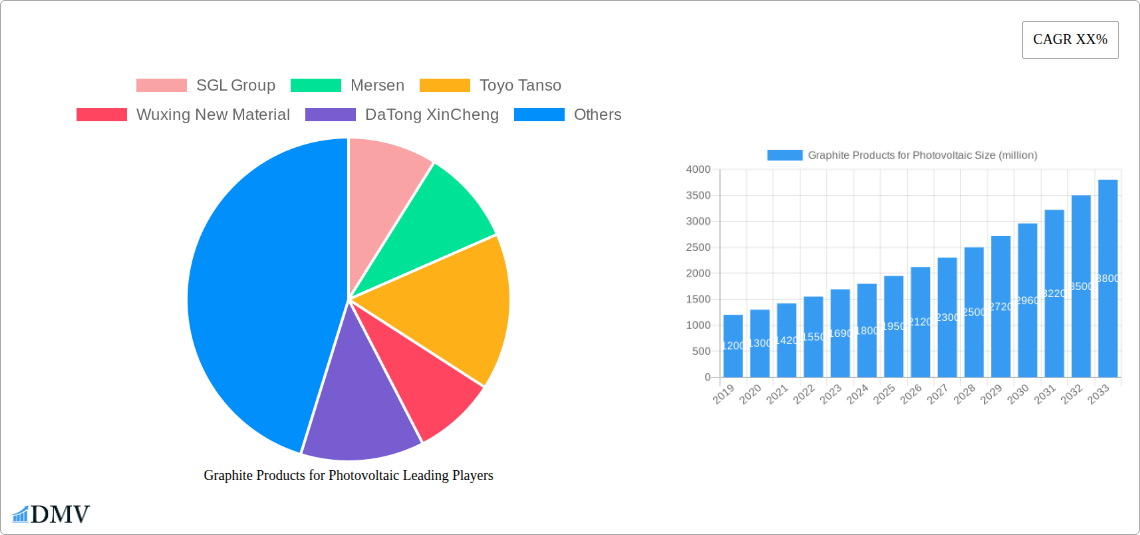
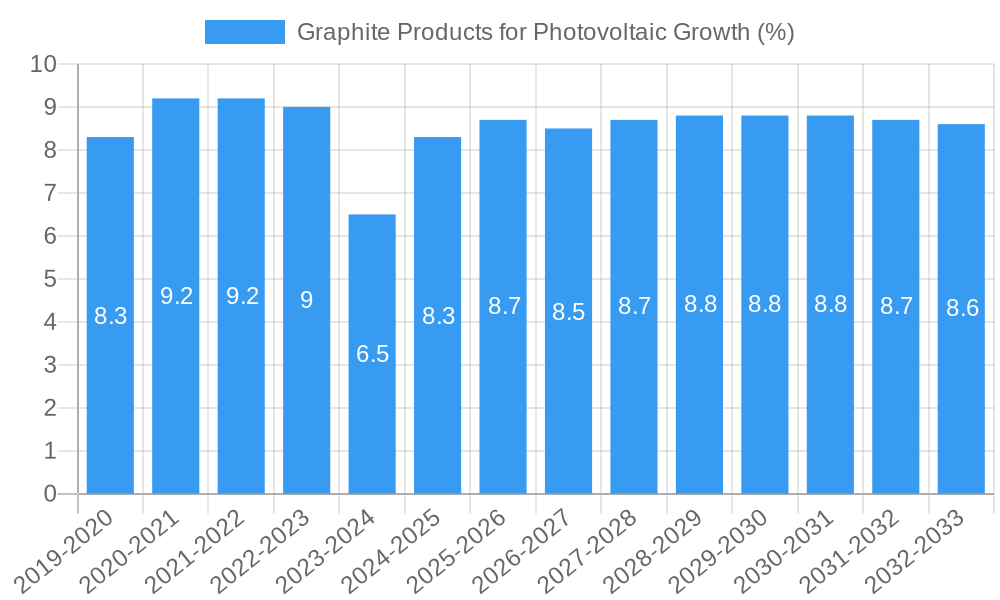
The global market for Graphite Products for Photovoltaics is poised for substantial growth, driven by the burgeoning renewable energy sector and the increasing demand for solar power installations. Estimated to be valued at approximately $1.8 billion in 2025, the market is projected to expand at a Compound Annual Growth Rate (CAGR) of around 9.5% through 2033. This robust growth is primarily fueled by the critical role graphite plays in the production of photovoltaic cells, particularly in the manufacturing of silicon ingots and wafers. The escalating adoption of solar energy as a clean and sustainable alternative to fossil fuels, coupled with supportive government policies and declining solar panel costs, are significant drivers. Emerging economies, particularly in Asia Pacific, are leading this expansion, with China and India at the forefront of both production and consumption of solar energy technologies. The market is further segmented by application into Monocrystalline Silicon and Polysilicon, with Monocrystalline Silicon holding a dominant share due to its higher efficiency and widespread adoption. In terms of types, Extruded Graphite, Molded Graphite, and Isotropic Graphite all cater to specific manufacturing processes, with the choice often dictated by performance requirements and cost-effectiveness.
Despite the overwhelmingly positive growth trajectory, the market faces certain restraints. The volatile raw material prices, particularly for high-purity graphite, can impact production costs and profit margins for manufacturers. Additionally, intense competition among key players, including SGL Group, Mersen, Toyo Tanso, and Fangda Carbon, necessitates continuous innovation and cost optimization to maintain market share. Stringent environmental regulations related to graphite mining and processing, while essential for sustainability, can also add to operational complexities and costs. However, these challenges are largely overshadowed by the immense opportunities presented by technological advancements in solar energy, such as the development of more efficient solar cells and energy storage solutions, which will further bolster the demand for high-performance graphite products. The increasing investment in research and development by leading companies is expected to introduce novel graphite materials and manufacturing techniques, further solidifying the market's future.
Graphite Products for Photovoltaic Market Composition & Trends
This comprehensive report delves into the dynamic graphite products for photovoltaic (PV) market, offering an in-depth analysis of its structure, key trends, and future trajectory. We dissect market concentration, revealing the dominant players and their respective market share distribution within this critical solar energy supply chain. Innovation catalysts, including advancements in monocrystalline silicon and polysilicon production technologies, are meticulously examined. The report also scrutinizes the evolving regulatory landscapes impacting graphite production and PV manufacturing, alongside an evaluation of substitute products and their potential to disrupt the market. Understanding end-user profiles, from large-scale solar farm developers to residential installers, is paramount, and this report provides detailed insights. Furthermore, we analyze the impact of M&A activities within the sector, including M&A deal values totaling an estimated XX million historically, shaping the competitive arena. Emerging trends in extruded graphite, molded graphite, and isotropic graphite are also highlighted.
- Market Concentration: Analysis of key players' market dominance, with an estimated historical market share of top 5 companies at XX%.
- Innovation Catalysts: Focus on technological breakthroughs in graphite material science and PV manufacturing processes.
- Regulatory Landscapes: Examination of environmental regulations and trade policies affecting graphite sourcing and PV production.
- Substitute Products: Assessment of potential alternatives and their market penetration.
- End-User Profiles: Detailed segmentation of PV market stakeholders and their specific graphite product needs.
- M&A Activities: Tracking of strategic acquisitions and partnerships with an estimated historical deal value of XX million.
Graphite Products for Photovoltaic Industry Evolution
The graphite products for photovoltaic industry is on an accelerated growth trajectory, driven by the global imperative for clean energy solutions. This report meticulously traces the market growth trajectories of graphite components essential for the production of solar cells and modules. We analyze the pivotal role of technological advancements in enhancing the performance and cost-effectiveness of PV manufacturing, from refined polysilicon purification techniques to advanced methods for producing high-quality monocrystalline silicon. The report quantifies the impact of these innovations, projecting a compound annual growth rate (CAGR) of XX% for the graphite products for photovoltaic market during the forecast period. Shifting consumer demands, characterized by an increasing preference for higher efficiency solar panels and a growing awareness of sustainability, are also thoroughly examined. Adoption metrics for different types of graphite, including extruded graphite, molded graphite, and isotropic graphite, are presented with historical data from 2019–2024 and projections extending to 2033. The study identifies key inflection points in industry evolution, such as the transition towards larger wafer sizes and improved manufacturing yields, directly influencing the demand for specialized graphite products. The base year of 2025 is analyzed in detail, providing a snapshot of the market's current state before projecting its future growth.
Leading Regions, Countries, or Segments in Graphite Products for Photovoltaic
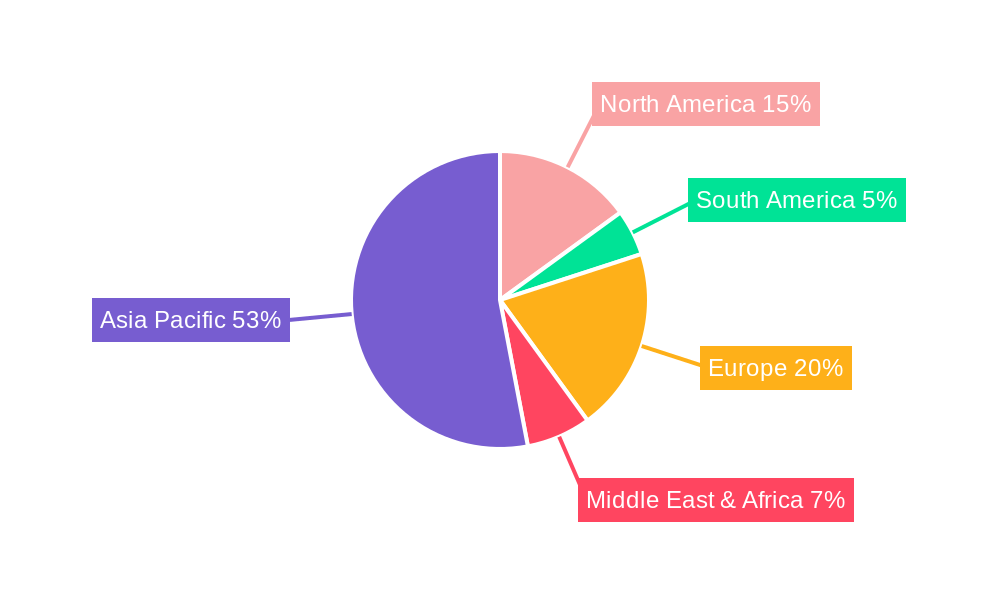
This section meticulously identifies and analyzes the dominant forces shaping the graphite products for photovoltaic market. The report highlights the unparalleled leadership of Asia Pacific, particularly China, in both graphite production and photovoltaic manufacturing, driven by substantial government support, a robust industrial ecosystem, and massive domestic demand for solar energy. The application segment of Monocrystalline Silicon production is unequivocally leading the charge, accounting for an estimated XX% of the total graphite product consumption within the PV sector. This dominance is fueled by the superior efficiency and increasing adoption of monocrystalline solar panels globally.
Within the types of graphite products, Isotropic Graphite is emerging as a critical component, offering superior thermal conductivity and uniformity essential for high-performance PV manufacturing. Its market share is projected to grow at a significant CAGR of XX% during the forecast period. This growth is attributed to its indispensable role in advanced ingot growth processes for both monocrystalline and high-quality polycrystalline silicon.
- Dominant Region: Asia Pacific:
- Key Drivers: Extensive government incentives for solar energy adoption, significant manufacturing capacity for solar cells and modules, lower production costs, and a massive domestic market. China's role as the "world's factory" for solar components is a major factor.
- Investment Trends: Substantial investments in R&D and production expansion by both graphite material suppliers and PV manufacturers in countries like China, South Korea, and Taiwan.
- Regulatory Support: Favorable policies and subsidies promoting renewable energy deployment directly stimulate demand for PV manufacturing and, consequently, graphite products.
- Leading Application: Monocrystalline Silicon:
- Dominance Factors: Higher solar cell efficiency compared to polycrystalline silicon, leading to increased adoption in utility-scale and residential solar projects. The trend towards larger wafer sizes further amplifies the demand for high-quality graphite components in Czochralski (CZ) growth crucibles and related equipment.
- Growth Trajectory: Expected to maintain its lead with a projected market share of XX% by 2033, driven by continuous technological improvements and cost reductions in monocrystalline silicon production.
- Emerging Graphite Type: Isotropic Graphite:
- Significance: Its uniform structure and excellent thermal properties make it indispensable for advanced PV manufacturing processes, particularly for high-purity silicon ingot growth.
- Adoption Metrics: Witnessing a rising adoption rate, with its market share expected to reach XX% by 2033, surpassing traditional extruded and molded graphite in critical applications.
- Technological Advancements: Innovations in isotropic graphite production are enhancing its purity and mechanical strength, making it more suitable for increasingly demanding PV manufacturing environments.
Graphite Products for Photovoltaic Product Innovations
The graphite products for photovoltaic industry is witnessing significant innovation focused on enhancing performance, durability, and cost-effectiveness. Manufacturers are developing advanced isotropic graphite grades with ultra-high purity and improved thermal conductivity, crucial for the efficient growth of large-diameter monocrystalline silicon ingots. Innovations in extruded graphite include enhanced surface treatments and precise machining techniques to minimize silicon melt contamination and improve ingot yield. Furthermore, the development of specialized graphite composite materials for crucible linings is extending their lifespan and reducing operational costs for polysilicon production. These advancements directly contribute to lower manufacturing costs for solar panels and higher energy conversion efficiencies, making solar power more competitive.
Propelling Factors for Graphite Products for Photovoltaic Growth
The relentless global push towards decarbonization and renewable energy sources serves as the primary engine for the graphite products for photovoltaic growth. Government policies worldwide, including subsidies, tax incentives, and renewable energy targets, are significantly bolstering the demand for photovoltaic modules, thereby driving the need for essential graphite components. Technological advancements in solar cell efficiency, particularly the continued dominance and innovation in monocrystalline silicon production, necessitate high-performance isotropic graphite and specialized crucible designs. Economic factors, such as the declining cost of solar installations and the increasing price competitiveness of PV electricity, are accelerating market adoption. Furthermore, the growing awareness among consumers and corporations regarding environmental sustainability is fostering a demand for clean energy solutions, directly benefiting the entire solar value chain, including graphite suppliers.
Obstacles in the Graphite Products for Photovoltaic Market
Despite robust growth, the graphite products for photovoltaic market faces several significant obstacles. Stringent environmental regulations surrounding graphite mining and processing can lead to increased operational costs and potential supply chain disruptions. The geopolitical landscape and reliance on specific regions for raw materials can introduce price volatility and security concerns for graphite sourcing. Furthermore, intense competition within the graphite manufacturing sector, coupled with the need for continuous investment in advanced production technologies for high-purity isotropic graphite, can create margin pressures. Supply chain disruptions, exacerbated by global events, can impact the availability and timely delivery of critical graphite components, potentially slowing down PV manufacturing expansion.
Future Opportunities in Graphite Products for Photovoltaic
The graphite products for photovoltaic market is ripe with emerging opportunities. The continuous drive for higher solar cell efficiencies will fuel demand for next-generation isotropic graphite and advanced composite materials. Expansion into new geographical markets with nascent solar industries presents significant growth potential for graphite suppliers. The development of bifacial solar panels and perovskite solar cells, which require specialized graphite components, offers new avenues for product innovation and market penetration. Furthermore, the increasing focus on recycling and sustainability within the PV industry could lead to opportunities in developing and supplying graphite materials derived from recycled sources.
Major Players in the Graphite Products for Photovoltaic Ecosystem
- SGL Group
- Mersen
- Toyo Tanso
- Wuxing New Material
- DaTong XinCheng
- Tokai Carbon
- Jiangxi Ningxin New Materials
- IBIDEN
- Pingdingshan Oriental Carbon
- Nippon Carbon
- Fangda Carbon
- Pingdingshan Boxiang Carbon
- Sinosteel
- Dahua Glory Special Graphite
- Graphite India Ltd
- Entegris
- Kaiyuan Special Graphite
- Zhongnan Diamond
- SEC Carbon
- Qingdao Tennry Carbon
- Morgan
- GrafTech
Key Developments in Graphite Products for Photovoltaic Industry
- 2023/XX: Launch of new ultra-high purity isotropic graphite grades by major manufacturers, enabling higher silicon ingot yields for monocrystalline silicon production.
- 2023/XX: Significant M&A activity as leading graphite producers consolidate to enhance market share and R&D capabilities, with deals valued at approximately XX million.
- 2024/XX: Advancements in graphite processing techniques leading to reduced manufacturing costs for extruded graphite used in polysilicon production.
- 2024/XX: Increased focus on sustainable graphite sourcing and recycling initiatives within the photovoltaic supply chain.
- 2025/XX: Introduction of novel graphite composite materials for enhanced thermal management in next-generation PV manufacturing equipment.
- 2025/XX: Growing demand for specialized graphite components for emerging solar technologies like perovskite solar cells.
- 2026/XX: Expansion of production capacities by key players in Asia Pacific to meet the escalating global demand for solar energy.
- 2027/XX: Development of graphite materials with improved resistance to chemical corrosion for extended crucible lifespan.
- 2028/XX: Strategic partnerships formed between graphite suppliers and PV module manufacturers to co-develop customized solutions.
- 2029/XX: Emergence of new market entrants focusing on niche applications of graphite in advanced photovoltaic technologies.
- 2030/XX: Continued innovation in graphite machining and finishing to achieve tighter tolerances for high-efficiency PV production.
- 2031/XX: Growing adoption of isotropic graphite in large-scale solar farm projects due to its superior performance and reliability.
- 2032/XX: Increased investment in R&D for developing biodegradable or more environmentally friendly graphite alternatives.
- 2033/XX: Projections indicate sustained strong demand for all types of graphite products as solar energy continues its global expansion.
Strategic Graphite Products for Photovoltaic Market Forecast
The graphite products for photovoltaic market is poised for significant and sustained growth, driven by the global energy transition and the declining cost of solar power. Key growth catalysts include ongoing technological advancements in monocrystalline silicon and polysilicon production, requiring increasingly sophisticated isotropic graphite and specialized components. Favorable government policies and a rising environmental consciousness worldwide are propelling demand for photovoltaic installations, directly impacting the need for graphite. Emerging opportunities in new solar technologies and geographical markets, coupled with strategic investments and M&A activities, will further shape the market landscape. The forecast indicates a robust expansion, with the market's potential to reach an estimated value of XX million by 2033.
Graphite Products for Photovoltaic Segmentation
-
1. Application
- 1.1. Monocrystalline Silicon
- 1.2. Polysilicon
-
2. Types
- 2.1. Extruded Graphite
- 2.2. Molded Graphite
- 2.3. Isotropic Graphite
Graphite Products for Photovoltaic Segmentation By Geography
-
1. North America
- 1.1. United States
- 1.2. Canada
- 1.3. Mexico
-
2. South America
- 2.1. Brazil
- 2.2. Argentina
- 2.3. Rest of South America
-
3. Europe
- 3.1. United Kingdom
- 3.2. Germany
- 3.3. France
- 3.4. Italy
- 3.5. Spain
- 3.6. Russia
- 3.7. Benelux
- 3.8. Nordics
- 3.9. Rest of Europe
-
4. Middle East & Africa
- 4.1. Turkey
- 4.2. Israel
- 4.3. GCC
- 4.4. North Africa
- 4.5. South Africa
- 4.6. Rest of Middle East & Africa
-
5. Asia Pacific
- 5.1. China
- 5.2. India
- 5.3. Japan
- 5.4. South Korea
- 5.5. ASEAN
- 5.6. Oceania
- 5.7. Rest of Asia Pacific
Graphite Products for Photovoltaic REPORT HIGHLIGHTS
| Aspects | Details |
|---|---|
| Study Period | 2019-2033 |
| Base Year | 2024 |
| Estimated Year | 2025 |
| Forecast Period | 2025-2033 |
| Historical Period | 2019-2024 |
| Growth Rate | CAGR of XX% from 2019-2033 |
| Segmentation |
|
Table of Contents
- 1. Introduction
- 1.1. Research Scope
- 1.2. Market Segmentation
- 1.3. Research Methodology
- 1.4. Definitions and Assumptions
- 2. Executive Summary
- 2.1. Introduction
- 3. Market Dynamics
- 3.1. Introduction
- 3.2. Market Drivers
- 3.3. Market Restrains
- 3.4. Market Trends
- 4. Market Factor Analysis
- 4.1. Porters Five Forces
- 4.2. Supply/Value Chain
- 4.3. PESTEL analysis
- 4.4. Market Entropy
- 4.5. Patent/Trademark Analysis
- 5. Global Graphite Products for Photovoltaic Analysis, Insights and Forecast, 2019-2031
- 5.1. Market Analysis, Insights and Forecast - by Application
- 5.1.1. Monocrystalline Silicon
- 5.1.2. Polysilicon
- 5.2. Market Analysis, Insights and Forecast - by Types
- 5.2.1. Extruded Graphite
- 5.2.2. Molded Graphite
- 5.2.3. Isotropic Graphite
- 5.3. Market Analysis, Insights and Forecast - by Region
- 5.3.1. North America
- 5.3.2. South America
- 5.3.3. Europe
- 5.3.4. Middle East & Africa
- 5.3.5. Asia Pacific
- 5.1. Market Analysis, Insights and Forecast - by Application
- 6. North America Graphite Products for Photovoltaic Analysis, Insights and Forecast, 2019-2031
- 6.1. Market Analysis, Insights and Forecast - by Application
- 6.1.1. Monocrystalline Silicon
- 6.1.2. Polysilicon
- 6.2. Market Analysis, Insights and Forecast - by Types
- 6.2.1. Extruded Graphite
- 6.2.2. Molded Graphite
- 6.2.3. Isotropic Graphite
- 6.1. Market Analysis, Insights and Forecast - by Application
- 7. South America Graphite Products for Photovoltaic Analysis, Insights and Forecast, 2019-2031
- 7.1. Market Analysis, Insights and Forecast - by Application
- 7.1.1. Monocrystalline Silicon
- 7.1.2. Polysilicon
- 7.2. Market Analysis, Insights and Forecast - by Types
- 7.2.1. Extruded Graphite
- 7.2.2. Molded Graphite
- 7.2.3. Isotropic Graphite
- 7.1. Market Analysis, Insights and Forecast - by Application
- 8. Europe Graphite Products for Photovoltaic Analysis, Insights and Forecast, 2019-2031
- 8.1. Market Analysis, Insights and Forecast - by Application
- 8.1.1. Monocrystalline Silicon
- 8.1.2. Polysilicon
- 8.2. Market Analysis, Insights and Forecast - by Types
- 8.2.1. Extruded Graphite
- 8.2.2. Molded Graphite
- 8.2.3. Isotropic Graphite
- 8.1. Market Analysis, Insights and Forecast - by Application
- 9. Middle East & Africa Graphite Products for Photovoltaic Analysis, Insights and Forecast, 2019-2031
- 9.1. Market Analysis, Insights and Forecast - by Application
- 9.1.1. Monocrystalline Silicon
- 9.1.2. Polysilicon
- 9.2. Market Analysis, Insights and Forecast - by Types
- 9.2.1. Extruded Graphite
- 9.2.2. Molded Graphite
- 9.2.3. Isotropic Graphite
- 9.1. Market Analysis, Insights and Forecast - by Application
- 10. Asia Pacific Graphite Products for Photovoltaic Analysis, Insights and Forecast, 2019-2031
- 10.1. Market Analysis, Insights and Forecast - by Application
- 10.1.1. Monocrystalline Silicon
- 10.1.2. Polysilicon
- 10.2. Market Analysis, Insights and Forecast - by Types
- 10.2.1. Extruded Graphite
- 10.2.2. Molded Graphite
- 10.2.3. Isotropic Graphite
- 10.1. Market Analysis, Insights and Forecast - by Application
- 11. Competitive Analysis
- 11.1. Global Market Share Analysis 2024
- 11.2. Company Profiles
- 11.2.1 SGL Group
- 11.2.1.1. Overview
- 11.2.1.2. Products
- 11.2.1.3. SWOT Analysis
- 11.2.1.4. Recent Developments
- 11.2.1.5. Financials (Based on Availability)
- 11.2.2 Mersen
- 11.2.2.1. Overview
- 11.2.2.2. Products
- 11.2.2.3. SWOT Analysis
- 11.2.2.4. Recent Developments
- 11.2.2.5. Financials (Based on Availability)
- 11.2.3 Toyo Tanso
- 11.2.3.1. Overview
- 11.2.3.2. Products
- 11.2.3.3. SWOT Analysis
- 11.2.3.4. Recent Developments
- 11.2.3.5. Financials (Based on Availability)
- 11.2.4 Wuxing New Material
- 11.2.4.1. Overview
- 11.2.4.2. Products
- 11.2.4.3. SWOT Analysis
- 11.2.4.4. Recent Developments
- 11.2.4.5. Financials (Based on Availability)
- 11.2.5 DaTong XinCheng
- 11.2.5.1. Overview
- 11.2.5.2. Products
- 11.2.5.3. SWOT Analysis
- 11.2.5.4. Recent Developments
- 11.2.5.5. Financials (Based on Availability)
- 11.2.6 Tokai Carbon
- 11.2.6.1. Overview
- 11.2.6.2. Products
- 11.2.6.3. SWOT Analysis
- 11.2.6.4. Recent Developments
- 11.2.6.5. Financials (Based on Availability)
- 11.2.7 Jiangxi Ningxin New Materials
- 11.2.7.1. Overview
- 11.2.7.2. Products
- 11.2.7.3. SWOT Analysis
- 11.2.7.4. Recent Developments
- 11.2.7.5. Financials (Based on Availability)
- 11.2.8 IBIDEN
- 11.2.8.1. Overview
- 11.2.8.2. Products
- 11.2.8.3. SWOT Analysis
- 11.2.8.4. Recent Developments
- 11.2.8.5. Financials (Based on Availability)
- 11.2.9 Pingdingshan Oriental Carbon
- 11.2.9.1. Overview
- 11.2.9.2. Products
- 11.2.9.3. SWOT Analysis
- 11.2.9.4. Recent Developments
- 11.2.9.5. Financials (Based on Availability)
- 11.2.10 Nippon Carbon
- 11.2.10.1. Overview
- 11.2.10.2. Products
- 11.2.10.3. SWOT Analysis
- 11.2.10.4. Recent Developments
- 11.2.10.5. Financials (Based on Availability)
- 11.2.11 Fangda Carbon
- 11.2.11.1. Overview
- 11.2.11.2. Products
- 11.2.11.3. SWOT Analysis
- 11.2.11.4. Recent Developments
- 11.2.11.5. Financials (Based on Availability)
- 11.2.12 Pingdingshan Boxiang Carbon
- 11.2.12.1. Overview
- 11.2.12.2. Products
- 11.2.12.3. SWOT Analysis
- 11.2.12.4. Recent Developments
- 11.2.12.5. Financials (Based on Availability)
- 11.2.13 Sinosteel
- 11.2.13.1. Overview
- 11.2.13.2. Products
- 11.2.13.3. SWOT Analysis
- 11.2.13.4. Recent Developments
- 11.2.13.5. Financials (Based on Availability)
- 11.2.14 Dahua Glory Special Graphite
- 11.2.14.1. Overview
- 11.2.14.2. Products
- 11.2.14.3. SWOT Analysis
- 11.2.14.4. Recent Developments
- 11.2.14.5. Financials (Based on Availability)
- 11.2.15 Graphite India Ltd
- 11.2.15.1. Overview
- 11.2.15.2. Products
- 11.2.15.3. SWOT Analysis
- 11.2.15.4. Recent Developments
- 11.2.15.5. Financials (Based on Availability)
- 11.2.16 Entegris
- 11.2.16.1. Overview
- 11.2.16.2. Products
- 11.2.16.3. SWOT Analysis
- 11.2.16.4. Recent Developments
- 11.2.16.5. Financials (Based on Availability)
- 11.2.17 Kaiyuan Special Graphite
- 11.2.17.1. Overview
- 11.2.17.2. Products
- 11.2.17.3. SWOT Analysis
- 11.2.17.4. Recent Developments
- 11.2.17.5. Financials (Based on Availability)
- 11.2.18 Zhongnan Diamond
- 11.2.18.1. Overview
- 11.2.18.2. Products
- 11.2.18.3. SWOT Analysis
- 11.2.18.4. Recent Developments
- 11.2.18.5. Financials (Based on Availability)
- 11.2.19 SEC Carbon
- 11.2.19.1. Overview
- 11.2.19.2. Products
- 11.2.19.3. SWOT Analysis
- 11.2.19.4. Recent Developments
- 11.2.19.5. Financials (Based on Availability)
- 11.2.20 Qingdao Tennry Carbon
- 11.2.20.1. Overview
- 11.2.20.2. Products
- 11.2.20.3. SWOT Analysis
- 11.2.20.4. Recent Developments
- 11.2.20.5. Financials (Based on Availability)
- 11.2.21 Morgan
- 11.2.21.1. Overview
- 11.2.21.2. Products
- 11.2.21.3. SWOT Analysis
- 11.2.21.4. Recent Developments
- 11.2.21.5. Financials (Based on Availability)
- 11.2.22 GrafTech
- 11.2.22.1. Overview
- 11.2.22.2. Products
- 11.2.22.3. SWOT Analysis
- 11.2.22.4. Recent Developments
- 11.2.22.5. Financials (Based on Availability)
- 11.2.1 SGL Group
List of Figures
- Figure 1: Global Graphite Products for Photovoltaic Revenue Breakdown (million, %) by Region 2024 & 2032
- Figure 2: Global Graphite Products for Photovoltaic Volume Breakdown (K, %) by Region 2024 & 2032
- Figure 3: North America Graphite Products for Photovoltaic Revenue (million), by Application 2024 & 2032
- Figure 4: North America Graphite Products for Photovoltaic Volume (K), by Application 2024 & 2032
- Figure 5: North America Graphite Products for Photovoltaic Revenue Share (%), by Application 2024 & 2032
- Figure 6: North America Graphite Products for Photovoltaic Volume Share (%), by Application 2024 & 2032
- Figure 7: North America Graphite Products for Photovoltaic Revenue (million), by Types 2024 & 2032
- Figure 8: North America Graphite Products for Photovoltaic Volume (K), by Types 2024 & 2032
- Figure 9: North America Graphite Products for Photovoltaic Revenue Share (%), by Types 2024 & 2032
- Figure 10: North America Graphite Products for Photovoltaic Volume Share (%), by Types 2024 & 2032
- Figure 11: North America Graphite Products for Photovoltaic Revenue (million), by Country 2024 & 2032
- Figure 12: North America Graphite Products for Photovoltaic Volume (K), by Country 2024 & 2032
- Figure 13: North America Graphite Products for Photovoltaic Revenue Share (%), by Country 2024 & 2032
- Figure 14: North America Graphite Products for Photovoltaic Volume Share (%), by Country 2024 & 2032
- Figure 15: South America Graphite Products for Photovoltaic Revenue (million), by Application 2024 & 2032
- Figure 16: South America Graphite Products for Photovoltaic Volume (K), by Application 2024 & 2032
- Figure 17: South America Graphite Products for Photovoltaic Revenue Share (%), by Application 2024 & 2032
- Figure 18: South America Graphite Products for Photovoltaic Volume Share (%), by Application 2024 & 2032
- Figure 19: South America Graphite Products for Photovoltaic Revenue (million), by Types 2024 & 2032
- Figure 20: South America Graphite Products for Photovoltaic Volume (K), by Types 2024 & 2032
- Figure 21: South America Graphite Products for Photovoltaic Revenue Share (%), by Types 2024 & 2032
- Figure 22: South America Graphite Products for Photovoltaic Volume Share (%), by Types 2024 & 2032
- Figure 23: South America Graphite Products for Photovoltaic Revenue (million), by Country 2024 & 2032
- Figure 24: South America Graphite Products for Photovoltaic Volume (K), by Country 2024 & 2032
- Figure 25: South America Graphite Products for Photovoltaic Revenue Share (%), by Country 2024 & 2032
- Figure 26: South America Graphite Products for Photovoltaic Volume Share (%), by Country 2024 & 2032
- Figure 27: Europe Graphite Products for Photovoltaic Revenue (million), by Application 2024 & 2032
- Figure 28: Europe Graphite Products for Photovoltaic Volume (K), by Application 2024 & 2032
- Figure 29: Europe Graphite Products for Photovoltaic Revenue Share (%), by Application 2024 & 2032
- Figure 30: Europe Graphite Products for Photovoltaic Volume Share (%), by Application 2024 & 2032
- Figure 31: Europe Graphite Products for Photovoltaic Revenue (million), by Types 2024 & 2032
- Figure 32: Europe Graphite Products for Photovoltaic Volume (K), by Types 2024 & 2032
- Figure 33: Europe Graphite Products for Photovoltaic Revenue Share (%), by Types 2024 & 2032
- Figure 34: Europe Graphite Products for Photovoltaic Volume Share (%), by Types 2024 & 2032
- Figure 35: Europe Graphite Products for Photovoltaic Revenue (million), by Country 2024 & 2032
- Figure 36: Europe Graphite Products for Photovoltaic Volume (K), by Country 2024 & 2032
- Figure 37: Europe Graphite Products for Photovoltaic Revenue Share (%), by Country 2024 & 2032
- Figure 38: Europe Graphite Products for Photovoltaic Volume Share (%), by Country 2024 & 2032
- Figure 39: Middle East & Africa Graphite Products for Photovoltaic Revenue (million), by Application 2024 & 2032
- Figure 40: Middle East & Africa Graphite Products for Photovoltaic Volume (K), by Application 2024 & 2032
- Figure 41: Middle East & Africa Graphite Products for Photovoltaic Revenue Share (%), by Application 2024 & 2032
- Figure 42: Middle East & Africa Graphite Products for Photovoltaic Volume Share (%), by Application 2024 & 2032
- Figure 43: Middle East & Africa Graphite Products for Photovoltaic Revenue (million), by Types 2024 & 2032
- Figure 44: Middle East & Africa Graphite Products for Photovoltaic Volume (K), by Types 2024 & 2032
- Figure 45: Middle East & Africa Graphite Products for Photovoltaic Revenue Share (%), by Types 2024 & 2032
- Figure 46: Middle East & Africa Graphite Products for Photovoltaic Volume Share (%), by Types 2024 & 2032
- Figure 47: Middle East & Africa Graphite Products for Photovoltaic Revenue (million), by Country 2024 & 2032
- Figure 48: Middle East & Africa Graphite Products for Photovoltaic Volume (K), by Country 2024 & 2032
- Figure 49: Middle East & Africa Graphite Products for Photovoltaic Revenue Share (%), by Country 2024 & 2032
- Figure 50: Middle East & Africa Graphite Products for Photovoltaic Volume Share (%), by Country 2024 & 2032
- Figure 51: Asia Pacific Graphite Products for Photovoltaic Revenue (million), by Application 2024 & 2032
- Figure 52: Asia Pacific Graphite Products for Photovoltaic Volume (K), by Application 2024 & 2032
- Figure 53: Asia Pacific Graphite Products for Photovoltaic Revenue Share (%), by Application 2024 & 2032
- Figure 54: Asia Pacific Graphite Products for Photovoltaic Volume Share (%), by Application 2024 & 2032
- Figure 55: Asia Pacific Graphite Products for Photovoltaic Revenue (million), by Types 2024 & 2032
- Figure 56: Asia Pacific Graphite Products for Photovoltaic Volume (K), by Types 2024 & 2032
- Figure 57: Asia Pacific Graphite Products for Photovoltaic Revenue Share (%), by Types 2024 & 2032
- Figure 58: Asia Pacific Graphite Products for Photovoltaic Volume Share (%), by Types 2024 & 2032
- Figure 59: Asia Pacific Graphite Products for Photovoltaic Revenue (million), by Country 2024 & 2032
- Figure 60: Asia Pacific Graphite Products for Photovoltaic Volume (K), by Country 2024 & 2032
- Figure 61: Asia Pacific Graphite Products for Photovoltaic Revenue Share (%), by Country 2024 & 2032
- Figure 62: Asia Pacific Graphite Products for Photovoltaic Volume Share (%), by Country 2024 & 2032
List of Tables
- Table 1: Global Graphite Products for Photovoltaic Revenue million Forecast, by Region 2019 & 2032
- Table 2: Global Graphite Products for Photovoltaic Volume K Forecast, by Region 2019 & 2032
- Table 3: Global Graphite Products for Photovoltaic Revenue million Forecast, by Application 2019 & 2032
- Table 4: Global Graphite Products for Photovoltaic Volume K Forecast, by Application 2019 & 2032
- Table 5: Global Graphite Products for Photovoltaic Revenue million Forecast, by Types 2019 & 2032
- Table 6: Global Graphite Products for Photovoltaic Volume K Forecast, by Types 2019 & 2032
- Table 7: Global Graphite Products for Photovoltaic Revenue million Forecast, by Region 2019 & 2032
- Table 8: Global Graphite Products for Photovoltaic Volume K Forecast, by Region 2019 & 2032
- Table 9: Global Graphite Products for Photovoltaic Revenue million Forecast, by Application 2019 & 2032
- Table 10: Global Graphite Products for Photovoltaic Volume K Forecast, by Application 2019 & 2032
- Table 11: Global Graphite Products for Photovoltaic Revenue million Forecast, by Types 2019 & 2032
- Table 12: Global Graphite Products for Photovoltaic Volume K Forecast, by Types 2019 & 2032
- Table 13: Global Graphite Products for Photovoltaic Revenue million Forecast, by Country 2019 & 2032
- Table 14: Global Graphite Products for Photovoltaic Volume K Forecast, by Country 2019 & 2032
- Table 15: United States Graphite Products for Photovoltaic Revenue (million) Forecast, by Application 2019 & 2032
- Table 16: United States Graphite Products for Photovoltaic Volume (K) Forecast, by Application 2019 & 2032
- Table 17: Canada Graphite Products for Photovoltaic Revenue (million) Forecast, by Application 2019 & 2032
- Table 18: Canada Graphite Products for Photovoltaic Volume (K) Forecast, by Application 2019 & 2032
- Table 19: Mexico Graphite Products for Photovoltaic Revenue (million) Forecast, by Application 2019 & 2032
- Table 20: Mexico Graphite Products for Photovoltaic Volume (K) Forecast, by Application 2019 & 2032
- Table 21: Global Graphite Products for Photovoltaic Revenue million Forecast, by Application 2019 & 2032
- Table 22: Global Graphite Products for Photovoltaic Volume K Forecast, by Application 2019 & 2032
- Table 23: Global Graphite Products for Photovoltaic Revenue million Forecast, by Types 2019 & 2032
- Table 24: Global Graphite Products for Photovoltaic Volume K Forecast, by Types 2019 & 2032
- Table 25: Global Graphite Products for Photovoltaic Revenue million Forecast, by Country 2019 & 2032
- Table 26: Global Graphite Products for Photovoltaic Volume K Forecast, by Country 2019 & 2032
- Table 27: Brazil Graphite Products for Photovoltaic Revenue (million) Forecast, by Application 2019 & 2032
- Table 28: Brazil Graphite Products for Photovoltaic Volume (K) Forecast, by Application 2019 & 2032
- Table 29: Argentina Graphite Products for Photovoltaic Revenue (million) Forecast, by Application 2019 & 2032
- Table 30: Argentina Graphite Products for Photovoltaic Volume (K) Forecast, by Application 2019 & 2032
- Table 31: Rest of South America Graphite Products for Photovoltaic Revenue (million) Forecast, by Application 2019 & 2032
- Table 32: Rest of South America Graphite Products for Photovoltaic Volume (K) Forecast, by Application 2019 & 2032
- Table 33: Global Graphite Products for Photovoltaic Revenue million Forecast, by Application 2019 & 2032
- Table 34: Global Graphite Products for Photovoltaic Volume K Forecast, by Application 2019 & 2032
- Table 35: Global Graphite Products for Photovoltaic Revenue million Forecast, by Types 2019 & 2032
- Table 36: Global Graphite Products for Photovoltaic Volume K Forecast, by Types 2019 & 2032
- Table 37: Global Graphite Products for Photovoltaic Revenue million Forecast, by Country 2019 & 2032
- Table 38: Global Graphite Products for Photovoltaic Volume K Forecast, by Country 2019 & 2032
- Table 39: United Kingdom Graphite Products for Photovoltaic Revenue (million) Forecast, by Application 2019 & 2032
- Table 40: United Kingdom Graphite Products for Photovoltaic Volume (K) Forecast, by Application 2019 & 2032
- Table 41: Germany Graphite Products for Photovoltaic Revenue (million) Forecast, by Application 2019 & 2032
- Table 42: Germany Graphite Products for Photovoltaic Volume (K) Forecast, by Application 2019 & 2032
- Table 43: France Graphite Products for Photovoltaic Revenue (million) Forecast, by Application 2019 & 2032
- Table 44: France Graphite Products for Photovoltaic Volume (K) Forecast, by Application 2019 & 2032
- Table 45: Italy Graphite Products for Photovoltaic Revenue (million) Forecast, by Application 2019 & 2032
- Table 46: Italy Graphite Products for Photovoltaic Volume (K) Forecast, by Application 2019 & 2032
- Table 47: Spain Graphite Products for Photovoltaic Revenue (million) Forecast, by Application 2019 & 2032
- Table 48: Spain Graphite Products for Photovoltaic Volume (K) Forecast, by Application 2019 & 2032
- Table 49: Russia Graphite Products for Photovoltaic Revenue (million) Forecast, by Application 2019 & 2032
- Table 50: Russia Graphite Products for Photovoltaic Volume (K) Forecast, by Application 2019 & 2032
- Table 51: Benelux Graphite Products for Photovoltaic Revenue (million) Forecast, by Application 2019 & 2032
- Table 52: Benelux Graphite Products for Photovoltaic Volume (K) Forecast, by Application 2019 & 2032
- Table 53: Nordics Graphite Products for Photovoltaic Revenue (million) Forecast, by Application 2019 & 2032
- Table 54: Nordics Graphite Products for Photovoltaic Volume (K) Forecast, by Application 2019 & 2032
- Table 55: Rest of Europe Graphite Products for Photovoltaic Revenue (million) Forecast, by Application 2019 & 2032
- Table 56: Rest of Europe Graphite Products for Photovoltaic Volume (K) Forecast, by Application 2019 & 2032
- Table 57: Global Graphite Products for Photovoltaic Revenue million Forecast, by Application 2019 & 2032
- Table 58: Global Graphite Products for Photovoltaic Volume K Forecast, by Application 2019 & 2032
- Table 59: Global Graphite Products for Photovoltaic Revenue million Forecast, by Types 2019 & 2032
- Table 60: Global Graphite Products for Photovoltaic Volume K Forecast, by Types 2019 & 2032
- Table 61: Global Graphite Products for Photovoltaic Revenue million Forecast, by Country 2019 & 2032
- Table 62: Global Graphite Products for Photovoltaic Volume K Forecast, by Country 2019 & 2032
- Table 63: Turkey Graphite Products for Photovoltaic Revenue (million) Forecast, by Application 2019 & 2032
- Table 64: Turkey Graphite Products for Photovoltaic Volume (K) Forecast, by Application 2019 & 2032
- Table 65: Israel Graphite Products for Photovoltaic Revenue (million) Forecast, by Application 2019 & 2032
- Table 66: Israel Graphite Products for Photovoltaic Volume (K) Forecast, by Application 2019 & 2032
- Table 67: GCC Graphite Products for Photovoltaic Revenue (million) Forecast, by Application 2019 & 2032
- Table 68: GCC Graphite Products for Photovoltaic Volume (K) Forecast, by Application 2019 & 2032
- Table 69: North Africa Graphite Products for Photovoltaic Revenue (million) Forecast, by Application 2019 & 2032
- Table 70: North Africa Graphite Products for Photovoltaic Volume (K) Forecast, by Application 2019 & 2032
- Table 71: South Africa Graphite Products for Photovoltaic Revenue (million) Forecast, by Application 2019 & 2032
- Table 72: South Africa Graphite Products for Photovoltaic Volume (K) Forecast, by Application 2019 & 2032
- Table 73: Rest of Middle East & Africa Graphite Products for Photovoltaic Revenue (million) Forecast, by Application 2019 & 2032
- Table 74: Rest of Middle East & Africa Graphite Products for Photovoltaic Volume (K) Forecast, by Application 2019 & 2032
- Table 75: Global Graphite Products for Photovoltaic Revenue million Forecast, by Application 2019 & 2032
- Table 76: Global Graphite Products for Photovoltaic Volume K Forecast, by Application 2019 & 2032
- Table 77: Global Graphite Products for Photovoltaic Revenue million Forecast, by Types 2019 & 2032
- Table 78: Global Graphite Products for Photovoltaic Volume K Forecast, by Types 2019 & 2032
- Table 79: Global Graphite Products for Photovoltaic Revenue million Forecast, by Country 2019 & 2032
- Table 80: Global Graphite Products for Photovoltaic Volume K Forecast, by Country 2019 & 2032
- Table 81: China Graphite Products for Photovoltaic Revenue (million) Forecast, by Application 2019 & 2032
- Table 82: China Graphite Products for Photovoltaic Volume (K) Forecast, by Application 2019 & 2032
- Table 83: India Graphite Products for Photovoltaic Revenue (million) Forecast, by Application 2019 & 2032
- Table 84: India Graphite Products for Photovoltaic Volume (K) Forecast, by Application 2019 & 2032
- Table 85: Japan Graphite Products for Photovoltaic Revenue (million) Forecast, by Application 2019 & 2032
- Table 86: Japan Graphite Products for Photovoltaic Volume (K) Forecast, by Application 2019 & 2032
- Table 87: South Korea Graphite Products for Photovoltaic Revenue (million) Forecast, by Application 2019 & 2032
- Table 88: South Korea Graphite Products for Photovoltaic Volume (K) Forecast, by Application 2019 & 2032
- Table 89: ASEAN Graphite Products for Photovoltaic Revenue (million) Forecast, by Application 2019 & 2032
- Table 90: ASEAN Graphite Products for Photovoltaic Volume (K) Forecast, by Application 2019 & 2032
- Table 91: Oceania Graphite Products for Photovoltaic Revenue (million) Forecast, by Application 2019 & 2032
- Table 92: Oceania Graphite Products for Photovoltaic Volume (K) Forecast, by Application 2019 & 2032
- Table 93: Rest of Asia Pacific Graphite Products for Photovoltaic Revenue (million) Forecast, by Application 2019 & 2032
- Table 94: Rest of Asia Pacific Graphite Products for Photovoltaic Volume (K) Forecast, by Application 2019 & 2032
Frequently Asked Questions
1. What is the projected Compound Annual Growth Rate (CAGR) of the Graphite Products for Photovoltaic?
The projected CAGR is approximately XX%.
2. Which companies are prominent players in the Graphite Products for Photovoltaic?
Key companies in the market include SGL Group, Mersen, Toyo Tanso, Wuxing New Material, DaTong XinCheng, Tokai Carbon, Jiangxi Ningxin New Materials, IBIDEN, Pingdingshan Oriental Carbon, Nippon Carbon, Fangda Carbon, Pingdingshan Boxiang Carbon, Sinosteel, Dahua Glory Special Graphite, Graphite India Ltd, Entegris, Kaiyuan Special Graphite, Zhongnan Diamond, SEC Carbon, Qingdao Tennry Carbon, Morgan, GrafTech.
3. What are the main segments of the Graphite Products for Photovoltaic?
The market segments include Application, Types.
4. Can you provide details about the market size?
The market size is estimated to be USD XXX million as of 2022.
5. What are some drivers contributing to market growth?
N/A
6. What are the notable trends driving market growth?
N/A
7. Are there any restraints impacting market growth?
N/A
8. Can you provide examples of recent developments in the market?
N/A
9. What pricing options are available for accessing the report?
Pricing options include single-user, multi-user, and enterprise licenses priced at USD 3350.00, USD 5025.00, and USD 6700.00 respectively.
10. Is the market size provided in terms of value or volume?
The market size is provided in terms of value, measured in million and volume, measured in K.
11. Are there any specific market keywords associated with the report?
Yes, the market keyword associated with the report is "Graphite Products for Photovoltaic," which aids in identifying and referencing the specific market segment covered.
12. How do I determine which pricing option suits my needs best?
The pricing options vary based on user requirements and access needs. Individual users may opt for single-user licenses, while businesses requiring broader access may choose multi-user or enterprise licenses for cost-effective access to the report.
13. Are there any additional resources or data provided in the Graphite Products for Photovoltaic report?
While the report offers comprehensive insights, it's advisable to review the specific contents or supplementary materials provided to ascertain if additional resources or data are available.
14. How can I stay updated on further developments or reports in the Graphite Products for Photovoltaic?
To stay informed about further developments, trends, and reports in the Graphite Products for Photovoltaic, consider subscribing to industry newsletters, following relevant companies and organizations, or regularly checking reputable industry news sources and publications.
Methodology
Step 1 - Identification of Relevant Samples Size from Population Database


Step 2 - Approaches for Defining Global Market Size (Value, Volume* & Price*)

Note*: In applicable scenarios
Step 3 - Data Sources
Primary Research
- Web Analytics
- Survey Reports
- Research Institute
- Latest Research Reports
- Opinion Leaders
Secondary Research
- Annual Reports
- White Paper
- Latest Press Release
- Industry Association
- Paid Database
- Investor Presentations

Step 4 - Data Triangulation
Involves using different sources of information in order to increase the validity of a study
These sources are likely to be stakeholders in a program - participants, other researchers, program staff, other community members, and so on.
Then we put all data in single framework & apply various statistical tools to find out the dynamic on the market.
During the analysis stage, feedback from the stakeholder groups would be compared to determine areas of agreement as well as areas of divergence
